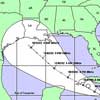
Looking interesting south of Cuba this morning.
http://www.ssd.noaa.gov/goes/east/watl/loop-avn.html
NW Carribean
Moderator: S2k Moderators
Forum rules

The posts in this forum are NOT official forecasts and should not be used as such. They are just the opinion of the poster and may or may not be backed by sound meteorological data. They are NOT endorsed by any professional institution or STORM2K. For official information, please refer to products from the National Hurricane Center and National Weather Service.
-
Stormcenter
- S2K Supporter

- Posts: 6689
- Joined: Wed Sep 03, 2003 11:27 am
- Location: Houston, TX
NW Carribean
0 likes

-
Stormcenter
- S2K Supporter
- Posts: 6689
- Joined: Wed Sep 03, 2003 11:27 am
- Location: Houston, TX
boca wrote:It does look good but its the ULL over SW Florida interacting with a westward tropical wave.
I'm not so sure of that.
http://www.ssd.noaa.gov/goes/east/watl/loop-vis.html
http://www.ssd.noaa.gov/goes/east/watl/loop-avn.html
0 likes
You can see on the sat the wave from Cuba southward towards Belize moving west, but it really is a tough call. Tomorrow the wave will be along the Yucatan coastline then eventually in the BOC and then Texas will get bombed again with rain which you guys still need.
Last edited by boca on Thu Jul 06, 2006 8:11 am, edited 1 time in total.
0 likes
-
HouTXmetro

- Category 5

- Posts: 3949
- Joined: Sun Jun 13, 2004 6:00 pm
- Location: District of Columbia, USA
Stormcenter wrote:boca wrote:It does look good but its the ULL over SW Florida interacting with a westward tropical wave.
I'm not so sure of that.
http://www.ssd.noaa.gov/goes/east/watl/loop-vis.html
http://www.ssd.noaa.gov/goes/east/watl/loop-avn.html
What makes you think that? There is an upper low interacting with that wave and enhancing convection.
0 likes
[Disclaimer: My Amateur Opinion, please defer to your local authorities or the NHC for Guidance.]
Yes I agree its a wave interacting with the ULL clearly moving west towards the Yucatan as shown on the visible and IR. Stormcenter check this out it might help you decide on this mess.
http://www.ssd.noaa.gov/goes/flt/t1/loop-avn.html
http://www.ssd.noaa.gov/goes/flt/t1/loop-avn.html
0 likes

boca wrote:Yes I agree its a wave interacting with the ULL clearly moving west towards the Yucatan as shown on the visible and IR.
Yes it's interacting with a ULL, but it's the new one forming just south of the tip of western Cuba. Clearly visible on WV loop. TUTT may be setting up here.
http://www.ssd.noaa.gov/goes/east/gmex/loop-wv.html
Last edited by tailgater on Thu Jul 06, 2006 8:25 am, edited 1 time in total.
0 likes

-
gatorcane

- S2K Supporter
- Posts: 23708
- Age: 48
- Joined: Sun Mar 13, 2005 3:54 pm
- Location: Boca Raton, FL
Kennethb wrote:A trough in July is a little different from a trough in September. Very rare to get a front down into Louisiana in July. It might be something to see how this all plays out.
Season looks alot like 2004 - strong troughs and no activity early
Remember Charley? How about that front for mid-August?
Lets see if things get going in about 4 weeks from now
0 likes
-
mvtrucking

- S2K Supporter
- Posts: 698
- Age: 67
- Joined: Sat Jul 09, 2005 10:01 am
- Location: Monroe,La

Well you have a piece of a frontal trof with low pressure sliding down off the TX coast and a fairly vigorous tropical wave heading in from the east. This kind of stuff takes time to crank, but it's an obvious setup for potential tropical development. It's not the kind of setup that gets to IH proportions, but you can easily get a TS or Cat 1 out of the scenario. I wouldn't look for anything until Sunday or Monday though - if at all.
Steve
Steve
0 likes
-
HouTXmetro
- Category 5
- Posts: 3949
- Joined: Sun Jun 13, 2004 6:00 pm
- Location: District of Columbia, USA
boca wrote:You can see on the sat the wave from Cuba southward towards Belize moving west, but it really is a tough call. Tomorrow the wave will be along the Yucatan coastline then eventually in the BOC and then Texas will get bombed again with rain which you guys still need.
Umm, I got over 20+ inches of rain in almost a month time frame. We don't need any in SE Texas.
0 likes
[Disclaimer: My Amateur Opinion, please defer to your local authorities or the NHC for Guidance.]
-
gatorcane
- S2K Supporter
- Posts: 23708
- Age: 48
- Joined: Sun Mar 13, 2005 3:54 pm
- Location: Boca Raton, FL
HouTXmetro wrote:boca wrote:You can see on the sat the wave from Cuba southward towards Belize moving west, but it really is a tough call. Tomorrow the wave will be along the Yucatan coastline then eventually in the BOC and then Texas will get bombed again with rain which you guys still need.
Umm, I got over 20+ inches of rain in almost a month time frame. We don't need any in SE Texas.
Hmmm, you sure you are in Houston? According to records I have looked at you only received 7.84 inches in June....
PRELIMINARY LOCAL CLIMATOLOGICAL DATA (WS FORM: F-6)
STATION: HOUSTON
MONTH: JUNE
YEAR: 2006
LATITUDE: 29 58 N
LONGITUDE: 95 21 W
TEMPERATURE IN F:CPN: SNOW: WIND :SUNSHINE: SKY
================================================================================
1 2 3 4 5 6A 6B 7 8 9 10 11 12 13 14 15 16 17 18
AVG MX 2MIN
DY MAX MIN AVG DEP HDD CDD WTR SNW DPTH SPD SPD DIR MIN PSBL S-S WX SPD DR
================================================================================
1 82 72 77 -2 0 12 0.05 0.0 0 4.8 9 120 M M 8 138 M M
2 91 72 82 3 0 17 T 0.0 0 3.2 13 10 M M 7 18 14 360
3 91 72 82 2 0 17 0.00 0.0 0 5.6 14 40 M M 3 18 16 40
4 92 71 82 2 0 17 0.00 0.0 0 3.9 12 160 M M 2 18 15 150
5 91 71 81 1 0 16 0.00 0.0 0 4.7 13 90 M M 2 18 15 90
6 92 71 82 2 0 17 0.00 0.0 0 5.3 15 150 M M 1 18 17 190
7 93 69 81 1 0 16 0.00 0.0 0 5.3 13 150 M M 2 18 15 200
8 93 72 83 3 0 18 0.00 0.0 0 4.2 9 190 M M 3 18 14 170
9 94 73 84 3 0 19 T 0.0 0 5.7 12 170 M M 5 14 160
10 94 73 84 3 0 19 0.00 0.0 0 5.5 18 140 M M 2 18 22 140
11 91 71 81 0 0 16 0.00 0.0 0 6.0 17 140 M M 2 18 21 130
12 96 67 82 1 0 17 0.00 0.0 0 2.5 12 110 M M 1 1 14 110
13 100 75 88 7 0 23 T 0.0 0 6.5 33 60 M M 3 3 40 60
14 91 71 81 0 0 16 0.00 0.0 0 7.0 14 120 M M 4 8 16 120
15 92 67 80 -1 0 15 0.00 0.0 0 8.7 25 140 M M 4 18 29 140
16 89 76 83 2 0 18 0.02 0.0 0 13.4 24 140 M M 7 30 120
17 87 69 78 -4 0 13 1.43 0.0 0 10.1 28 150 M M 8 1238 30 150
18 90 72 81 -1 0 16 1.18 0.0 0 6.9 23 150 M M 8 13 29 290
19 82 73 78 -4 0 13 4.43 0.0 0 8.0 21 100 M M 8 13 26 100
20 84 72 78 -4 0 13 0.14 0.0 0 8.1 17 160 M M 8 1 21 160
21 92 73 83 1 0 18 0.00 0.0 0 8.7 18 140 M M 5 1 23 150
22 90 71 81 -1 0 16 0.51 0.0 0 6.3 31 290 M M 7 13 38 280
23 94 72 83 1 0 18 0.00 0.0 0 3.9 15 150 M M 5 1 17 150
24 92 75 84 2 0 19 0.00 0.0 0 4.2 12 50 M M 5 18 14 10
25 95 75 85 3 0 20 0.00 0.0 0 5.1 16 340 M M 5 138 18 330
26 95 74 85 2 0 20 0.00 0.0 0 7.5 17 360 M M 5 8 28 10
27 91 69 80 -3 0 15 0.00 0.0 0 5.6 13 10 M M 5 16 20
28 91 68 80 -3 0 15 0.00 0.0 0 4.0 14 30 M M 6 16 40
29 91 69 80 -3 0 15 0.00 0.0 0 4.4 10 60 M M 6 8 13 80
30 91 69 80 -3 0 15 0.08 0.0 0 3.5 18 170 M M 7 138 21 170
================================================================================
SM 2737 2144 0 499 7.84 0.0 178.6 M 144
================================================================================
AV 91.2 71.5 6.0 FASTST PSBL % 5 MAX(MPH)
MISC ----> # 33 60 # 40 60
================================================================================
NOTES:
# LAST OF SEVERAL OCCURRENCES
COLUMN 17 PEAK WIND IN M.P.H.
PRELIMINARY LOCAL CLIMATOLOGICAL DATA (WS FORM: F-6) , PAGE 2
STATION: HOUSTON
MONTH: JUNE
YEAR: 2006
LATITUDE: 29 58 N
LONGITUDE: 95 21 W
[TEMPERATURE DATA] [PRECIPITATION DATA] SYMBOLS USED IN COLUMN 16
AVERAGE MONTHLY: 81.3 TOTAL FOR MONTH: 7.84 1 = FOG OR MIST
DPTR FM NORMAL: 0.0 DPTR FM NORMAL: 2.49 2 = FOG REDUCING VISIBILITY
HIGHEST: 100 ON 13 GRTST 24HR 4.63 ON 18-19 TO 1/4 MILE OR LESS
LOWEST: 67 ON 15,12 3 = THUNDER
SNOW, ICE PELLETS, HAIL 4 = ICE PELLETS
TOTAL MONTH: 0.0 INCH 5 = HAIL
GRTST 24HR 0.0 6 = FREEZING RAIN OR DRIZZLE
GRTST DEPTH: 0 7 = DUSTSTORM OR SANDSTORM:
VSBY 1/2 MILE OR LESS
8 = SMOKE OR HAZE
[NO. OF DAYS WITH] [WEATHER - DAYS WITH] 9 = BLOWING SNOW
X = TORNADO
MAX 32 OR BELOW: 0 0.01 INCH OR MORE: 8
MAX 90 OR ABOVE: 25 0.10 INCH OR MORE: 5
MIN 32 OR BELOW: 0 0.50 INCH OR MORE: 4
MIN 0 OR BELOW: 0 1.00 INCH OR MORE: 3
[HDD (BASE 65) ]
TOTAL THIS MO. 0 CLEAR (SCALE 0-3) 10
DPTR FM NORMAL 0 PTCLDY (SCALE 4-7) 15
TOTAL FM JUL 1 1120 CLOUDY (SCALE 8-10) 5
DPTR FM NORMAL -405
[CDD (BASE 65) ]
TOTAL THIS MO. 499
DPTR FM NORMAL 14 [PRESSURE DATA]
TOTAL FM JAN 1 1290 HIGHEST SLP M ON M
DPTR FM NORMAL 231 LOWEST SLP M ON M
[REMARKS]
#FINAL-06-06#
0 likes
-
WindRunner

- Category 5
- Posts: 5803
- Age: 35
- Joined: Fri Jul 29, 2005 8:07 pm
- Location: Warrenton, VA, but Albany, NY for school
- Contact:
-
swimaster20
- Category 1

- Posts: 285
- Joined: Tue Nov 23, 2004 2:41 pm
- Location: The Heart of Cajun Country
-
HouTXmetro
- Category 5
- Posts: 3949
- Joined: Sun Jun 13, 2004 6:00 pm
- Location: District of Columbia, USA
GATORCANE,
In the last 30 days My neighborhood has received 13.66 inches of rain. In the last 40 days my neighborhood in Houston has received 21.22 inches of rain. I live on the Far Southeastern side of Houston so I am somewhat closer to the Bay.
This links verify's the rainfall rates across town. Just click the amount of days and it will do the math for all areas of houston.
http://www.hcoem.org/default2.php
0 likes
[Disclaimer: My Amateur Opinion, please defer to your local authorities or the NHC for Guidance.]
Who is online
Users browsing this forum: No registered users and 291 guests