NOAA 2008 Atlantic Season Outlook=12-16 Named Storms
Moderator: S2k Moderators
Forum rules

The posts in this forum are NOT official forecasts and should not be used as such. They are just the opinion of the poster and may or may not be backed by sound meteorological data. They are NOT endorsed by any professional institution or STORM2K. For official information, please refer to products from the National Hurricane Center and National Weather Service.
-
wobblehead
- Tropical Storm

- Posts: 133
- Joined: Fri Jul 15, 2005 12:51 pm
- Location: Mobile.Al
-
JonathanBelles
- Professional-Met

- Posts: 11430
- Age: 35
- Joined: Sat Dec 24, 2005 9:00 pm
- Location: School: Florida State University (Tallahassee, FL) Home: St. Petersburg, Florida
- Contact:
-
wobblehead
- Tropical Storm
- Posts: 133
- Joined: Fri Jul 15, 2005 12:51 pm
- Location: Mobile.Al


Re:
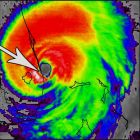
fact789 wrote:If that diagram does show placement of the Azores-Bermuda High, we can expect fish.
The upper higher pressure doesn't seem like the mid-Atlantic high displaced over Africa? Does look fishy though.
I haven't read more detail, need an expert
On the press conference, I heard the forecast takes into account two main climatic factors: the multi-decadal cycle and the weakening of La Nina, which effects may lag by several months.
With probability at 25 percent near or normal; 65 percent above normal; 10 percent below, altogether a 1 in 3 chance of normal or below, explains the ranges with near-normal numbers at the low end.
Wouldn't want to see the high end -- 5 majors.
0 likes
-
Ad Novoxium
- Category 1

- Posts: 348
- Age: 35
- Joined: Sat May 03, 2008 2:12 am
Re:
wobblehead wrote:Does anyone know what classifies a season as "hyperactive" as mentioned in the report?
What is the threshold for this classification? Any season above normal?
Wiki entries on ACE (take with a grain of salt) have the 1969 season as the lowest "hyperactive" season and 1980 as the highest non-hyperactive season. Looking at their ACEs (bold):
1969 Atlantic hurricane season 158 17 12 5 Above normal (hyperactive)
1980 Atlantic hurricane season 147 11 9 2 Above normal
One would guess that its between these two numbers. My guess is either a nice round 150 or 155.
0 likes
-
wxman57

- Moderator-Pro Met

- Posts: 23126
- Age: 68
- Joined: Sat Jun 21, 2003 8:06 pm
- Location: Houston, TX (southwest)
Re:
fact789 wrote:If that diagram does show placement of the Azores-Bermuda High, we can expect fish.
I'm not sure what diagram you're talking about, but NOAA didn't produce a forecast for the placement of the Bermuda High.
0 likes
-
JonathanBelles
- Professional-Met
- Posts: 11430
- Age: 35
- Joined: Sat Dec 24, 2005 9:00 pm
- Location: School: Florida State University (Tallahassee, FL) Home: St. Petersburg, Florida
- Contact:
-
wobblehead
- Tropical Storm
- Posts: 133
- Joined: Fri Jul 15, 2005 12:51 pm
- Location: Mobile.Al
-
wobblehead
- Tropical Storm
- Posts: 133
- Joined: Fri Jul 15, 2005 12:51 pm
- Location: Mobile.Al
Fact89,
I could be wrong but I think the graphic you refer to is to be considered in general and not specific. As stated in the report the period of May to July is a time of transition in the Atlantic Basin and I don't think the best of the best would dare try to make placement of the high as mentioned.
I could be wrong but I think the graphic you refer to is to be considered in general and not specific. As stated in the report the period of May to July is a time of transition in the Atlantic Basin and I don't think the best of the best would dare try to make placement of the high as mentioned.
0 likes
-
Ad Novoxium
- Category 1
- Posts: 348
- Age: 35
- Joined: Sat May 03, 2008 2:12 am
However, ACE averages (Below Normal, Near Normal, Above Normal, etc) relies on activity in the basin prior. Let's take, for instance, the Atlantic (starting in 1950). The number that ends below normal and starts near normal is likely 65 or 70.
2007 Atlantic hurricane season 72 15 6 2 Near normal
1984 Atlantic hurricane season 71 12 5 1 Near normal
1978 Atlantic hurricane season 62 11 5 2 Below normal
1974 Atlantic hurricane season 61 7 4 2 Below normal
In Atlantic history, only about two hurricanes (Ivan and San Ciriaco) have higher ACEs than that (70.4 and 73.6 respectively), regardless of whether its 65 or 70. The next three closest ACE ratings that I found to 65 while not being over it are Donna (64.55), Isabel (63.28) and Dog of 1950 (62.55. By comparison, the 72 hours as Cat 5 Allen had 52.3).
While on subject, the following seasons have been called "Hyperactive" (with 1980 for comparison):
(1980 "Above Average" (147. Highest single storm ACE: Allen 52.3)
1969 (158. HSS ACE: Inga with 31.64),
1996 (166. HSS ACE: Edouard with 49.31),
1964 (170. HSS ACE: Cleo with 37.67),
2003 (175. HSS ACE: Isabel with 63.28),
1999 (177. HSS ACE: Gert with 42.31),
1998 (182. HSS ACE: Georges with 39.4),
1955 (199. HSS ACE: Connie with 43.08),
1961 (205. HSS ACE: Esther with 52.15 (Project Stormfury)
2004 (225. HSS ACE: Ivan with 70.4)
1995 (228. HSS ACE: Luis with 53.9)
1950 (243. HSS ACE: Dog with 62.55. Most major hurricanes in season)
2005 (248. HSS ACE: Wilma with 38.9. Most hurricanes and storms in a season)
=================================
In the East Pacific (starting in 1971), however, the dividing line is higher, as seen here:
2001 Pacific hurricane season 90 15 8 2 Near normal
1980 Pacific hurricane season 77 14 7 3 Below normal
1981 Pacific hurricane season 72 15 8 1 Below normal
2004 Pacific hurricane season 71 12 6 3 Below normal
Assuming that 80 is the ACE dividing line, one hurricane in a Pacific hurricane season (Ioke) had a higher ACE rating (Ioke had an 82 ACE rating, the highest ever). Ioke's ACE is composed of its ACE in the CPac (34.2) and WPac (47.8). However, I don't have a John of 1994 ACE rating, but it's probably in this range too.
Also, there's no "hyperactive" season designation. If there was a boundary (say the same as with the Atl 150-155 estimate), the following would be considered as hyperactive:
1992 Pacific hurricane season 290 27 16 10 Above normal
1990 Pacific hurricane season 249 21 16 6 Above normal
1978 Pacific hurricane season 207 19 14 7 Above normal
1983 Pacific hurricane season 206 21 12 8 Above normal
1993 Pacific hurricane season 201 15 11 9 Above normal
1984 Pacific hurricane season 193 21 13 7 Above normal
1985 Pacific hurricane season 192 23 13 8 Above normal
1994 Pacific hurricane season 185 20 10 5 Above normal (John. Shares record for most Cat. 5s in a season with 2002 (3 of them, Emilia, Gilma, and John.)
1991 Pacific hurricane season 178 14 10 5 Above normal
1997 Pacific hurricane season 167 19 9 7 Above normal
1982 Pacific hurricane season 161 23 12 5 Above normal
2006 Pacific hurricane season 155 19 11 6 Above normal (Ioke)
(Side note: 2002 had 124 ACE. I don't know what the highest ACE storm was. Possibly Kenna or Fausto.)
This has been me talking too much. Thank you!
0 likes
-
Blown Away
- S2K Supporter

- Posts: 10253
- Joined: Wed May 26, 2004 6:17 am
Re: Re:
wxman57 wrote:fact789 wrote:If that diagram does show placement of the Azores-Bermuda High, we can expect fish.
I'm not sure what diagram you're talking about, but NOAA didn't produce a forecast for the placement of the Bermuda High.
This one:

0 likes
-
wobblehead
- Tropical Storm
- Posts: 133
- Joined: Fri Jul 15, 2005 12:51 pm
- Location: Mobile.Al
Re: NOAA 2008 Atlantic Season Outlook=12-16 Named Storms
The climate prediction center report states, "The current active hurricane era began in 1995. Hurricane seasons during 1995-2007 have averaged 14.5 named storms, 8 hurricanes, and 4 major hurricanes, with an average ACE index of 167% of the median. NOAA classifies nine of the thirteen seasons since 1995 as above normal, with seven being hyperactive (ACE > 175% of median). Only four seasons since 1995 have not been above normal. These include the three El Niño years (1997, 2002, and 2006) and the 2007 season".
Evidently NOAA classifies seasons based on ACE values with hyperactive as one of the classifications.
2007 is included in the four seasons that have not been above normal but is distinguished from the other three in that it was not an El Nino year.
Evidently NOAA classifies seasons based on ACE values with hyperactive as one of the classifications.
2007 is included in the four seasons that have not been above normal but is distinguished from the other three in that it was not an El Nino year.
0 likes
Who is online
Users browsing this forum: No registered users and 169 guests