With NCEP forecasting El Nino by July- Please correct me if I am wrong, this
hurricane season for the Altantic should be less active compared
with the past 15 years or so (1995-2009). Probably low 10s for the number
of storms, based on this. The Pacific should be more active than past
years given the warmer water.
This would follow a pattern of 2 very intense years followed by a
less intense year:
2004-2005 very intense, 2006, less intense
2007-2008 very intense (esp. with 2 cat 5s in 07; and Ike/Gustav, etc. 2008)
2009, less intense
ENSO Updates (2007 thru 2023)
Moderator: S2k Moderators
Forum rules

The posts in this forum are NOT official forecasts and should not be used as such. They are just the opinion of the poster and may or may not be backed by sound meteorological data. They are NOT endorsed by any professional institution or STORM2K. For official information, please refer to products from the National Hurricane Center and National Weather Service.
-
Tampa Bay Hurricane
- Category 5

- Posts: 5597
- Age: 38
- Joined: Fri Jul 22, 2005 7:54 pm
- Location: St. Petersburg, FL
Re: ENSO Updates
One thing to keep in mind is that what made the 2004-2005 and 2008 seasons so destructive was largely due to the high percentage of hurricanes that were steered over the US coastline.
2004 saw 6 majors, 2005 had 7 majors, and 2008 had 5 majors. The landfall locations of all the storms (including tropical storms)....where they formed and the steering patterns that guided them...has alot to do with what makes a season a 'memorable' one. 1992 was one of the least active seasons in years...7 named storms, 4 hurricanes, and only 1 major. But what a major that A storm was..over $26 billion in 1992 $ (almost $40 billion in 2008 $). 1992 was a weak el nino year (part of 1991-92 el nino) i believe.
On the flip side, take a season like 1996....14 named storms, 10 hurricanes, of which 6 became majors....but in terms of overall damage done, the entire season did an estimated $3.8 billion in damage ($5.0 billion in 2008 $).
Looking back at the 2004 season, Dr. Gray lowered his May forecast of 14/8/3 for the upcoming season to 13/7/3 on August 6th..citing the developing mild el nino as a factor reducing activity. It wasn't just Dr. Gray....NOAA's August 2004 outlook for the rest of the season stated:
However, weak El Niño conditions are possible during the next few months, which makes the probability of an above-normal season slightly less likely from that stated in May, and the probability of a near-normal season slightly more likely. Whether El Niño forms or not, considerable tropical storm and hurricane activity is expected this season.
http://www.cpc.noaa.gov/products/outloo ... icane.html
All he** broke loose for florida shortly after when Charley hit on August 13th...followed by Frances, Ivan, and Jeanne.
0 likes
-
Tampa Bay Hurricane
- Category 5
- Posts: 5597
- Age: 38
- Joined: Fri Jul 22, 2005 7:54 pm
- Location: St. Petersburg, FL
I remember reading the 2004 August forecast and thinking that there would
be nothing to worry about. I WAS DEAD WRONG. I told my friends, as the "weather" freak, that this
season might not even have a threatening hurricane. A few days later- the TV stations were
telling me to run for my life being 5 ft above Tampa Bay and on the Bay...
as Charley threatened (What the HECK just happened with El Nino supposed to
kill off the canes- my thought)- that
was a surprise, but I thought of Charley as a "freak" storm like 92's
Andrew...but 3 more came along; Seeing Charley get to a Cat 4 I
was floored with shock- when they said El Nino I thought about the
1997 season (I was only 9 years old, but I remembered the barrage of
tornado outbreaks that hit Florida during 97/98; and I also remembered
thinking that that somehow "compensated" for the energy of the quiet 97
hurricane season)---> I was SHOCKED because I was too young to remember
Andrew- I was only 4 years old during Andrew and lived in Missouri and moved to Florida 2 years later...
Certainly there could be a few storms during an El Nino year that become
devastating. Andrew was a catastrophic storm, and also an "El Nino"
freak storm...since you'd think the Nino year would be much quieter...
During 2006 there were some strong hurricanes near Bermuda...
0 likes
-
Tampa Bay Hurricane
- Category 5
- Posts: 5597
- Age: 38
- Joined: Fri Jul 22, 2005 7:54 pm
- Location: St. Petersburg, FL
-
cycloneye

- Admin

- Posts: 149405
- Age: 69
- Joined: Thu Oct 10, 2002 10:54 am
- Location: San Juan, Puerto Rico
Re: ENSO Updates
The latest NCEP forecast pushes even more back the start of El Nino now to Mid June from the last forecast of a July start.

0 likes
-
HurricaneBill
- Category 5
- Posts: 3419
- Joined: Sun Apr 11, 2004 5:51 pm
- Location: East Longmeadow, MA, USA
Re:
Tampa Bay Hurricane wrote:Was Andrew a "freak" storm? Or is one "freak" storm common during
El Ninos?
I don't think El Nino completely reduces the risk of a bad storm. There have been several El Nino seasons where a strong hurricane was in the Gulf of Mexico. 1965(Betsy), 1969(Camille), 1977(Anita), 1983(Alicia), 1992(Andrew), 2002(Isidore, Lili), and 2004(Charley, Ivan).
With the 2004 El Nino, it didn't really seem to impact the Atlantic until October. Notice that around the beginning of October, the Atlantic went from very active to very quiet.
However, the El Nino was present in the other basins during the 2004 season. The WPAC had several super typhoons and Japan fared worse than Florida. Japan was impacted by at least 10 typhoons.
0 likes
-
Tampa Bay Hurricane
- Category 5
- Posts: 5597
- Age: 38
- Joined: Fri Jul 22, 2005 7:54 pm
- Location: St. Petersburg, FL

I think with 2004 the El Nino was pretty weak until August time and it often takes a month or two lag before things kick in, we saw that with the 1997 season with the first two months actually being very busy, then as El Nino massivly ramped up the lag effect arrived and killed nearly everything.
0 likes
-
wxman57

- Moderator-Pro Met

- Posts: 23173
- Age: 68
- Joined: Sat Jun 21, 2003 8:06 pm
- Location: Houston, TX (southwest)
Re:
KWT wrote:I think with 2004 the El Nino was pretty weak until August time and it often takes a month or two lag before things kick in, we saw that with the 1997 season with the first two months actually being very busy, then as El Nino massivly ramped up the lag effect arrived and killed nearly everything.
The archived data are still online for 2004-2005. Doesn't look much different from what is now predicted by the NCEP models.
0 likes
-
Derek Ortt
-
cycloneye
- Admin
- Posts: 149405
- Age: 69
- Joined: Thu Oct 10, 2002 10:54 am
- Location: San Juan, Puerto Rico
Re: ENSO Updates
Is there an explanation about why the SOI index is moving upwards fast (Now at +8.3 after being at -.4 on March 29) and the ENSO models continue to forecast warm ENSO?
SOI Data
2009022820090329 -.4
2009030120090330 .8
2009030220090331 .8
2009030320090401 1.1
2009030420090402 1.4
2009030520090403 1.7
2009030620090404 2
2009030720090405 1.8
2009030820090406 2.1
2009030920090407 1.9
2009031020090408 2.8
2009031120090409 3.1
2009031220090410 3.5
2009031320090411 3.9
2009031420090412 4.3
2009031520090413 5.3
2009031620090414 5.1
2009031720090415 5.5
2009031820090416 5.9
2009031920090417 7.7
2009032020090418 6.8
2009032120090419 7.3
2009032220090420 7.8
2009032320090421 8.3
http://www.bom.gov.au/climate/enso/soi.dt3
0 likes
-
cycloneye
- Admin
- Posts: 149405
- Age: 69
- Joined: Thu Oct 10, 2002 10:54 am
- Location: San Juan, Puerto Rico
Re:
KWT wrote:There can be some disconnect between the ENSO state and the SOI, though if it lasts a while then it'll be interesting.
It keeps creeping up now up to +8.8.
2009022820090329 -.4
2009030120090330 .8
2009030220090331 .8
2009030320090401 1.1
2009030420090402 1.4
2009030520090403 1.7
2009030620090404 2
2009030720090405 1.8
2009030820090406 2.1
2009030920090407 1.9
2009031020090408 2.8
2009031120090409 3.1
2009031220090410 3.5
2009031320090411 3.9
2009031420090412 4.3
2009031520090413 5.3
2009031620090414 5.1
2009031720090415 5.5
2009031820090416 5.9
2009031920090417 7.7
2009032020090418 6.8
2009032120090419 7.3
2009032220090420 7.8
2009032320090421 8.3
2009032420090422 8.8
http://www.bom.gov.au/climate/enso/soi.dt3
0 likes
Re: ENSO Updates
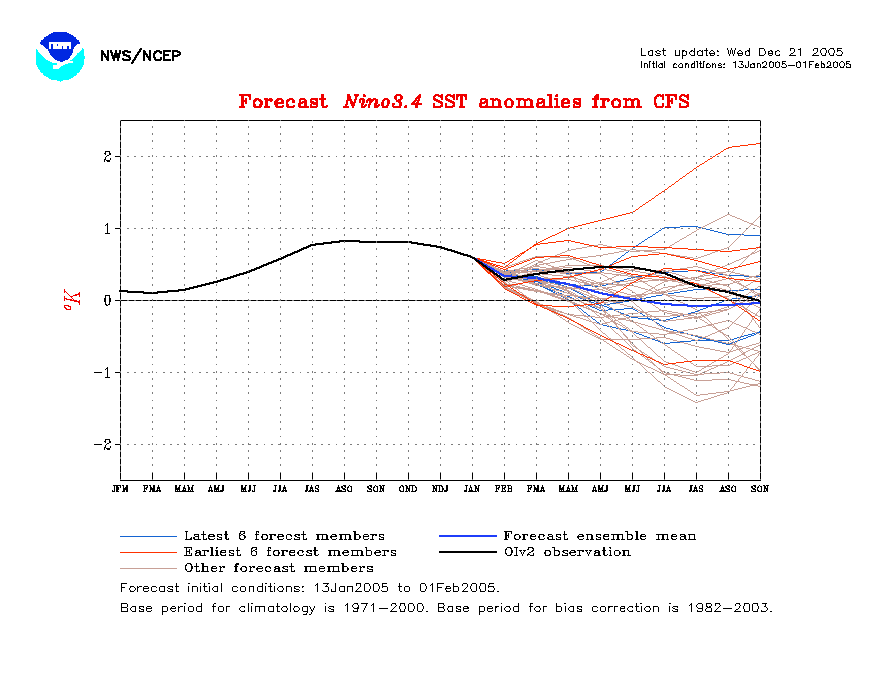
IRI (The International Research Institute for Climate and Society) updated its ENSO forecast for the rest of the year on April 15th....ENSO-neutral conditions most likely to persist for the rest of 2009. Probability of el nino for 3-month time periods starts as low as 2% for April-May-June 2009, increases to 20% for July-August-September 2009, and peaks at 30% for August-September-Octover through early 2010 at 30%. More likely than not, they are forecasting an ENSO neutral season ahead.
ENSO Update
15 April 2009
Summary
The equatorial Pacific has returned to ENSO-neutral this month, after exhibiting weak La Niña conditions since December 2008. During the Apr-Jun season there is an approximately 75% probability of maintaining ENSO-neutral conditions, and that is predicted to be the most likely situation through the end of 2009 and into early 2010. The likelihood of returning to La Niña conditions remains below 25% probability.
General Discussion
La Niña conditions that were evident since early December have been weakening since early 2009. ENSO-neutral conditions, as indexed by the NINO3.4 SST anomaly index, have been observed since the beginning of April 2009. The atmospheric anomalies still show some characteristics of La Nina, such as in the equatorial Southern Oscillation index and the strengthened low-level equatorial winds. However, based on the ocean's current state, a return to cooler than average sea temperatures, would require persistence of those atmospheric anomalies.
Out of a large set of dynamical and statistical forecast models, two-thirds indicate maintenance of ENSO-neutral conditions during the Apr-May-Jun season in progress. Overall, based on model forecasts and current observations of the ocean surface and subsurface, the probability of ENSO-neutral conditions is estimated at 75%, of El Niño conditions about 2%, and the probability of returning to La Niña conditions is about 23% for the Apr-May-Jun season in progress.

http://iri.columbia.edu/climate/ENSO/cu ... discussion
This is in line with the majority of models...which as of last update are forecasting ENSO neutral (in the graphic below....as defined by SST variance from -0.5C to +0.5C.)

Comparing current conditions and trends to prior years...notice how the January-April period is typically one where the transition to el nino takes place....the slope this year is much flatter than prior events and is starting lower in (+) SST anomaly (i.e., more of a La Nina). Somewhat comparable to 1985-1988 levels so far...not sure if there can be any legit comparison to those seasons, but the 1985-88 seasons featured more long trackers to the west than fish storms....more like the 2004 florida season in recent years.

ENSO Update
15 April 2009
Summary
The equatorial Pacific has returned to ENSO-neutral this month, after exhibiting weak La Niña conditions since December 2008. During the Apr-Jun season there is an approximately 75% probability of maintaining ENSO-neutral conditions, and that is predicted to be the most likely situation through the end of 2009 and into early 2010. The likelihood of returning to La Niña conditions remains below 25% probability.
General Discussion
La Niña conditions that were evident since early December have been weakening since early 2009. ENSO-neutral conditions, as indexed by the NINO3.4 SST anomaly index, have been observed since the beginning of April 2009. The atmospheric anomalies still show some characteristics of La Nina, such as in the equatorial Southern Oscillation index and the strengthened low-level equatorial winds. However, based on the ocean's current state, a return to cooler than average sea temperatures, would require persistence of those atmospheric anomalies.
Out of a large set of dynamical and statistical forecast models, two-thirds indicate maintenance of ENSO-neutral conditions during the Apr-May-Jun season in progress. Overall, based on model forecasts and current observations of the ocean surface and subsurface, the probability of ENSO-neutral conditions is estimated at 75%, of El Niño conditions about 2%, and the probability of returning to La Niña conditions is about 23% for the Apr-May-Jun season in progress.
http://iri.columbia.edu/climate/ENSO/cu ... discussion
This is in line with the majority of models...which as of last update are forecasting ENSO neutral (in the graphic below....as defined by SST variance from -0.5C to +0.5C.)
Comparing current conditions and trends to prior years...notice how the January-April period is typically one where the transition to el nino takes place....the slope this year is much flatter than prior events and is starting lower in (+) SST anomaly (i.e., more of a La Nina). Somewhat comparable to 1985-1988 levels so far...not sure if there can be any legit comparison to those seasons, but the 1985-88 seasons featured more long trackers to the west than fish storms....more like the 2004 florida season in recent years.
0 likes
-
cycloneye
- Admin
- Posts: 149405
- Age: 69
- Joined: Thu Oct 10, 2002 10:54 am
- Location: San Juan, Puerto Rico
Re: ENSO Updates
The SOI keeps climbing this Saturday,now up too +9.9.This climbing started on March 30th.
SOI Data
2009022720090328 0
2009022820090329 -.4
2009030120090330 .8
2009030220090331 .8
2009030320090401 1.1
2009030420090402 1.4
2009030520090403 1.7
2009030620090404 2
2009030720090405 1.8
2009030820090406 2.1
2009030920090407 1.9
2009031020090408 2.8
2009031120090409 3.1
2009031220090410 3.5
2009031320090411 3.9
2009031420090412 4.3
2009031520090413 5.3
2009031620090414 5.1
2009031720090415 5.5
2009031820090416 5.9
2009031920090417 7.7
2009032020090418 6.8
2009032120090419 7.3
2009032220090420 7.8
2009032320090421 8.3
2009032420090422 8.8
2009032520090423 8.6
2009032620090424 9.9
http://www.bom.gov.au/climate/enso/soi.dt3
Look at that V in the graphic.
0 likes
Re: ENSO Updates
Isn't a higher number (+) indicative of La Nina pattern?
cycloneye wrote:The SOI keeps climbing this Saturday,now up too +9.9.This climbing started on March 30th
0 likes
-
cycloneye
- Admin
- Posts: 149405
- Age: 69
- Joined: Thu Oct 10, 2002 10:54 am
- Location: San Juan, Puerto Rico
Re: ENSO Updates=SOI continues to climb now at +9.9
Isn't a higher number (+) indicative of La Nina pattern?
Positive SOI means cooler ENSO and Negative SOI is the warmer side.I wonder why the ENSO models are lagging way back of the SOI data.
0 likes
Re: ENSO Updates=SOI continues to climb now at +9.9
Higher positive SOI reading indicative of La Nina pattern...another piece of evidence that we may be very well heading for the 'ENSO neutral' season that most are forecasting.
The Southern Oscillation Index (SOI) is one measure of the large-scale fluctuations in air pressure occurring between the western and eastern tropical Pacific (i.e., the state of the Southern Oscillation) during El Niño and La Niña episodes. Traditionally, this index has been calculated based on the differences in air pressure anomaly between Tahiti and Darwin, Australia. In general, smoothed time series of the SOI correspond very well with changes in ocean temperatures across the eastern tropical Pacific. The negative phase of the SOI represents below-normal air pressure at Tahiti and above-normal air pressure at Darwin. Prolonged periods of negative SOI values coincide with abnormally warm ocean waters across the eastern tropical Pacific typical of El Niño episodes. Prolonged periods of positive SOI values coincide with abnormally cold ocean waters across the eastern tropical Pacific typical of La Niña episodes.
http://www.cpc.noaa.gov/products/analys ... /soi.shtml
0 likes
-
cycloneye
- Admin
- Posts: 149405
- Age: 69
- Joined: Thu Oct 10, 2002 10:54 am
- Location: San Juan, Puerto Rico
Re: ENSO Updates
The SOI keeps climbing this,now up to + 10.3.This climbing started on March 30th.
SOI Data
2009022820090329 -.4
2009030120090330 .8
2009030220090331 .8
2009030320090401 1.1
2009030420090402 1.4
2009030520090403 1.7
2009030620090404 2
2009030720090405 1.8
2009030820090406 2.1
2009030920090407 1.9
2009031020090408 2.8
2009031120090409 3.1
2009031220090410 3.5
2009031320090411 3.9
2009031420090412 4.3
2009031520090413 5.3
2009031620090414 5.1
2009031720090415 5.5
2009031820090416 5.9
2009031920090417 7.7
2009032020090418 6.8
2009032120090419 7.3
2009032220090420 7.8
2009032320090421 8.3
2009032420090422 8.8
2009032520090423 8.6
2009032620090424 9.9
2009032720090425 9.7
2009032820090426 10.3
0 likes
Who is online
Users browsing this forum: jconsor and 317 guests