But Florida seems to be the place the models are pointing, even the GFDL, sort of.
You have to see the HWRF run.
Moderator: S2k Moderators


But Florida seems to be the place the models are pointing, even the GFDL, sort of.


Derek Ortt wrote:new CMC shows NOTHING
likely nothing to see it appears. Afternoon satellite imagery also trends toward that direction


wxman57 wrote:Models in better agreement at least in taking the lower-level vorticity center northward then NE across Florida. GFS gave up on NW Gulf impact as of 12Z. Can't understand the upgrade to a MDT chance by NHC, as I see no evidence of increasing organization. Wave axis is separating from convection again. No LLC. Development chances maybe 20-25% beyond 48 hours.
Just looking at the low-level flow projected by all models for the next 3-5 days, I could see a track northward then NE across the mid to lower FL peninsula. But this "track" may only represent an area of thunderstorms vs. a TS/H.
One thing I still believe is that IF (big IF) it does develop and get into the south-central Gulf, then conditions aloft would be favorable for steady intensification.
I like that term "High Pressure of Death" across Texas.
cycloneye wrote:
What I understand about why they upgraded the code may be because when it reaches the GOM,then it will have better conditions.
Code: Select all
                    *   ATLANTIC SHIPS INTENSITY FORECAST       *
                    *      GOES DATA AVAILABLE                  *
                    *      OHC  DATA AVAILABLE                  *
                    *      INVEST  AL932009  06/26/09  18 UTC   *

TIME (HR)          0     6    12    18    24    36    48    60    72    84    96   108   120
V (KT) NO LAND    20    21    23    25    28    33    41    47    55    59    63    65    68
V (KT) LAND       20    21    23    25    28    29    37    44    51    55    60    62    65
V (KT) LGE mod    20    20    21    21    22    23    29    33    38    45    52    59    63

SHEAR (KT)         8    10     9     3    13     2     8     4     5    11     6    13    11
SHEAR DIR        251   229   255   131   129   254    75    20    20   316   344   299   310
SST (C)         28.7  28.8  28.7  28.5  28.3  28.0  27.9  27.9  27.9  28.0  27.9  27.9  27.8
POT. INT. (KT)   147   149   147   144   140   135   132   130   131   131   131   132   132
ADJ. POT. INT.   139   143   139   134   129   119   114   111   112   112   114   115   116
200 MB T (C)   -53.5 -53.2 -53.3 -53.3 -52.9 -52.6 -52.5 -52.5 -52.4 -52.4 -52.5 -52.6 -53.0
TH_E DEV (C)      12    12    10    10    12    10    11    11    12    12    13    12    13
700-500 MB RH     65    65    69    66    66    59    61    57    58    58    54    53    55
GFS VTEX (KT)      4     6     8     8     9     8     8     7     7     7     7     7     8
850 MB ENV VOR   -22   -17   -20   -28   -21   -10     0     0    14    37    21     6     8
200 MB DIV        52    45     3    -3    -3   -20    16    17    14    16    12    20    30
LAND (KM)        140   228   160    85     8     2    78    91    75    48    53    99   170
LAT (DEG N)     17.1  18.0  18.8  19.6  20.4  21.6  22.2  22.3  22.2  22.0  22.0  22.3  22.7
LONG(DEG W)     84.4  85.2  86.0  86.6  87.2  88.1  88.5  88.6  88.4  88.2  88.4  88.9  89.9
STM SPEED (KT)     9    11    10    10     9     5     2     0     1     0     2     4     5
HEAT CONTENT      54    60    67    58    31     0     3     4     3     1     1     5    11

  FORECAST TRACK FROM BAMM      INITIAL HEADING/SPEED (DEG/KT):315/  8      CX,CY:  -5/  6
  T-12 MAX WIND:  20            PRESSURE OF STEERING LEVEL (MB):  603  (MEAN=624)
  GOES IR BRIGHTNESS TEMP. STD DEV.  50-200 KM RAD:  25.0 (MEAN=14.5)
  % GOES IR PIXELS WITH T < -20 C    50-200 KM RAD:  49.0 (MEAN=65.0)

                        INDIVIDUAL CONTRIBUTIONS TO INTENSITY CHANGE
                         6   12   18   24   36   48   60   72   84   96  108  120
                        ----------------------------------------------------------
  SAMPLE MEAN CHANGE     1.   2.   3.   4.   6.   8.   9.  11.  11.  12.  13.  13.
  SST POTENTIAL          0.  -1.   0.   1.   5.  10.  17.  22.  26.  28.  30.  31.
  VERTICAL SHEAR MAG     1.   3.   5.   6.   9.  11.  12.  13.  13.  14.  14.  13.
  VERTICAL SHEAR DIR     0.  -1.  -1.  -2.  -2.  -2.  -1.   0.  -1.   0.  -1.  -1.
  PERSISTENCE            0.  -1.  -1.  -1.  -1.  -1.  -1.  -1.  -1.   0.   0.   0.
  200/250 MB TEMP.       0.   0.   0.   0.  -1.  -1.  -1.  -2.  -2.  -2.  -3.  -2.
  THETA_E EXCESS         0.   0.   0.   0.   0.   0.   0.   1.   1.   1.   2.   2.
  700-500 MB RH          0.   0.   0.   0.  -1.  -1.  -1.  -1.  -1.  -2.  -2.  -2.
  GFS VORTEX TENDENCY    0.   1.   1.   2.   2.   2.   1.   1.   1.   1.   1.   1.
  850 MB ENV VORTICITY   0.  -1.  -1.  -1.  -1.  -2.  -2.  -2.  -2.  -2.  -2.  -2.
  200 MB DIVERGENCE      0.   0.   0.   0.  -1.  -1.  -2.  -2.  -2.  -2.  -1.  -1.
  ZONAL STORM MOTION     0.   0.   0.   0.   0.   0.   0.   0.   0.   0.   0.   0.
  STEERING LEVEL PRES    0.   0.   0.   0.   0.   0.   0.   0.   0.   0.   0.   0.
  DAYS FROM CLIM. PEAK   0.   0.   0.   0.   0.  -1.  -1.  -1.  -1.  -1.   0.  -1.
  GOES PREDICTORS        0.   0.   0.  -1.  -1.  -2.  -2.  -3.  -3.  -3.  -3.  -2.
  OCEAN HEAT CONTENT     0.   0.   0.   0.   0.   0.  -1.  -1.  -1.  -1.   0.   0.
                        ----------------------------------------------------------
  TOTAL CHANGE           1.   3.   5.   8.  13.  21.  27.  35.  39.  43.  45.  48.

   ** 2009 ATLANTIC RI INDEX AL932009     INVEST 06/26/09  18 UTC **
           ( 30 KT OR MORE MAX WIND INCREASE IN NEXT 24 HR)

 12 HR PERSISTENCE (KT):   0.0 Range:-45.0 to  30.0 Scaled/Wgted Val:  0.6/  1.3
 850-200 MB SHEAR (KT) :   8.7 Range: 26.2 to   3.2 Scaled/Wgted Val:  0.8/  1.0
 D200 (10**7s-1)       :  18.8 Range:-21.0 to 140.0 Scaled/Wgted Val:  0.2/  0.4
 POT = MPI-VMAX (KT)   : 116.7 Range: 33.5 to 126.5 Scaled/Wgted Val:  0.9/  0.5
 850-700 MB REL HUM (%):  71.6 Range: 56.0 to  85.0 Scaled/Wgted Val:  0.5/  0.3
 % area w/pixels <-30 C:  40.0 Range: 16.0 to 100.0 Scaled/Wgted Val:  0.3/  0.1
 STD DEV OF IR BR TEMP :  25.0 Range: 30.6 to   3.2 Scaled/Wgted Val:  0.2/  0.3
 Heat content (KJ/cm2) :  54.0 Range:  0.0 to 130.0 Scaled/Wgted Val:  0.4/  0.0

 Prob of RI for 25 kt RI threshold=    22% is   1.8 times the sample mean(12.3%)
 Prob of RI for 30 kt RI threshold=    13% is   1.6 times the sample mean( 8.0%)
 Prob of RI for 35 kt RI threshold=     8% is   1.7 times the sample mean( 4.8%)

   ##         ANNULAR HURRICANE INDEX (AHI) AL932009     INVEST 06/26/09  18 UTC         ##
   ## STORM NOT ANNULAR, SCREENING STEP FAILED, NPASS=4 NFAIL=3                          ##
   ## AHI=  0   (AHI OF 100 IS BEST FIT TO ANN. STRUC., 1 IS MARGINAL, 0 IS NOT ANNULAR) ##
## ANNULAR INDEX RAN NORMALLY lrak wrote:Derek Ortt wrote:new CMC shows NOTHING
likely nothing to see it appears. Afternoon satellite imagery also trends toward that direction
Ok a laymens post from a met? We get slammed for posts like this
What a joke
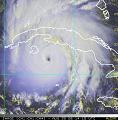

Sanibel wrote:I agree with wx57. Visible shows what looks like and open wave with convection flaring around a mildly persisting center. Yucatan could still easily destroy this and we've seen these blow down many times before. Otherwise looks like showtime for the GOM. I also agree this is an undeniable Bastardi 'hit' if it forms.

HouTXmetro wrote:IF something pops looks like Florida and North Central Guld needs to watch this one closely.
Code: Select all
WHXX01 KWBC 261814
CHGHUR
TROPICAL CYCLONE GUIDANCE MESSAGE
NWS TPC/NATIONAL HURRICANE CENTER MIAMI FL
1814 UTC FRI JUN 26 2009

DISCLAIMER...NUMERICAL MODELS ARE SUBJECT TO LARGE ERRORS.
PLEASE REFER TO NHC OFFICIAL FORECASTS FOR TROPICAL CYCLONE
AND SUBTROPICAL CYCLONE INFORMATION.

ATLANTIC OBJECTIVE AIDS FOR

DISTURBANCE INVEST (AL932009) 20090626 1800 UTC

        ...00 HRS...   ...12 HRS...   ...24 HRS. ..   ...36 HRS...
        090626  1800   090627  0600   090627  1800   090628  0600

         LAT    LON     LAT    LON     LAT    LON     LAT    LON
BAMS    17.1N  84.4W   18.3N  86.3W   19.7N  87.9W   20.4N  88.9W
BAMD    17.1N  84.4W   19.1N  85.8W   20.9N  87.0W   22.2N  87.9W
BAMM    17.1N  84.4W   18.8N  86.0W   20.4N  87.2W   21.6N  88.1W
LBAR    17.1N  84.4W   18.6N  85.6W   20.2N  86.7W   21.8N  87.4W
SHIP        20KTS          23KTS          28KTS          33KTS
DSHP        20KTS          23KTS          28KTS          29KTS

        ...48 HRS...   ...72 HRS...   ...96 HRS. ..   ..120 HRS...
        090628  1800   090629  1800   090630  1800   090701  1800

         LAT    LON     LAT    LON     LAT    LON     LAT    LON
BAMS    21.0N  89.4W   21.1N  89.4W   21.2N  89.6W   22.0N  91.7W
BAMD    22.7N  88.6W   22.7N  89.1W   22.2N  89.1W   22.4N  90.1W
BAMM    22.2N  88.5W   22.2N  88.4W   22.0N  88.4W   22.7N  89.9W
LBAR    22.8N  87.8W   24.5N  86.4W   26.4N  83.1W   30.9N  76.8W
SHIP        41KTS          55KTS          63KTS          68KTS
DSHP        37KTS          51KTS          60KTS          65KTS

         ...INITIAL CONDITIONS...
LATCUR =  17.1N LONCUR =  84.4W DIRCUR = 315DEG SPDCUR =   8KT
LATM12 =  16.2N LONM12 =  83.2W DIRM12 = 321DEG SPDM12 =   8KT
LATM24 =  14.8N LONM24 =  82.3W
WNDCUR =   20KT RMAXWD =   75NM WNDM12 =   20KT
CENPRS = 1008MB OUTPRS = 1010MB OUTRAD =  150NM SDEPTH =   M
RD34NE =    0NM RD34SE =    0NM RD34SW =    0NM RD34NW =   0NM

$$
NNNN
Users browsing this forum: No registered users and 41 guests

