Radar charts produced every 5 minutes
Upper air charts produced bidaily at 0300Z and 1500Z
Ensure you refresh for the latest imagery

Additional updates as they happen at...
http://www.twitter.com/senorpepr
http://www.twitter.com/storm2k_org
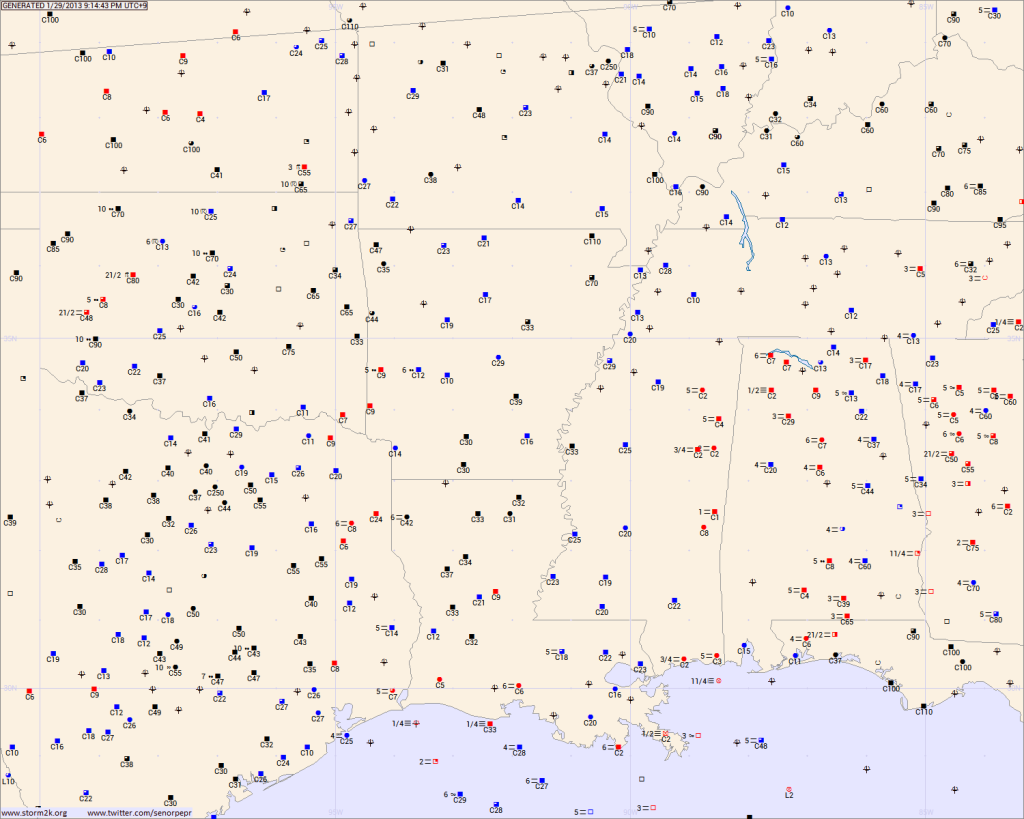
Surface Plots
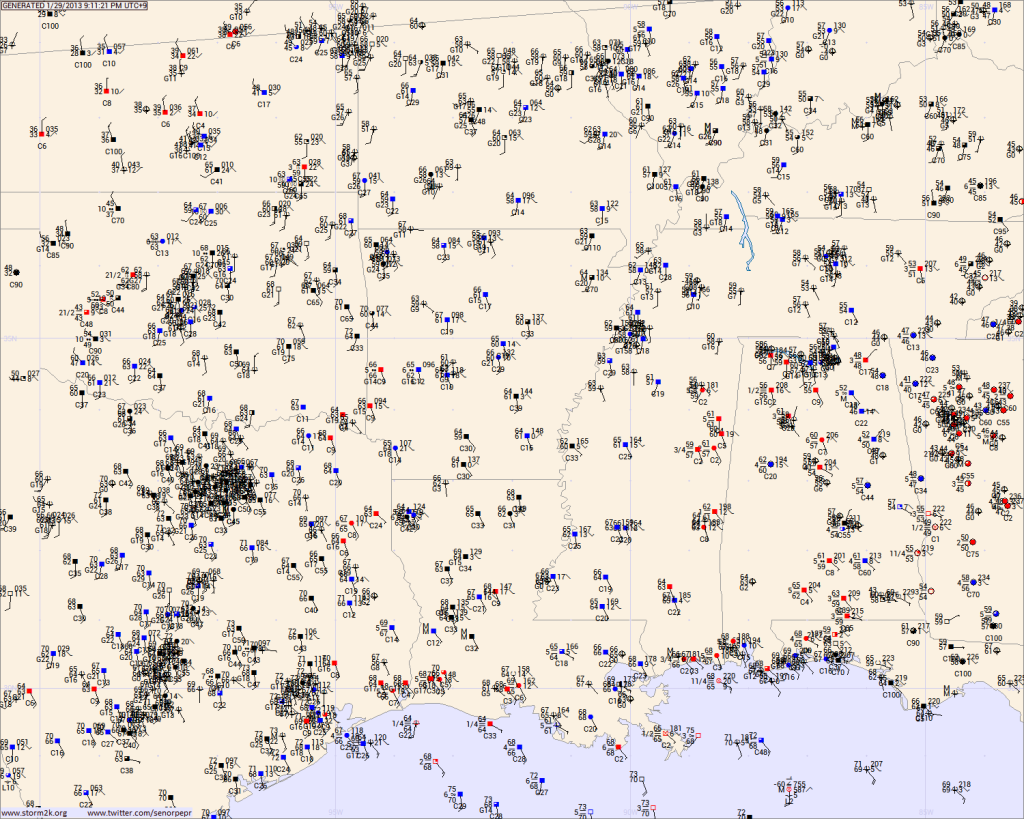
Displayed are surface plots.
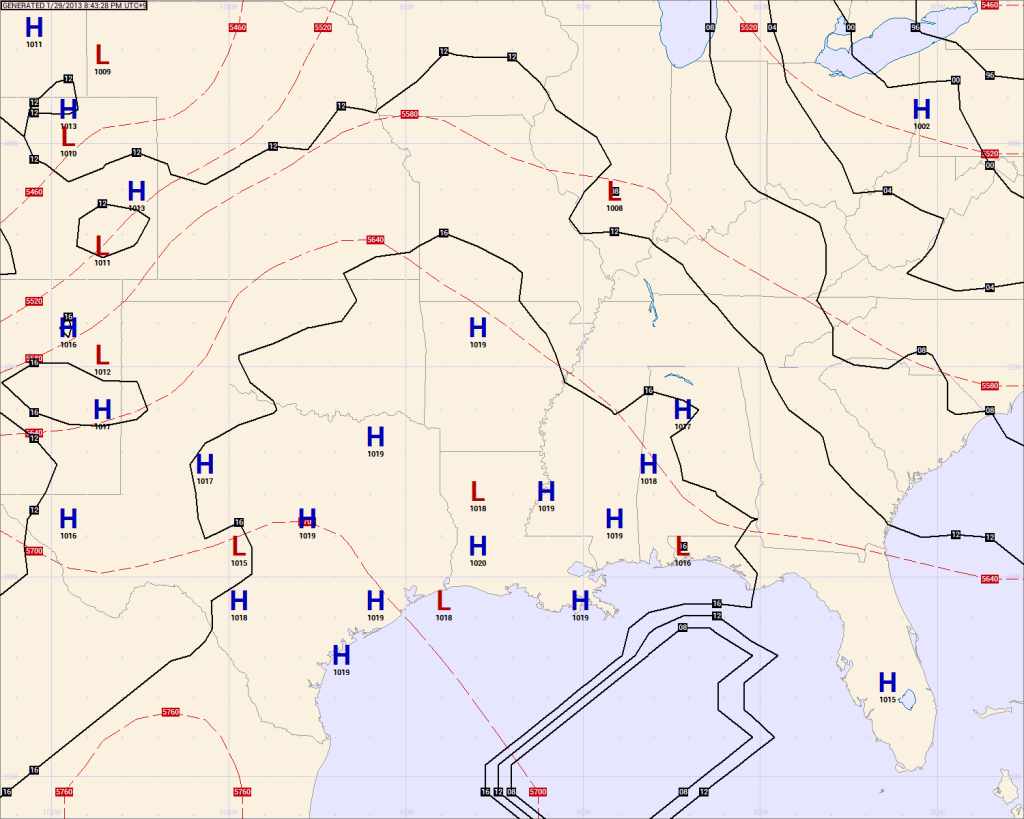
Surface Analysis
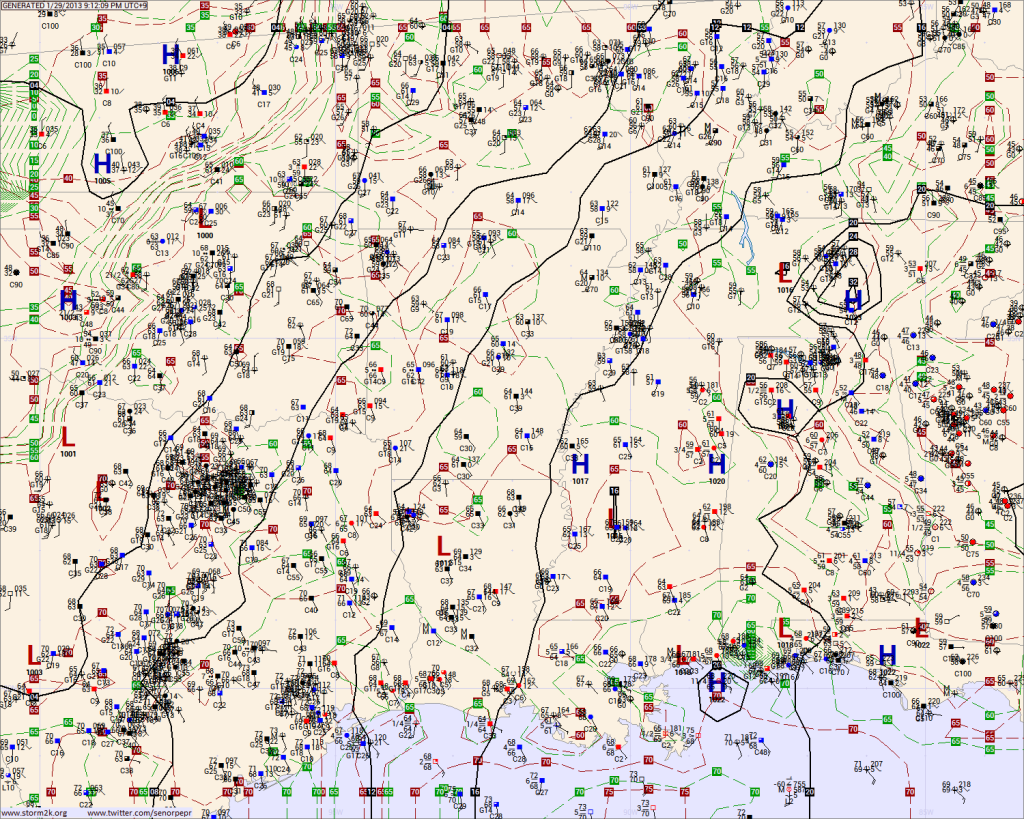
Displayed are isobars (every 4 hPa, in black), isotherms (every 5 °F, in red), isodrosotherms (every 5 °F, in green), and surface plots.
Surface Temperature
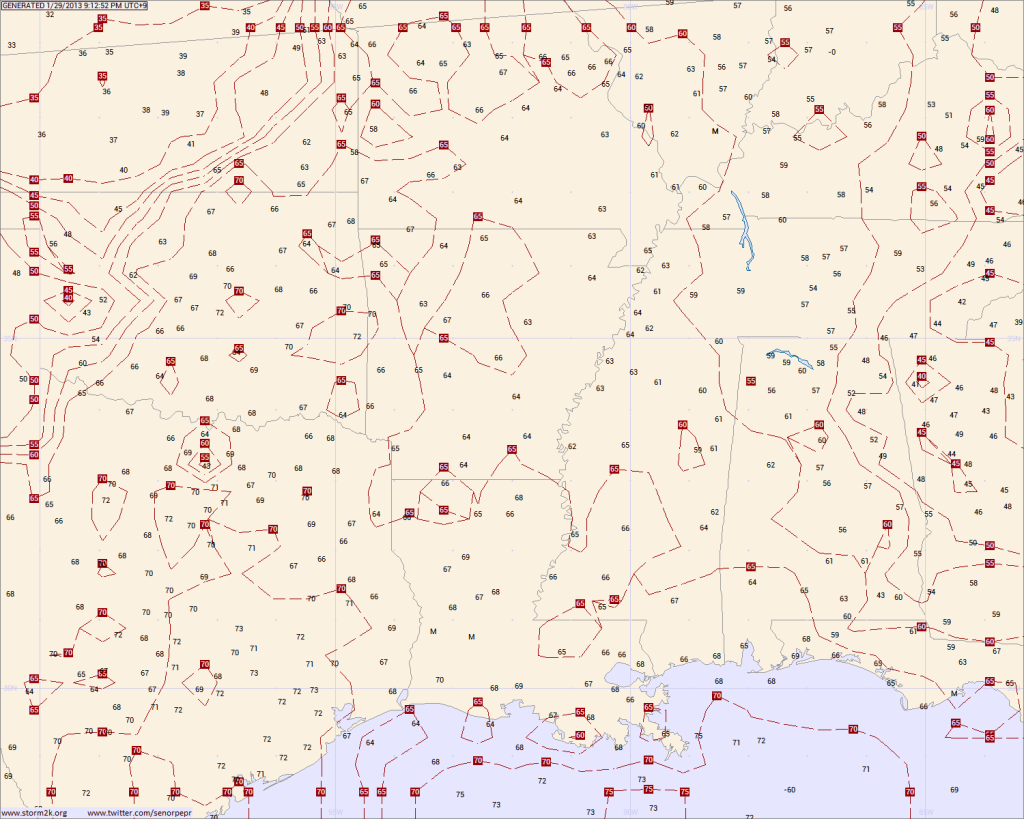
Displayed are isotherms (every 5 °F, in red) and surface temperature plots (in degrees Fahrenheit).
Surface Dewpoints
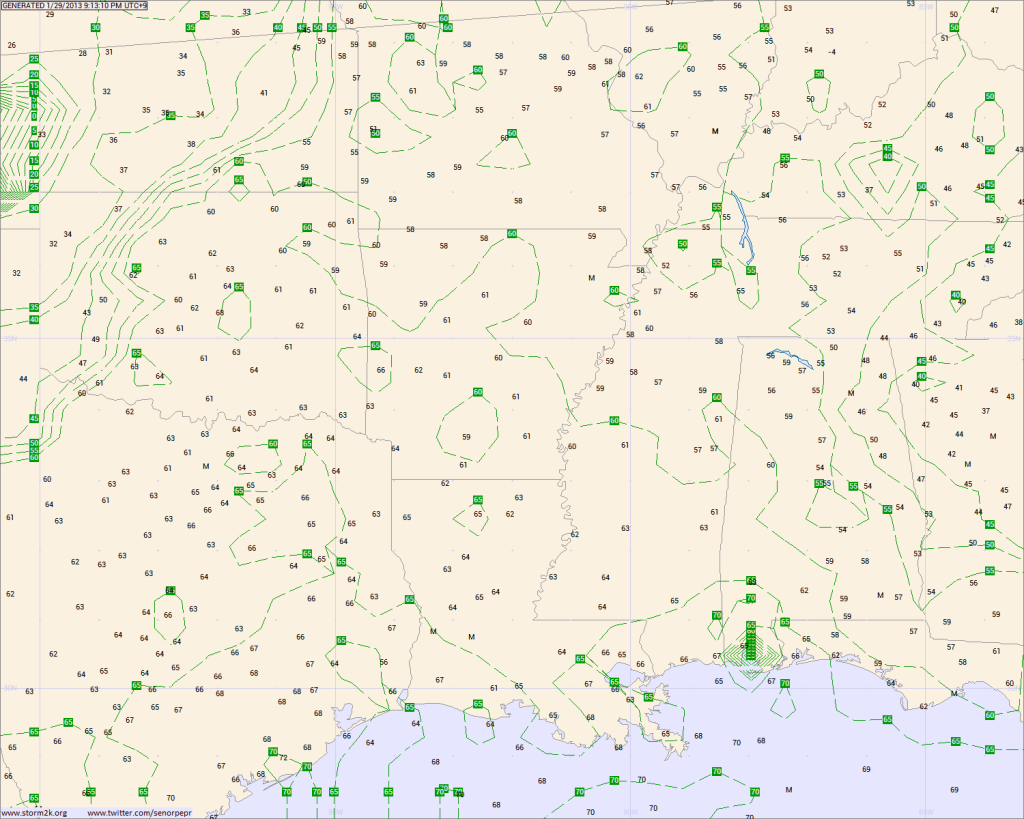
Displayed are isodrosotherms (every 5 °F, in green), and surface dewpoint plots (in degrees Fahrenheit.
Sea Level Pressure
Displayed are isobars (every 4 hPa, in black) and sea level pressure plots (in tenths of a hectoPascal, leading 9/10 dropped).
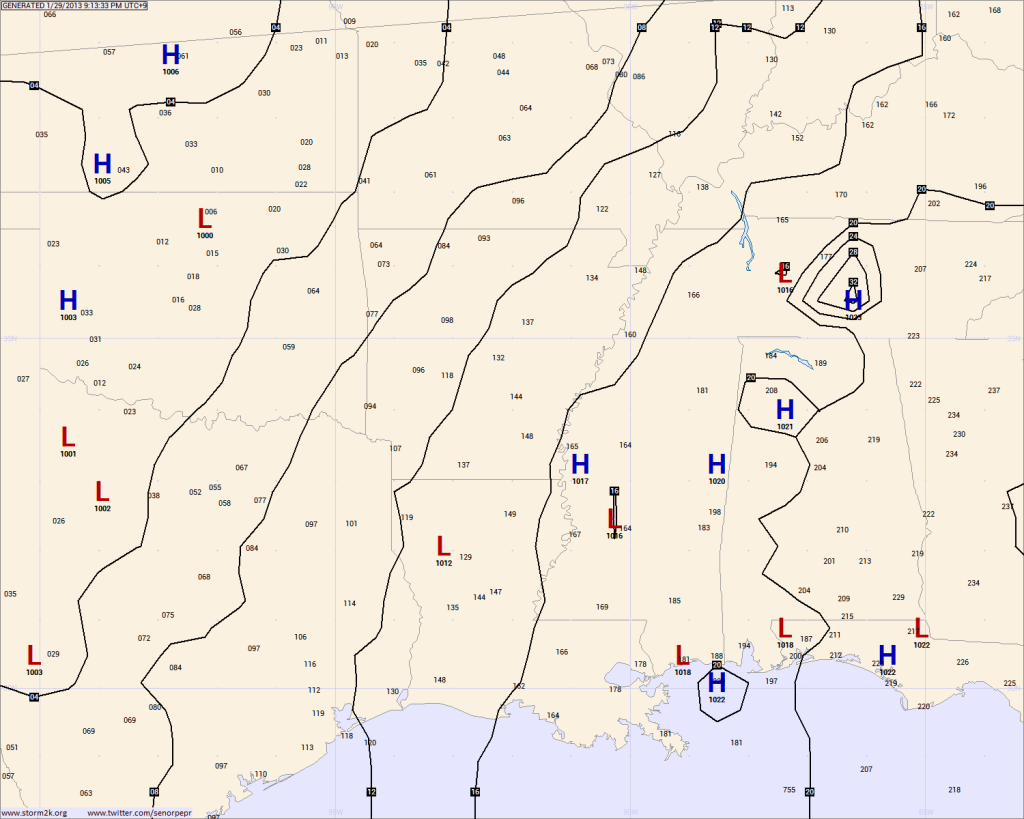
Sea Level Pressure Tendency
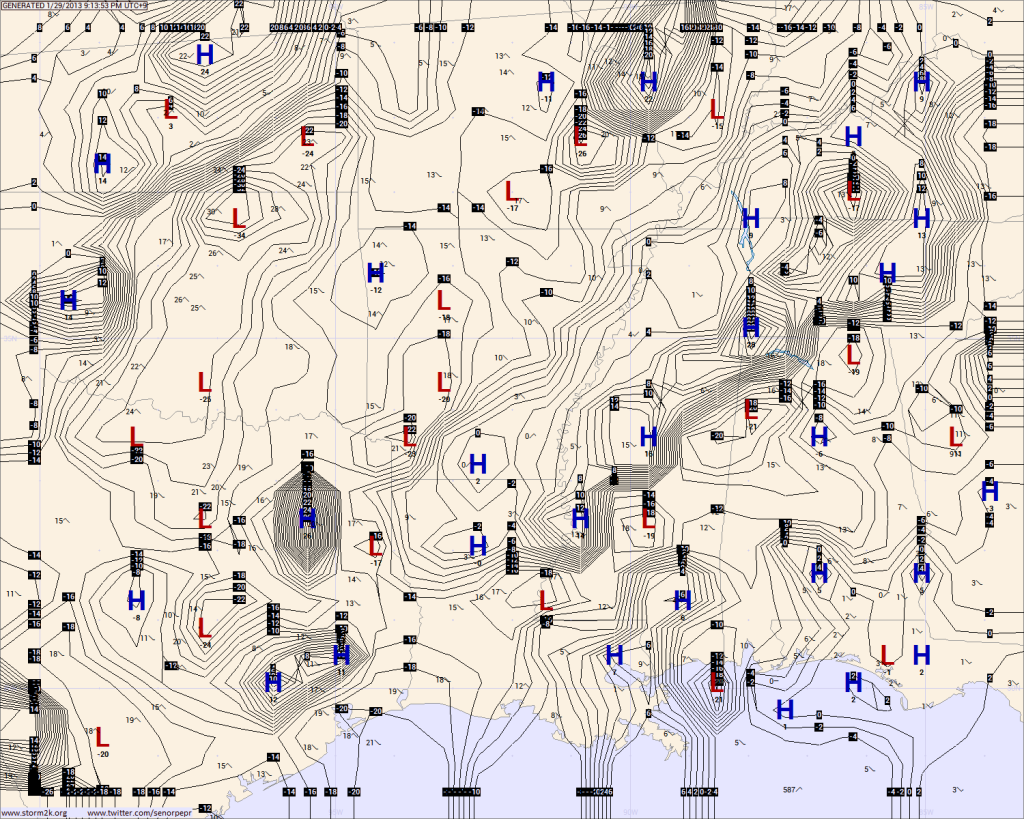
Displayed are isallobars (every 2 hPa, in black) and sea level pressure change (in tenths of a hectoPascal).
Surface Wind Vectors
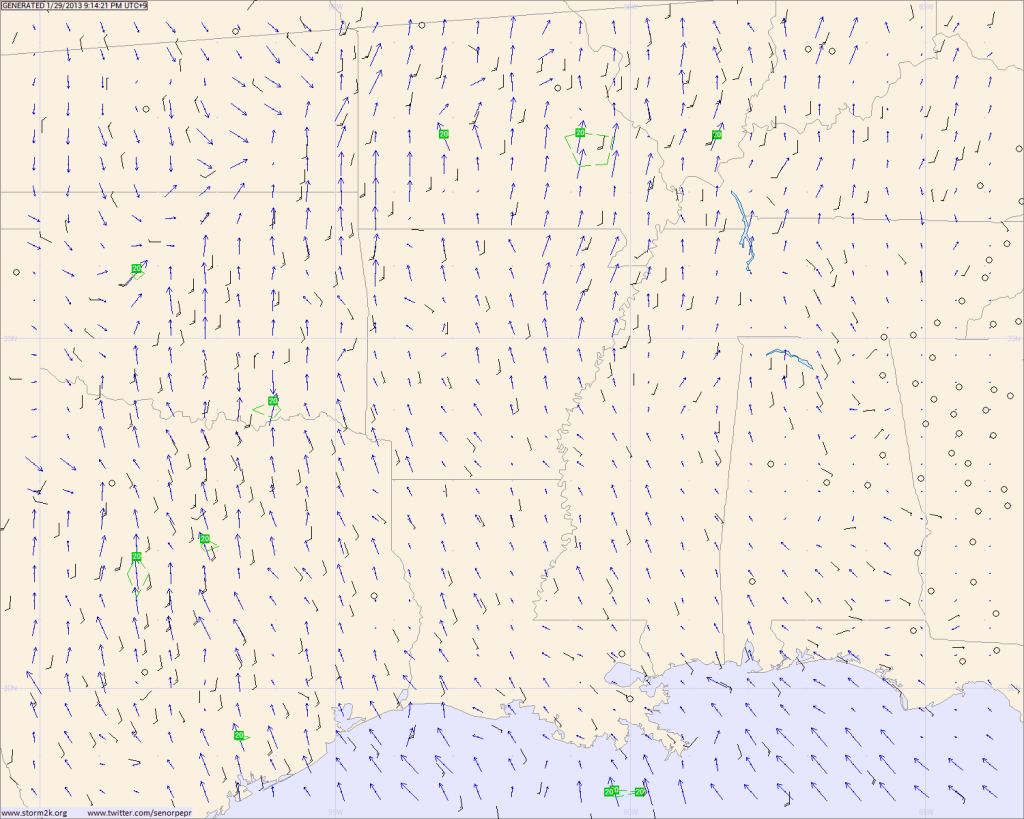
Displayed are isotachs (every 5 kt above 20 kt, in green), wind vectors (direction wind moving toward, line length based on speed), and surface wind plots. (in knots)
Surface Aviation Flight Rules
Displayed are surface aviation flight rules (see below), surface visibility (in miles), and surface weather.
Red--Instrument Flight Rules (IFR) for visibility <3 miles, ceiling <1000 ft.
Blue--Marginal Visual Flight Rules (MVFR) for visibility <5 miles, ceiling <3000 ft.
Black--Visual Flight Rules (VFR) for visibility ≥5 miles, ceiling ≥3000 ft.
Base Reflectivity (0.5°)

Displayed is from KRAX - Raleigh/Durham, North Carolina
Base Velocity (0.5°)

Displayed is from KRAX - Raleigh/Durham, North Carolina
Spectrum Width

Displayed is from KRAX - Raleigh/Durham, North Carolina
Composite Reflectivity

Displayed is from KRAX - Raleigh/Durham, North Carolina
Vertically Integrated Liquid

Displayed is from KRAX - Raleigh/Durham, North Carolina
Storm Total Rainfall

Displayed is from KRAX - Raleigh/Durham, North Carolina
200 hPa Analysis
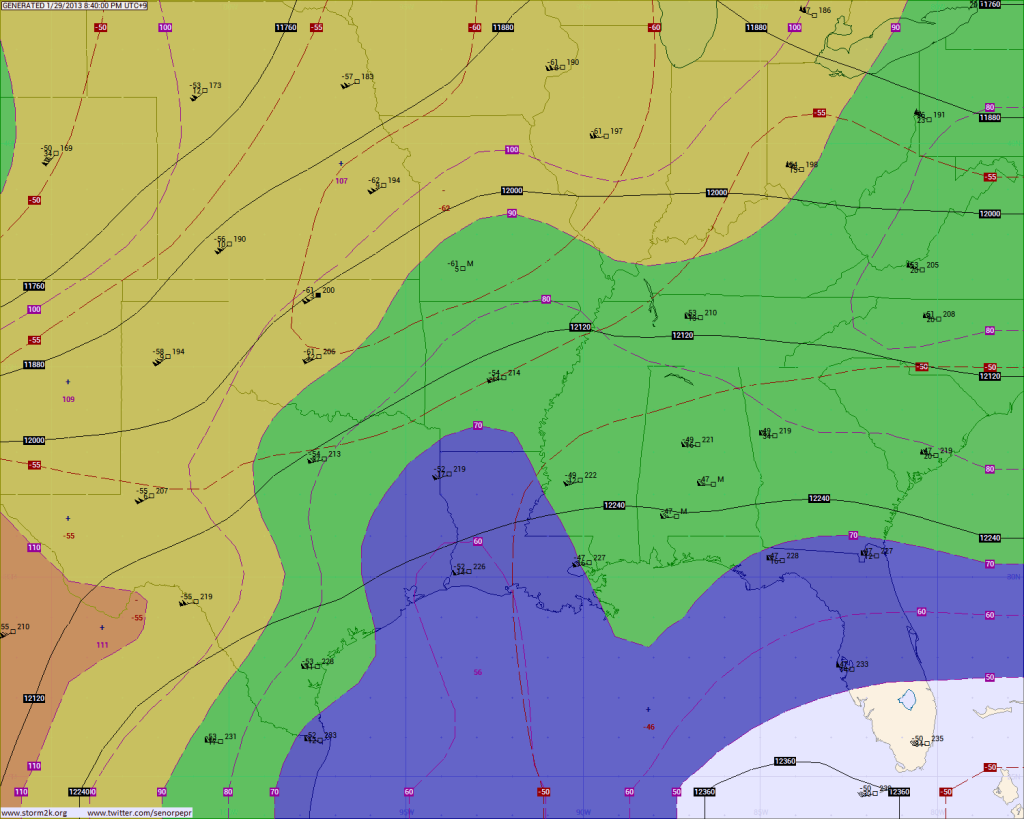
Displayed are isotachs (every 10 kt above 50 kt, in purple with shading), isotherms (every 5 °C, in red), isohypse (every 12 dam, in black), and radiosonde plots.
300 hPa Analysis
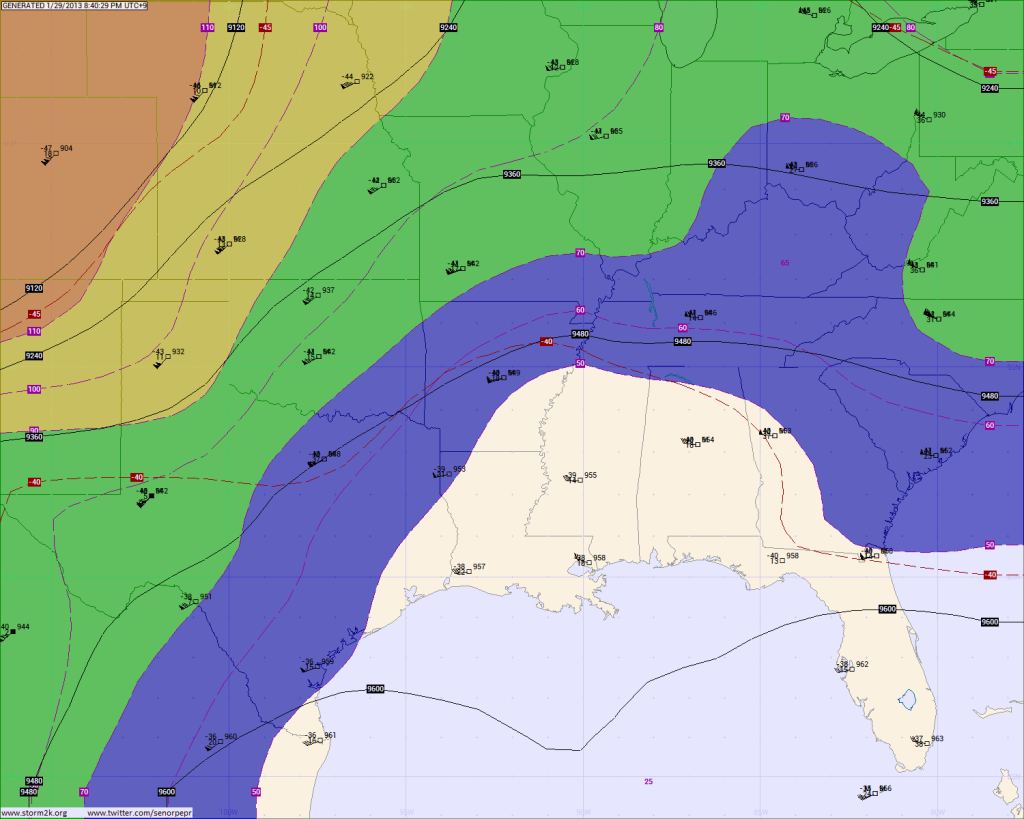
Displayed are isotachs (every 10 kt above 50 kt, in purple with shading), isotherms (every 5 °C, in red), isohypse (every 12 dam, in black), and radiosonde plots.
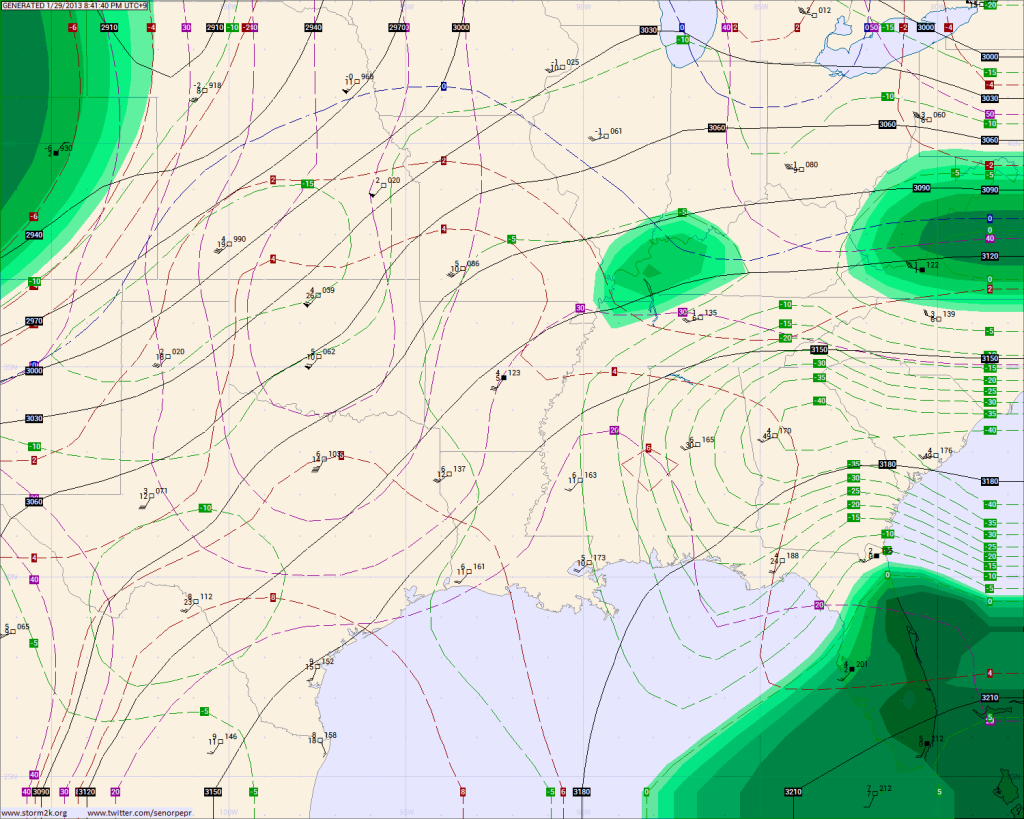
500 hPa Analysis
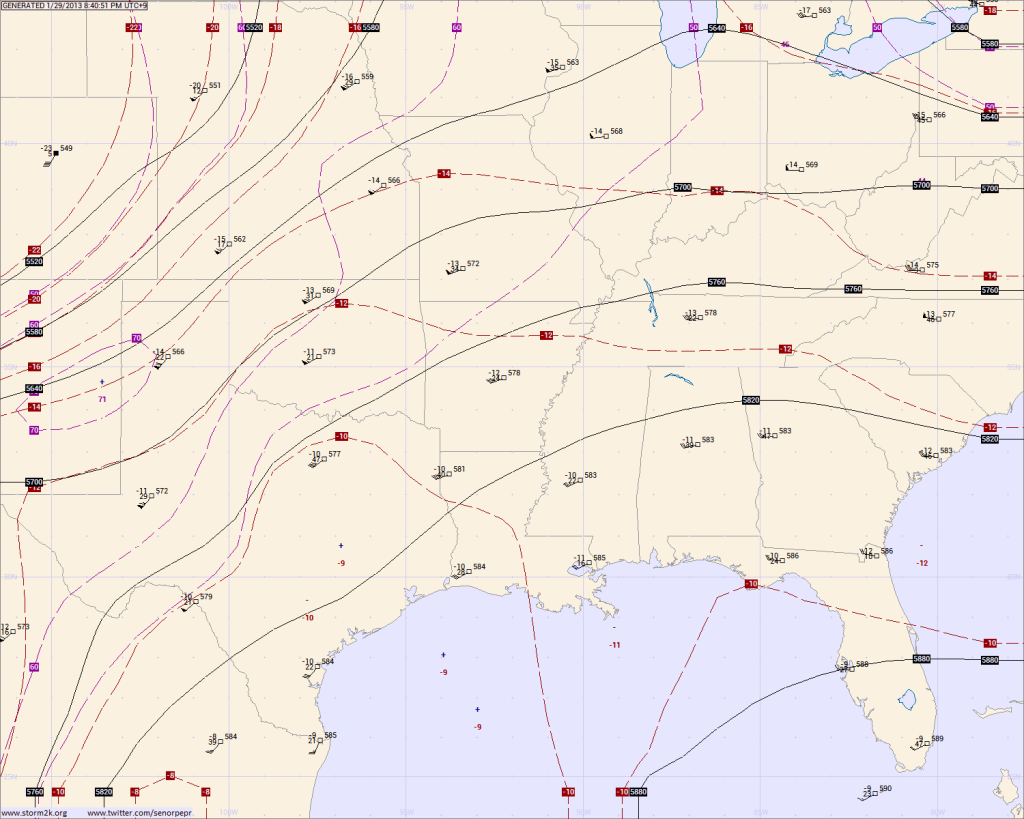
Displayed are isotachs (every 10 kt above 50 kt, in purple), isotherms (every 2 °C, in red), isohypse (every 6 dam, in black), and radiosonde plots.
500 hPa Vorticity Analysis
Displayed are isovorts (every 20^-5/s, in red), isohypse (every 6 dam, in black), and wind barb plots.
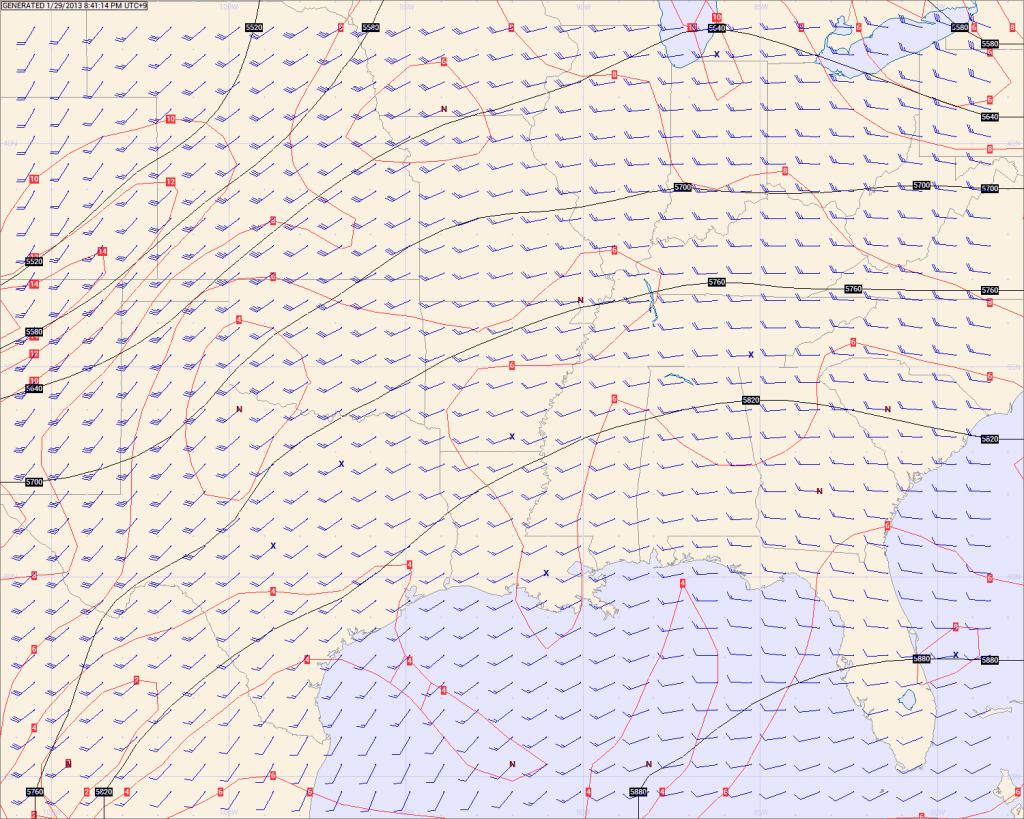
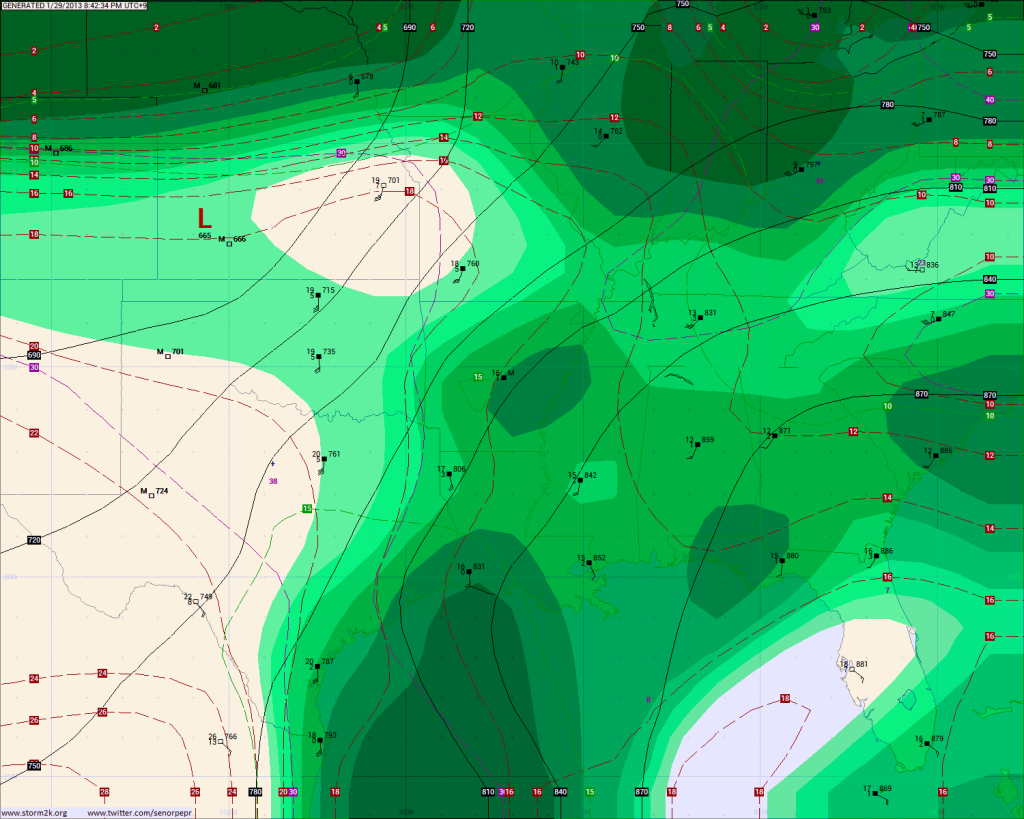
700 hPa Analysis
Displayed are isotachs (every 10 kt, in purple), isotherms (every 2 °C, in red), isodrosotherms (every 5 °C, in green with shading where dewpoint depression is less than 5 °C), isohypse (every 3 dam, in black), and radiosonde plots.
850 hPa Analysis
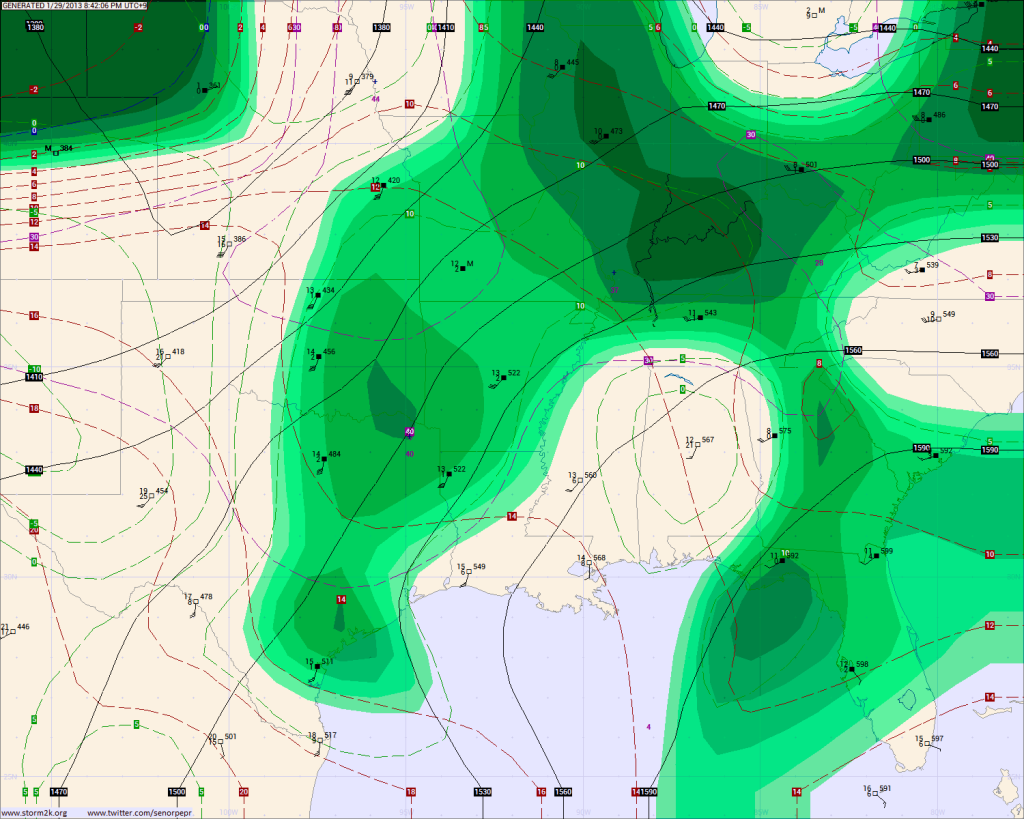
Displayed are isotachs (every 10 kt, in purple), isotherms (every 2 °C, in red), isodrosotherms (every 5 °C, in green with shading where dewpoint depression is less than 5 °C), isohypse (every 3 dam, in black), and radiosonde plots.
850hPa Theta-e Analysis
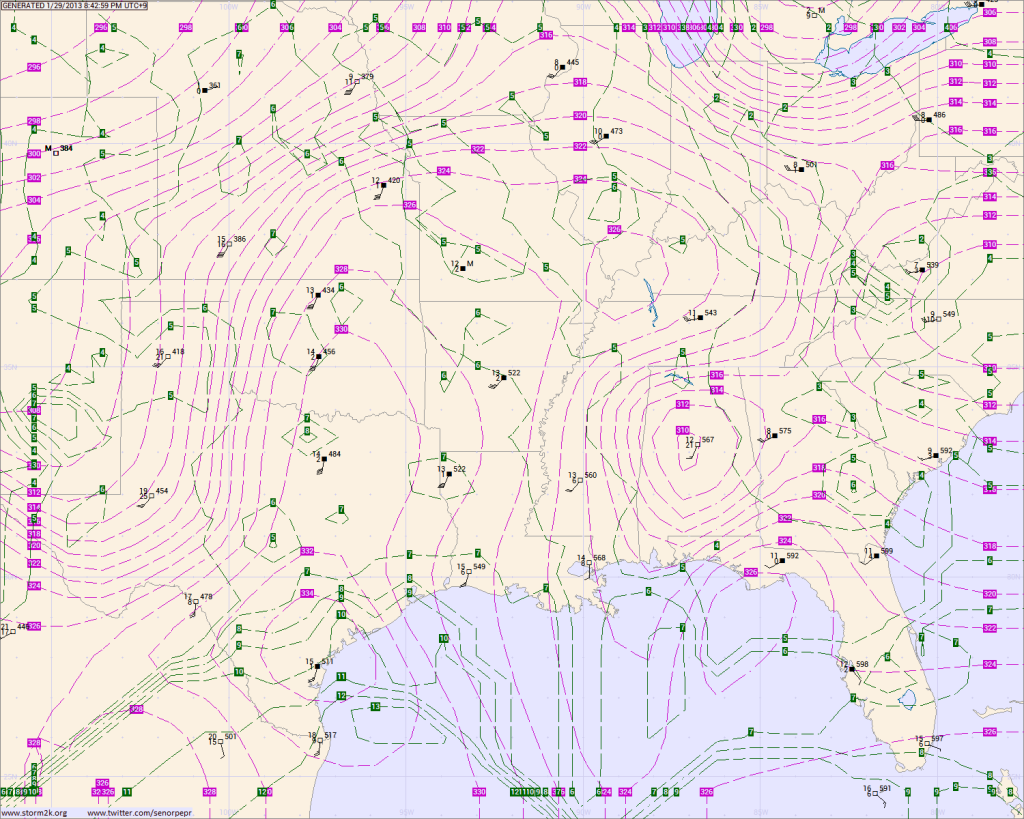
Displayed are pseudoadiabats (every 2 K, in purple), isohumes (every 1 g/kg in green), and radiosonde plots.
925 hPa Analysis
Displayed are isotach (every 10 kt, in purple), isotherms (every 2 °C, in red), isodrosotherms (every 5 °C, in green with shading where dewpoint depression is less than 5 °C), isohypse (every 3 dam, in black), and radiosonde plots.
1000-500 hPa Thickness Analysis
Displayed are isopachs (every 6 dam, in red) and isobars (every 4 hPa, in black).
----------
Key:
isobar - line of equal pressure
isotherm - line of equal temperature
isodrosotherm - line of equal dewpoint temperature
isallobar - line of equal pressure change
isotach - line of equal wind speed
isohypse - line of equal height
isovort - line of equal absolute vorticity
psuedoadiabat - line of equal equivalent potential temperature
isohume - line of equal mixing ratio
isopach - line of equal thickness