cycloneye wrote::uarrow: And moving slow,which helps with the consolidation.
yeah it really has only moved a 100 miles or so since yesterday morning. the models are actually quite quick kicking it out. does not seem to be doing to much of that yet..
Moderator: S2k Moderators

cycloneye wrote::uarrow: And moving slow,which helps with the consolidation.
NDG wrote:South of the Isle of Youth, formerly known as the Isle of Pines, is where you can tell that the vorticity is from looking at the Cuban radar loop.
http://www.met.inf.cu/asp/genesis.asp?TB0=PLANTILLAS&TB1=RADAR&TB2=../Radar/03Cienfuegos/psjMAXw01a.gif
ronjon wrote:NDG wrote:South of the Isle of Youth, formerly known as the Isle of Pines
http://www.met.inf.cu/asp/genesis.asp?TB0=PLANTILLAS&TB1=RADAR&TB2=../Radar/03Cienfuegos/psjMAXw01a.gif
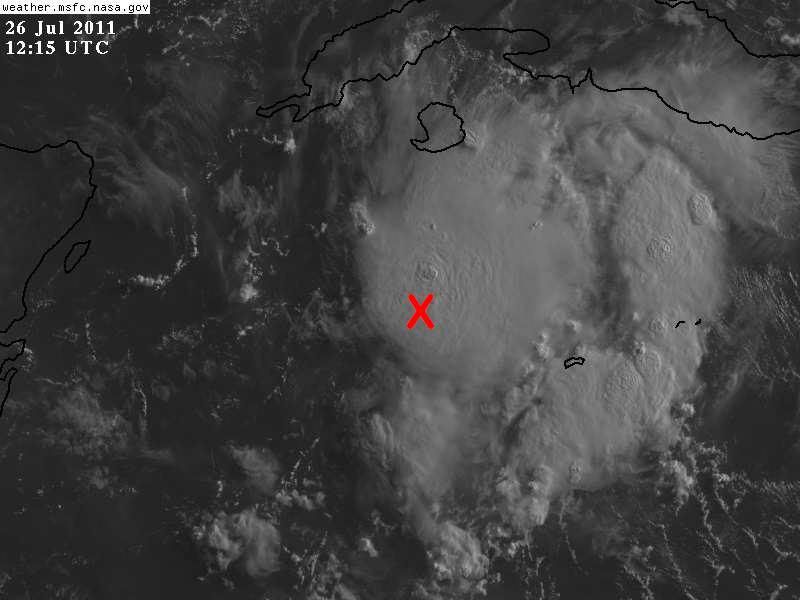
Based on that RAD image I'd place the low level vorticity near 21N-81W - east of the Isle of Youth - pretty close to where GFS forecasts it.


Code: Select all
WHXX01 KWBC 261242
CHGHUR
TROPICAL CYCLONE GUIDANCE MESSAGE
NWS NATIONAL HURRICANE CENTER MIAMI FL
1242 UTC TUE JUL 26 2011

DISCLAIMER...NUMERICAL MODELS ARE SUBJECT TO LARGE ERRORS.
PLEASE REFER TO NHC OFFICIAL FORECASTS FOR TROPICAL CYCLONE
AND SUBTROPICAL CYCLONE INFORMATION.

ATLANTIC OBJECTIVE AIDS FOR

DISTURBANCE INVEST (AL902011) 20110726 1200 UTC

        ...00 HRS...   ...12 HRS...   ...24 HRS. ..   ...36 HRS...
        110726  1200   110727  0000   110727  1200   110728  0000

         LAT    LON     LAT    LON     LAT    LON     LAT    LON
BAMS    20.0N  83.0W   20.5N  85.1W   21.1N  87.3W   21.9N  89.2W
BAMD    20.0N  83.0W   20.5N  84.6W   21.1N  86.3W   21.8N  88.2W
BAMM    20.0N  83.0W   20.5N  84.8W   21.0N  86.7W   21.7N  88.6W
LBAR    20.0N  83.0W   20.9N  85.2W   21.8N  87.6W   23.0N  90.0W
SHIP        25KTS          29KTS          33KTS          38KTS
DSHP        25KTS          29KTS          33KTS          34KTS

        ...48 HRS...   ...72 HRS...   ...96 HRS. ..   ..120 HRS...
        110728  1200   110729  1200   110730  1200   110731  1200

         LAT    LON     LAT    LON     LAT    LON     LAT    LON
BAMS    22.8N  91.5W   24.9N  96.2W   26.8N 100.7W   28.6N 105.2W
BAMD    22.5N  90.4W   24.0N  95.0W   25.3N  99.5W   26.2N 104.1W
BAMM    22.5N  90.7W   24.3N  95.5W   26.0N 100.3W   27.8N 105.0W
LBAR    24.2N  92.5W   27.4N  96.6W   30.6N  99.7W   33.5N 102.3W
SHIP        44KTS          58KTS          71KTS          78KTS
DSHP        39KTS          54KTS          35KTS          28KTS

         ...INITIAL CONDITIONS...
LATCUR =  20.0N LONCUR =  83.0W DIRCUR = 285DEG SPDCUR =  15KT
LATM12 =  19.2N LONM12 =  79.8W DIRM12 = 285DEG SPDM12 =  14KT
LATM24 =  18.6N LONM24 =  77.0W
WNDCUR =   25KT RMAXWD =   75NM WNDM12 =   25KT
CENPRS = 1010MB OUTPRS = 1011MB OUTRAD =  110NM SDEPTH =   M
RD34NE =    0NM RD34SE =    0NM RD34SW =    0NM RD34NW =   0NM
Aric Dunn wrote:ronjon wrote:NDG wrote:South of the Isle of Youth, formerly known as the Isle of Pines
http://www.met.inf.cu/asp/genesis.asp?TB0=PLANTILLAS&TB1=RADAR&TB2=../Radar/03Cienfuegos/psjMAXw01a.gif
Based on that RAD image I'd place the low level vorticity near 21N-81W - east of the Isle of Youth - pretty close to where GFS forecasts it.
the resolution on those radars is very low and you are still even with those radars looking at the mid levels so there is no way to tell whats going on at the low levels and especially not at the surface from the radar. the surface obs show no LLC yet

Code: Select all
                *   ATLANTIC SHIPS INTENSITY FORECAST       *
                    * GOES AVAILABLE,       OHC AVAILABLE       *
                    *      INVEST  AL902011  07/26/11  12 UTC   *

TIME (HR)          0     6    12    18    24    36    48    60    72    84    96   108   120
V (KT) NO LAND    25    26    29    31    33    38    44    53    58    65    71    75    78
V (KT) LAND       25    26    29    31    33    34    39    48    54    51    35    29    28
V (KT) LGE mod    25    26    27    28    29    30    34    41    49    50    34    29    27
Storm Type      TROP  TROP  TROP  TROP  TROP  TROP  TROP  TROP  TROP  TROP  TROP  TROP  TROP

SHEAR (KT)        17     7    12    16    10     7     6     3     2     3     5     8     4
SHEAR ADJ (KT)    -5    -5    -3    -2    -3    -1     0    -3     2    -4     0    -4     0
SHEAR DIR        288   268   224   252   304   188   334   167    22   303   348   317   347
SST (C)         29.7  29.7  29.5  29.1  28.5  27.9  28.2  29.0  28.5  27.7  28.4  29.1  29.6
POT. INT. (KT)   165   163   160   153   144   135   140   152   145   133   143   154   162
ADJ. POT. INT.   158   152   148   141   132   124   129   141   132   121   129   138   143
200 MB T (C)   -53.4 -52.9 -52.5 -52.6 -52.8 -52.0 -52.5 -52.0 -52.5 -52.0 -52.5 -52.1 -52.4
TH_E DEV (C)      11    12    12    11    11    12    12    14    12    15    12    14    11
700-500 MB RH     60    63    63    63    62    61    59    57    58    54    56    58    57
GFS VTEX (KT)      4     3     5     4     3     4     3     3     3     3     2  LOST  LOST
850 MB ENV VOR   -41   -32   -22   -26   -39   -19   -19   -11   -17   -16   -11   -26   -15
200 MB DIV         3    20    18    10     7     7     9    14    -9    10     4    -4    -4
700-850 TADV      -3    -3     0    -2    -5     0    -8     3   -11    -1    -6     0     5
LAND (KM)        235   175   144   120    20    27   171   392   222   -34  -296  -525  -429
LAT (DEG N)     20.0  20.3  20.5  20.8  21.0  21.7  22.5  23.4  24.3  25.3  26.0  26.9  27.8
LONG(DEG W)     83.0  83.9  84.8  85.8  86.7  88.6  90.7  93.1  95.5  97.8 100.3 102.7 105.0
STM SPEED (KT)    12     9     9     9     9    10    11    12    12    12    11    12    11
HEAT CONTENT     102   106    98    76    33     0    16    42    44    17  9999  9999  9999

  FORECAST TRACK FROM BAMM      INITIAL HEADING/SPEED (DEG/KT):285/ 15      CX,CY: -13/  4
  T-12 MAX WIND:  25            PRESSURE OF STEERING LEVEL (MB):  798  (MEAN=623)
  GOES IR BRIGHTNESS TEMP. STD DEV.  50-200 KM RAD:  25.6 (MEAN=14.5)
  % GOES IR PIXELS WITH T < -20 C    50-200 KM RAD:  59.0 (MEAN=65.0)

                        INDIVIDUAL CONTRIBUTIONS TO INTENSITY CHANGE
                         6   12   18   24   36   48   60   72   84   96  108  120
                        ----------------------------------------------------------
  SAMPLE MEAN CHANGE     1.   2.   3.   4.   6.   8.   9.  11.  12.  12.  13.  13.
  SST POTENTIAL          0.  -1.   0.   1.   6.  12.  18.  23.  27.  30.  32.  34.
  VERTICAL SHEAR MAG     1.   3.   4.   5.   7.   9.  10.  11.  12.  13.  14.  14.
  VERTICAL SHEAR ADJ     0.   1.   1.   1.   2.   2.   3.   3.   3.   3.   2.   2.
  VERTICAL SHEAR DIR     0.  -1.  -1.  -1.  -2.  -2.  -2.  -2.  -2.  -2.  -2.  -2.
  PERSISTENCE            0.  -1.  -1.  -1.  -1.  -1.  -1.  -1.  -1.   0.   0.   0.
  200/250 MB TEMP.       0.   0.   0.  -1.  -1.  -2.  -2.  -2.  -3.  -3.  -3.  -4.
  THETA_E EXCESS         0.   0.   0.   1.   1.   1.   2.   3.   4.   5.   6.   6.
  700-500 MB RH          0.   0.   0.   0.  -1.  -1.  -1.  -1.  -1.  -1.  -1.  -1.
  GFS VORTEX TENDENCY    0.   0.   0.  -1.   0.  -2.  -2.  -2.  -2.  -3.  -3.  -4.
  850 MB ENV VORTICITY   0.  -1.  -1.  -1.  -2.  -3.  -3.  -4.  -4.  -5.  -5.  -5.
  200 MB DIVERGENCE      0.   0.   0.  -1.  -1.  -1.  -1.  -2.  -2.  -2.  -2.  -2.
  850-700 T ADVEC        0.   0.   0.   0.   0.   0.   0.   0.   0.   0.   1.   1.
  ZONAL STORM MOTION     0.   0.   1.   1.   2.   2.   3.   3.   3.   4.   4.   4.
  STEERING LEVEL PRES    0.   0.  -1.  -1.  -2.  -2.  -2.  -3.  -4.  -3.  -3.  -2.
  DAYS FROM CLIM. PEAK   0.   0.   0.   0.   0.  -1.  -1.  -1.  -1.  -1.  -1.  -1.
  GOES PREDICTORS        0.   0.   0.   0.  -1.  -1.  -1.  -1.  -2.  -2.  -1.  -1.
  OCEAN HEAT CONTENT     1.   1.   2.   1.   0.   0.   0.   0.   0.   0.   0.   0.
                        ----------------------------------------------------------
  TOTAL CHANGE           1.   4.   6.   8.  13.  19.  28.  34.  40.  46.  50.  53.

   ** 2011 ATLANTIC RI INDEX AL902011     INVEST 07/26/11  12 UTC **

 12 HR PERSISTENCE (KT):   0.0 Range:-45.0 to  30.0 Scaled/Wgted Val:  0.6/  2.0
 850-200 MB SHEAR (KT) :  12.5 Range: 26.2 to   3.2 Scaled/Wgted Val:  0.6/  1.1
 STD DEV OF IR BR TEMP :  25.6 Range: 34.1 to   3.2 Scaled/Wgted Val:  0.3/  0.6
 D200 (10**7s-1)       :  11.6 Range:-21.0 to 165.0 Scaled/Wgted Val:  0.2/  0.4
 POT = MPI-VMAX (KT)   : 121.2 Range: 33.8 to 126.5 Scaled/Wgted Val:  0.9/  1.0
 850-700 MB REL HUM (%):  65.6 Range: 56.0 to  85.0 Scaled/Wgted Val:  0.3/  0.2
 Heat content (KJ/cm2) :  83.0 Range:  0.0 to 130.0 Scaled/Wgted Val:  0.6/  0.0
 % area w/pixels <-30 C:  55.0 Range: 17.0 to 100.0 Scaled/Wgted Val:  0.5/  0.2

 Prob of RI for 25 kt RI threshold=    20% is   1.6 times the sample mean(12.8%)
 Prob of RI for 30 kt RI threshold=    12% is   1.4 times the sample mean( 8.4%)
 Prob of RI for 35 kt RI threshold=     8% is   1.6 times the sample mean( 5.0%)
 Prob of RI for 40 kt RI threshold=     4% is   1.3 times the sample mean( 3.4%)

   ##         ANNULAR HURRICANE INDEX (AHI) AL902011     INVEST 07/26/11  12 UTC         ##
   ## STORM NOT ANNULAR, SCREENING STEP FAILED, NPASS=2 NFAIL=5                          ##
   ## AHI=  0   (AHI OF 100 IS BEST FIT TO ANN. STRUC., 1 IS MARGINAL, 0 IS NOT ANNULAR) ##

** PROBLTY OF AT LEAST 1 SCNDRY EYEWL FORMTN EVENT AL902011     INVEST 07/26/2011  12 UTC **
TIME(HR)   0-12  12-24(0-24)  24-36(0-36)  36-48(0-48)
CLIMO(%)     0      0(  0)       0(  0)       0(  0)     <-- PROB BASED ON INTENSITY ONLY
PROB(%)      0      0(  0)       0(  0)       0(  0)     <-- FULL MODEL PROB (RAN NORMALLY)
Code: Select all
SHEAR (KT) 17 7 12 16 10 7 6 3 2 3 5 8 4
GCANE wrote:Convection is attempting to fire near the center.
http://rammb.cira.colostate.edu/product ... 260515.jpg
IMHO, what is currently holding this back was a flare over the Yucatan that created a short term UL jet to the SW of the 90L's center.
http://www.ssd.noaa.gov/goes/east/watl/flash-wv.html
The direction of the jet is in opposition for good ventilation.
http://tropic.ssec.wisc.edu/real-time/a ... g8wvir.GIF
The flare has washed itself out and the jet should dissipate soon.
After that, we could see 90L begin to ramp up.
Users browsing this forum: No registered users and 3 guests


