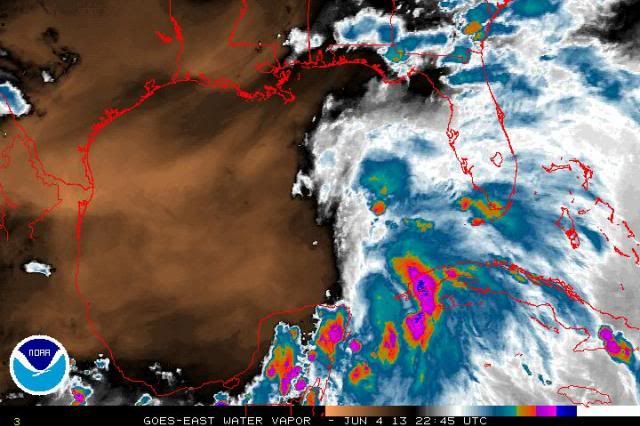
For those of you who are looking at the NOAA GOES EAST water vapor satellite to see where the dry air is, please look at this. The dry air appears widespread over most of the western 2/3rds of the GOM on that satellite image but that satellite detects the
highest layer of dry air so that if there is dry air at 30,000 feet overlaying moist air below it, it will NOT show the mid-level water vapor. And since it is only mid-level dry air that has a deleterious effect on tropical cyclones, this satellite image is often useless in getting the proper perspective.
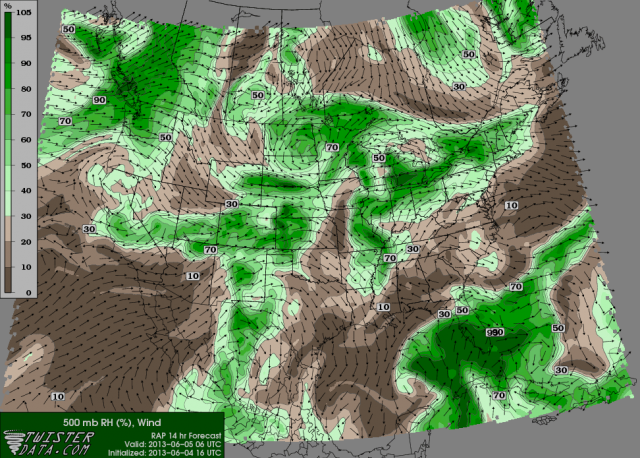
Now look at these 2 RUC current and forecast images for 12Z tomorrow morning for RH at 500mb, where it really counts. The entire eastern side of the Gulf is quite moist and forecast to remain so. So you need to use these images, not that water vapor satellite image if you are trying to determine how much dry air will be involved.
RUC 500mb Relative Humidity current

RUC 500mb Relative Humidity forecast for 12Z tomorrow


