WPAC: KILO - Post-Tropical
Moderator: S2k Moderators
-
hawaiigirl

- Tropical Depression

- Posts: 51
- Age: 41
- Joined: Thu Aug 06, 2009 6:38 pm
-
cane2cane
Re: CPAC: KILO - Tropical Depression
Check the date. Wasnt that before Kilo even became an official TC? I thought forecasts on INVESTs were useless. I read that very statement on here by a prof met.
Yellow Evan wrote:Kingarabian wrote:
No it did not. You're not reading the outputs right. It had this becoming a hurricane and sometimes a strong Cat.2 numerous times.
This was the output from five days ago for instance.Yellow Evan wrote:Low moderate shear here. Nothing to stop a formidable tropical cyclone though.Code: Select all
                    * EAST PACIFIC SHIPS INTENSITY FORECAST          *
                    * IR SAT DATA AVAILABLE,       OHC AVAILABLE     *
                    *  INVEST      CP932015  08/18/15  00 UTC        *

TIME (HR)          0     6    12    18    24    36    48    60    72    84    96   108   120
V (KT) NO LAND    20    22    25    28    30    35    40    49    55    60    62    65    66
V (KT) LAND       20    22    25    28    30    35    40    49    55    60    62    65    66
V (KT) LGE mod    20    21    22    23    24    26    28    31    35    40    46    53    61
Storm Type      TROP  TROP  TROP  TROP  TROP  TROP  TROP  TROP  TROP  TROP  TROP  TROP  TROP

SHEAR (KT)         6     8    13    13     9    10     6    14    18    12    11     8     9
SHEAR ADJ (KT)     9    10     7     4     5     2     3     0    -1    -1    -2    -7    -5
SHEAR DIR         43    30    40    39    28     6    21    87    89    69    77    94    87
SST (C)         29.7  29.7  29.6  29.6  29.6  29.5  29.4  29.4  29.4  29.3  29.0  28.5  28.1
POT. INT. (KT)   160   160   159   159   159   158   158   159   159   159   156   150   146
200 MB T (C)   -51.4 -51.9 -52.3 -52.2 -51.6 -52.2 -51.7 -52.5 -51.7 -52.6 -51.8 -52.2 -52.0
TH_E DEV (C)       7     8     8     8     8     8     7     7     7     8     8     8     9
700-500 MB RH     66    67    67    67    69    72    73    72    70    68    64    63    62
MODEL VTX (KT)     7     8     8     8     8     8     7  LOST  LOST  LOST  LOST  LOST  LOST
850 MB ENV VOR    38    35    33    33    42    48    49    59    75    78    58    47    23
200 MB DIV       159   143   114    96    78    52    95   109   117    72    61    47    52
700-850 TADV       2     2     3     3     4     2     0    -3    -2    -4     0     2     0
LAND (KM)       1830  1779  1729  1675  1621  1520  1383  1213  1018   824   639   546   511
LAT (DEG N)      7.5   7.8   8.0   8.3   8.6   9.2   9.9  10.7  11.5  12.2  13.2  14.2  15.5
LONG(DEG W)    143.2 143.6 144.0 144.4 144.8 145.5 146.6 148.1 150.0 152.3 154.8 157.1 158.9
STM SPEED (KT)     5     5     5     5     5     5     7     9    11    12    13    11    11
HEAT CONTENT      42    38    35    32    27    19    15    24    36    30    18    30    32

  FORECAST TRACK FROM BAMM      INITIAL HEADING/SPEED (DEG/KT):270/  5      CX,CY:  -4/  0
  T-12 MAX WIND:  20            PRESSURE OF STEERING LEVEL (MB):  499  (MEAN=581)
  GOES IR BRIGHTNESS TEMP. STD DEV.  50-200 KM RAD:  14.4 (MEAN=14.5)
  % GOES IR PIXELS WITH T < -20 C    50-200 KM RAD:  83.0 (MEAN=65.0)

                        INDIVIDUAL CONTRIBUTIONS TO INTENSITY CHANGE
                         6   12   18   24   36   48   60   72   84   96  108  120
                        ----------------------------------------------------------
  SAMPLE MEAN CHANGE     0.   0.   0.   1.   1.   1.   0.   0.  -1.  -1.  -2.  -2.
  SST POTENTIAL          0.  -1.   0.   1.   7.  15.  24.  31.  36.  39.  41.  42.
  VERTICAL SHEAR MAG     1.   2.   2.   3.   4.   5.   5.   4.   4.   5.   6.   7.
  VERTICAL SHEAR ADJ    -1.  -1.  -2.  -2.  -3.  -3.  -2.  -2.  -1.  -1.  -1.   0.
  VERTICAL SHEAR DIR     1.   1.   2.   3.   4.   6.   9.  11.  13.  14.  14.  14.
  PERSISTENCE            0.   0.   0.  -1.  -1.  -1.  -1.  -1.  -1.  -1.   0.   0.
  200/250 MB TEMP.       0.  -1.  -2.  -3.  -6.  -8. -11. -13. -14. -15. -15. -14.
  THETA_E EXCESS         0.   0.   0.   0.  -1.  -1.  -1.  -2.  -2.  -2.  -2.  -2.
  700-500 MB RH          0.   0.   0.   1.   1.   2.   2.   3.   3.   4.   4.   4.
  MODEL VTX TENDENCY     0.   0.   1.   1.   1.  -1.  -1.  -1.  -1.   0.   0.   0.
  850 MB ENV VORTICITY   0.   0.   0.   0.   0.   1.   1.   2.   2.   3.   4.   4.
  200 MB DIVERGENCE      1.   2.   2.   3.   3.   3.   3.   2.   1.   0.  -2.  -3.
  850-700 T ADVEC        0.   0.   0.   0.   0.   0.   0.   0.   0.   0.   0.   0.
  ZONAL STORM MOTION     0.   0.   0.  -1.  -1.  -2.  -2.  -2.  -2.  -2.  -2.  -2.
  STEERING LEVEL PRES    0.   0.   0.   0.   0.  -1.  -1.  -1.  -1.  -1.  -1.  -1.
  DAYS FROM CLIM. PEAK   0.   0.   0.   0.   0.   0.   0.   1.   1.   1.   1.   1.
  GOES PREDICTORS        1.   2.   3.   4.   4.   3.   2.   1.   0.  -1.  -2.  -1.
  OCEAN HEAT CONTENT     0.   1.   1.   1.   1.   1.   1.   1.   1.   1.   1.   1.
                        ----------------------------------------------------------
  TOTAL CHANGE           2.   5.   8.  10.  15.  20.  29.  35.  40.  42.  45.  46.

   ** 2013 E. Pacific RI INDEX CP932015 INVEST     08/18/15  00 UTC **
           ( 30 KT OR MORE MAX WIND INCREASE IN NEXT 24 HR)

 12 HR PERSISTENCE (KT):   0.0 Range:-22.0 to  38.5 Scaled/Wgted Val:  0.4/  0.8
 850-200 MB SHEAR (KT) :   9.7 Range: 18.7 to   1.4 Scaled/Wgted Val:  0.5/  0.7
 POT = MPI-VMAX (KT)   : 139.0 Range: 40.3 to 141.7 Scaled/Wgted Val:  1.0/  1.0
 STD DEV OF IR BR TEMP :  14.4 Range: 38.9 to   2.4 Scaled/Wgted Val:  0.7/  0.7
 Heat content (KJ/cm2) :  34.8 Range:  3.6 to  75.9 Scaled/Wgted Val:  0.4/  0.4
 D200 (10**7s-1)       : 118.0 Range:-11.0 to 135.3 Scaled/Wgted Val:  0.9/  0.6
 % area w/pixels <-30 C:  75.0 Range: 41.4 to 100.0 Scaled/Wgted Val:  0.6/  0.3
 850-700 MB REL HUM (%):  73.8 Range: 57.6 to  96.8 Scaled/Wgted Val:  0.4/ -0.1

 Prob of RI for 25 kt RI threshold=    51% is   3.9 times the sample mean(13.1%)
 Prob of RI for 30 kt RI threshold=    31% is   3.6 times the sample mean( 8.7%)
 Prob of RI for 35 kt RI threshold=    22% is   3.7 times the sample mean( 6.0%)
 Prob of RI for 40 kt RI threshold=    17% is   4.0 times the sample mean( 4.3%)
0 likes
-
Yellow Evan

- Professional-Met

- Posts: 16232
- Age: 27
- Joined: Fri Jul 15, 2011 12:48 pm
- Location: Henderson, Nevada/Honolulu, HI
- Contact:
Re: CPAC: KILO - Tropical Depression
cane2cane wrote:Check the date. Wasnt that before Kilo even became an official TC? I thought forecasts on INVESTs were useless. I read that very statement on here by a prof met.
Sometimes they are.
My point still stands. This is the output from 36 hours ago.
Code: Select all
                    * EAST PACIFIC SHIPS INTENSITY FORECAST          *
                    * IR SAT DATA AVAILABLE,       OHC AVAILABLE     *
                    *  THREE       CP032015  08/20/15  18 UTC        *

TIME (HR)          0     6    12    18    24    36    48    60    72    84    96   108   120
V (KT) NO LAND    30    35    41    47    53    63    74    81    84    84    86    84    83
V (KT) LAND       30    35    41    47    53    63    74    81    84    84    86    84    83
V (KT) LGE mod    30    34    38    43    48    60    74    85    91    91    87    83    77
Storm Type      TROP  TROP  TROP  TROP  TROP  TROP  TROP  TROP  TROP  TROP  TROP  TROP  TROP

SHEAR (KT)        19    19    15    13    12     8    10     3     6     3    15    18    29
SHEAR ADJ (KT)     1     1     0    -1    -4    -4    -5     2     4     8     0     0     0
SHEAR DIR         54    67    77    56    44    25     7    19   334   257   271   256   259
SST (C)         29.5  29.5  29.5  29.4  29.3  29.1  28.6  28.2  28.2  28.2  28.0  27.5  27.1
POT. INT. (KT)   161   160   160   160   159   157   151   146   146   145   143   138   134
200 MB T (C)   -52.8 -52.4 -52.3 -52.7 -52.8 -51.9 -52.3 -51.7 -52.2 -51.9 -52.5 -52.1 -52.3
TH_E DEV (C)       7     7     7     7     7     8     8     9     8     8     7     7     6
700-500 MB RH     65    68    70    70    68    68    67    70    72    74    73    71    69
MODEL VTX (KT)    14    15    17    18    18    17    18    19    21    22    24    24    26
850 MB ENV VOR    91    97   102   102   103    85    59    39    13    26    29    50    47
200 MB DIV        83    77    68    61    42    36    41    82    70    85    65    53    36
700-850 TADV      -4    -2    -3    -5    -4    -1     2     6     9    10    10    13    12
LAND (KM)       1113  1036   967   889   826   730   671   621   545   380   202    32   100
LAT (DEG N)     10.8  11.0  11.1  11.4  11.6  12.4  13.7  15.3  17.0  18.5  19.8  21.2  22.6
LONG(DEG W)    149.5 150.5 151.6 152.8 154.1 156.6 158.8 160.2 160.7 160.3 159.3 158.5 158.0
STM SPEED (KT)    12    10    11    12    13    13    11    10     8     8     8     8     8
HEAT CONTENT      26    27    27    28    31    36    53    42    41    38    26    14    18

  FORECAST TRACK FROM BAMM      INITIAL HEADING/SPEED (DEG/KT):280/ 14      CX,CY: -13/  2
  T-12 MAX WIND:  25            PRESSURE OF STEERING LEVEL (MB):  423  (MEAN=581)
  GOES IR BRIGHTNESS TEMP. STD DEV.  50-200 KM RAD:   4.9 (MEAN=14.5)
  % GOES IR PIXELS WITH T < -20 C    50-200 KM RAD: 100.0 (MEAN=65.0)

                        INDIVIDUAL CONTRIBUTIONS TO INTENSITY CHANGE
                         6   12   18   24   36   48   60   72   84   96  108  120
                        ----------------------------------------------------------
  SAMPLE MEAN CHANGE     0.   0.   0.   1.   1.   1.   0.   0.  -1.  -1.  -2.  -2.
  SST POTENTIAL          0.   0.   1.   3.   8.  14.  21.  26.  28.  30.  31.  31.
  VERTICAL SHEAR MAG     0.   1.   1.   1.   1.   2.   3.   4.   5.   5.   4.   2.
  VERTICAL SHEAR ADJ     0.   0.   0.   0.   1.   2.   1.   1.   0.   0.   0.   0.
  VERTICAL SHEAR DIR     1.   2.   3.   5.   7.   8.   9.   8.   7.   6.   5.   5.
  PERSISTENCE            1.   1.   2.   2.   2.   2.   2.   1.   1.   1.   1.   0.
  200/250 MB TEMP.       0.  -1.  -2.  -2.  -5.  -6.  -8. -10. -11. -11. -11. -11.
  THETA_E EXCESS         0.   0.   0.  -1.  -1.  -1.  -1.  -1.  -1.  -2.  -2.  -2.
  700-500 MB RH          0.   0.   1.   1.   1.   2.   2.   3.   3.   4.   4.   4.
  MODEL VTX TENDENCY     0.   2.   3.   4.   4.   6.   8.  10.  11.  15.  15.  17.
  850 MB ENV VORTICITY   0.   0.   0.   1.   2.   2.   3.   3.   3.   4.   4.   4.
  200 MB DIVERGENCE      0.   1.   1.   1.   1.   1.   1.   1.   1.   0.  -1.  -2.
  850-700 T ADVEC        0.   0.   0.   0.   0.   0.   0.   0.   0.   0.   1.   2.
  ZONAL STORM MOTION     0.   1.   1.   2.   3.   4.   4.   4.   4.   3.   3.   3.
  STEERING LEVEL PRES    0.   0.   0.   0.  -1.  -1.  -2.  -3.  -3.  -3.  -3.  -3.
  DAYS FROM CLIM. PEAK   0.   0.   0.   0.   0.   0.   0.   1.   1.   2.   2.   2.
  GOES PREDICTORS        2.   4.   5.   6.   7.   6.   6.   4.   3.   1.   1.   1.
  OCEAN HEAT CONTENT     0.   0.   0.   1.   1.   2.   2.   2.   2.   2.   2.   1.
                        ----------------------------------------------------------
  TOTAL CHANGE           5.  11.  17.  23.  33.  44.  51.  54.  54.  56.  54.  53.

   ** 2013 E. Pacific RI INDEX CP032015 THREE      08/20/15  18 UTC **
           ( 30 KT OR MORE MAX WIND INCREASE IN NEXT 24 HR)

 12 HR PERSISTENCE (KT):   5.0 Range:-22.0 to  38.5 Scaled/Wgted Val:  0.4/  1.0
 850-200 MB SHEAR (KT) :  15.7 Range: 18.7 to   1.4 Scaled/Wgted Val:  0.2/  0.3
 POT = MPI-VMAX (KT)   : 130.0 Range: 40.3 to 141.7 Scaled/Wgted Val:  0.9/  0.9
 STD DEV OF IR BR TEMP :   4.9 Range: 38.9 to   2.4 Scaled/Wgted Val:  0.9/  1.0
 Heat content (KJ/cm2) :  27.8 Range:  3.6 to  75.9 Scaled/Wgted Val:  0.3/  0.3
 D200 (10**7s-1)       :  66.2 Range:-11.0 to 135.3 Scaled/Wgted Val:  0.5/  0.4
 % area w/pixels <-30 C:  99.0 Range: 41.4 to 100.0 Scaled/Wgted Val:  1.0/  0.5
 850-700 MB REL HUM (%):  73.0 Range: 57.6 to  96.8 Scaled/Wgted Val:  0.4/ -0.1

 Prob of RI for 25 kt RI threshold=    47% is   3.6 times the sample mean(13.1%)
 Prob of RI for 30 kt RI threshold=    28% is   3.2 times the sample mean( 8.7%)
 Prob of RI for 35 kt RI threshold=    21% is   3.4 times the sample mean( 6.0%)
 Prob of RI for 40 kt RI threshold=    15% is   3.6 times the sample mean( 4.3%)
0 likes
-
Kingarabian

- S2K Supporter

- Posts: 16350
- Joined: Sat Aug 08, 2009 3:06 am
- Location: Honolulu, Hawaii
Re: CPAC: KILO - Tropical Depression
cane2cane wrote:Chill. It's because SHIPS has been off since Kilo's inception.
Really? How? I'm pretty sure SHIPS kept it at low TD/low TS strength to this point.
[/quote]
No it did not. You're not reading the outputs right. It had this becoming a hurricane and sometimes a strong Cat.2 numerous times.[/quote]
Yeah, in about 3 days from now. I highly doubt SHIPS had this as a Cat 2 by tonight.
So SHIPS has changed its forecast for next week now to a weaker cyclone. So what? Why does it make this useless? Every model changes its tune from run to run. Why is SHIPS useless and all of a sudden the HWRF is the best model to follow for this particular storm? Because it's the most threatening to Hawaii? What happens when HWRF makes this go even WEST of the EC? Then does the GFDL become the next model to pin your hopes on???[/quote]
Both models are used differently. Forecasters take account for every single reliable model out there.
The SHIPS helps paint the picture for a storm. It shows possible shear values, OHC, SST values, amount of dry air and more. It's used differently and looked at differently. The HWRF/GFDL are used to show the possible intensity of a storm and their track more than the SHIPS. So far they've been consistent track wise. That's what is important here. The track.
So far the HWRF/GFDL models have been much more consistent in their output compared to the SHIPS, Euro, GFS, and other models.
Last edited by Kingarabian on Sat Aug 22, 2015 2:40 am, edited 1 time in total.
0 likes
RIP Kobe Bryant
-
cane2cane
Re: CPAC: THREE-C - Tropical Depression
Yellow Evan wrote:Very interesting outputCode: Select all
                    * EAST PACIFIC SHIPS INTENSITY FORECAST          *
                    * IR SAT DATA AVAILABLE,       OHC AVAILABLE     *
                    *  THREE       CP032015  08/21/15  06 UTC        *

TIME (HR)          0     6    12    18    24    36    48    60    72    84    96   108   120
V (KT) NO LAND    30    30    31    32    34    40    45    51    56    60    61    63    62
V (KT) LAND       30    30    31    32    34    40    45    51    56    60    61    63    62
V (KT) LGE mod    30    30    31    31    32    35    39    43    48    53    57    60    61
Storm Type      TROP  TROP  TROP  TROP  TROP  TROP  TROP  TROP  TROP  TROP  TROP  TROP  TROP

SHEAR (KT)        18    14    12     9     6     8     6     8     7    15    20    26    21
SHEAR ADJ (KT)     7     7     1     0    -3    -4    -7    -3    -3    -4    -2    -4     0
SHEAR DIR         81    73    49    34   360   329   282   297   280   269   275   269   254
SST (C)         29.3  29.3  29.1  29.0  28.8  28.3  28.2  28.3  28.3  28.2  28.0  27.8  27.6
POT. INT. (KT)   159   159   157   156   154   149   146   145   146   144   142   140   137
200 MB T (C)   -52.2 -52.6 -52.6 -51.9 -51.9 -52.1 -51.6 -52.2 -51.8 -52.8 -52.4 -52.6 -52.2
TH_E DEV (C)       7     7     8     8     9     9     9     9     8     7     7     6     6
700-500 MB RH     69    68    66    67    67    67    68    73    77    79    76    77    74
MODEL VTX (KT)    18    18    17    16    16    15    15    16    17    19    20    23    23
850 MB ENV VOR    92    83    72    60    48    29    22    -2     6     9     8    15    35
200 MB DIV        76    49    25    23    40    24    59    55    63    71    78    36    49
700-850 TADV      -1    -1    -2    -3    -3     0     0     2     5     9    12    15     6
LAND (KM)        929   808   703   632   593   592   629   540   428   305   199   115    42
LAT (DEG N)     12.0  12.5  12.9  13.3  13.6  14.8  16.5  17.7  18.7  19.8  21.0  21.8  22.1
LONG(DEG W)    150.7 152.1 153.5 154.9 156.3 159.2 161.5 162.3 162.0 161.6 161.4 160.9 160.2
STM SPEED (KT)    12    14    14    14    15    15    10     6     6     6     5     4     3
HEAT CONTENT      31    29    30    28    35    47    46    53    55    57    41    31    26

  FORECAST TRACK FROM OFCI      INITIAL HEADING/SPEED (DEG/KT):300/ 10      CX,CY:  -8/  5
  T-12 MAX WIND:  30            PRESSURE OF STEERING LEVEL (MB):  609  (MEAN=581)
  GOES IR BRIGHTNESS TEMP. STD DEV.  50-200 KM RAD:  27.3 (MEAN=14.5)
  % GOES IR PIXELS WITH T < -20 C    50-200 KM RAD:  53.0 (MEAN=65.0)

                        INDIVIDUAL CONTRIBUTIONS TO INTENSITY CHANGE
                         6   12   18   24   36   48   60   72   84   96  108  120
                        ----------------------------------------------------------
  SAMPLE MEAN CHANGE     0.   0.   0.   1.   1.   1.   0.   0.  -1.  -1.  -2.  -2.
  SST POTENTIAL          0.   0.   1.   3.   8.  14.  20.  24.  27.  29.  30.  30.
  VERTICAL SHEAR MAG     0.   1.   2.   2.   3.   5.   5.   6.   5.   4.   1.   0.
  VERTICAL SHEAR ADJ     0.  -1.  -1.  -1.   0.   1.   1.   1.   1.   1.   2.   2.
  VERTICAL SHEAR DIR     1.   2.   3.   3.   3.   3.   2.   1.   0.   0.   0.   0.
  PERSISTENCE            0.   0.   0.  -1.  -1.  -1.  -1.  -1.  -1.  -1.   0.   0.
  200/250 MB TEMP.       0.  -1.  -1.  -2.  -4.  -6.  -7.  -9. -10. -11. -11. -11.
  THETA_E EXCESS         0.   0.   0.   0.   0.   0.   0.   0.   0.  -1.  -1.  -2.
  700-500 MB RH          0.   0.   0.   1.   1.   2.   2.   3.   4.   4.   5.   5.
  MODEL VTX TENDENCY     0.  -1.  -1.  -2.  -4.  -4.  -2.   0.   2.   4.   7.   8.
  850 MB ENV VORTICITY   0.   0.   0.   1.   1.   1.   1.   1.   1.   1.   1.   1.
  200 MB DIVERGENCE      0.   0.   0.   1.   1.   1.   1.   1.   0.   0.  -1.  -2.
  850-700 T ADVEC        0.   0.   0.   0.   0.   0.   0.   0.   0.   0.   1.   2.
  ZONAL STORM MOTION     0.   0.   0.   0.   1.   1.   1.   1.   0.   0.   0.   0.
  STEERING LEVEL PRES    0.   0.   0.   0.   0.   0.   1.   1.   1.   1.   1.   1.
  DAYS FROM CLIM. PEAK   0.   0.   0.   0.   0.   0.   0.   1.   1.   2.   2.   2.
  GOES PREDICTORS       -1.  -1.  -2.  -2.  -3.  -4.  -5.  -5.  -5.  -4.  -4.  -4.
  OCEAN HEAT CONTENT     0.   0.   1.   1.   2.   3.   3.   3.   3.   3.   3.   2.
                        ----------------------------------------------------------
  TOTAL CHANGE           0.   1.   2.   4.  10.  15.  21.  26.  30.  31.  33.  32.

   ** 2013 E. Pacific RI INDEX CP032015 THREE      08/21/15  06 UTC **
           ( 30 KT OR MORE MAX WIND INCREASE IN NEXT 24 HR)

 12 HR PERSISTENCE (KT):   0.0 Range:-22.0 to  38.5 Scaled/Wgted Val:  0.4/  0.8
 850-200 MB SHEAR (KT) :  11.7 Range: 18.7 to   1.4 Scaled/Wgted Val:  0.4/  0.6
 POT = MPI-VMAX (KT)   : 127.3 Range: 40.3 to 141.7 Scaled/Wgted Val:  0.9/  0.9
 STD DEV OF IR BR TEMP :  27.3 Range: 38.9 to   2.4 Scaled/Wgted Val:  0.3/  0.3
 Heat content (KJ/cm2) :  30.6 Range:  3.6 to  75.9 Scaled/Wgted Val:  0.4/  0.3
 D200 (10**7s-1)       :  42.6 Range:-11.0 to 135.3 Scaled/Wgted Val:  0.4/  0.3
 % area w/pixels <-30 C:  45.0 Range: 41.4 to 100.0 Scaled/Wgted Val:  0.1/  0.0
 850-700 MB REL HUM (%):  72.2 Range: 57.6 to  96.8 Scaled/Wgted Val:  0.4/ -0.1

 Prob of RI for 25 kt RI threshold=    23% is   1.8 times the sample mean(13.1%)
 Prob of RI for 30 kt RI threshold=    18% is   2.1 times the sample mean( 8.7%)
 Prob of RI for 35 kt RI threshold=    12% is   2.0 times the sample mean( 6.0%)
 Prob of RI for 40 kt RI threshold=     1% is   0.3 times the sample mean( 4.3%)
Well, well. Look what i found.
A SHIPS report from 8/21, not 8/18. Pretty damn accurate till now, wouldn't you say?
0 likes
-
Kingarabian
- S2K Supporter
- Posts: 16350
- Joined: Sat Aug 08, 2009 3:06 am
- Location: Honolulu, Hawaii
Re: CPAC: THREE-C - Tropical Depression
cane2cane wrote:
Well, well. Look what i found.
A SHIPS report from 8/21, not 8/18. Pretty damn accurate till now, wouldn't you say?
Okay then,
Why just use one model and ignore the rest of the intensity guidance including the CPHC?
(This was from a couple of hours ago)

0 likes
RIP Kobe Bryant
-
Kingarabian
- S2K Supporter
- Posts: 16350
- Joined: Sat Aug 08, 2009 3:06 am
- Location: Honolulu, Hawaii

-
Yellow Evan
- Professional-Met
- Posts: 16232
- Age: 27
- Joined: Fri Jul 15, 2011 12:48 pm
- Location: Henderson, Nevada/Honolulu, HI
- Contact:
-
Kingarabian
- S2K Supporter
- Posts: 16350
- Joined: Sat Aug 08, 2009 3:06 am
- Location: Honolulu, Hawaii
Re:
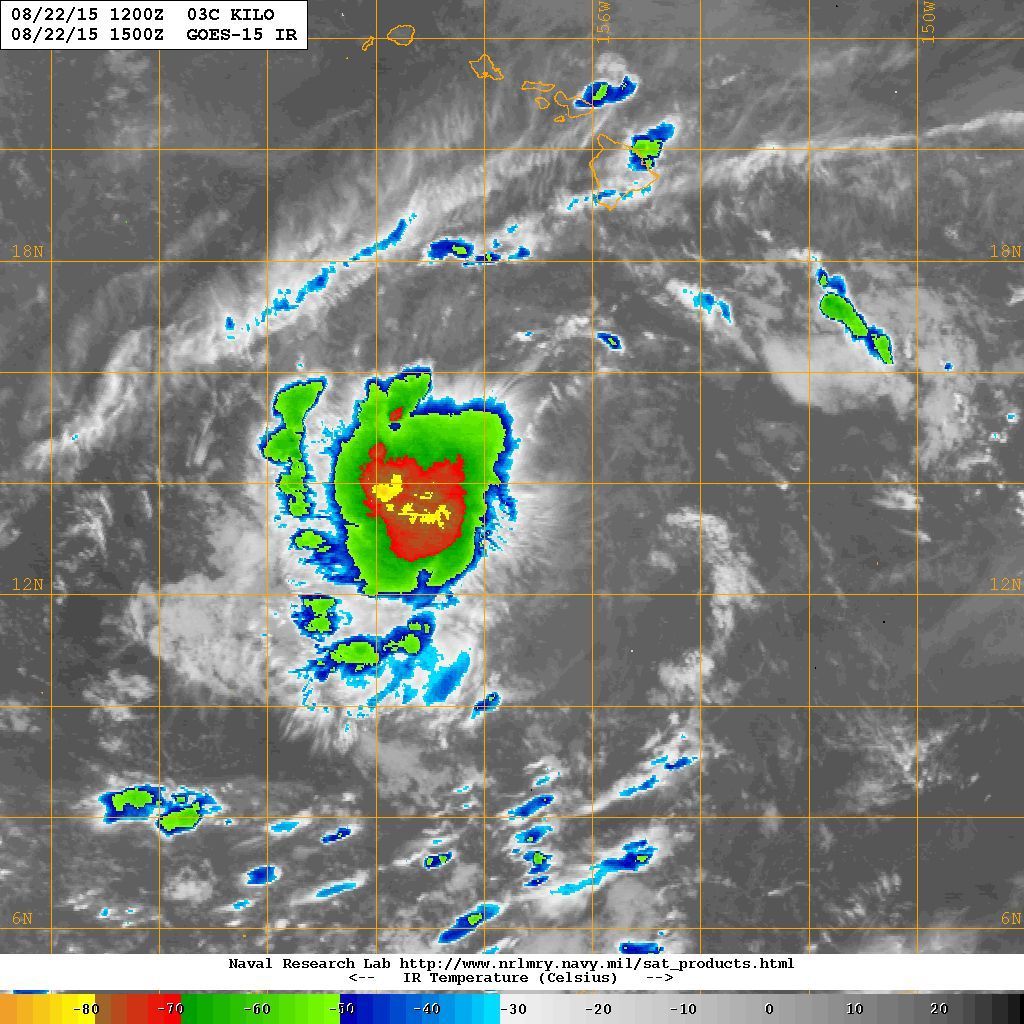
Alyono wrote:the mid level shear remains. Look at how flat the eastern edge of the convection is
That graphic Evan posted on the previous page showed Mid Level shear not decreasing for around another 12 hours until Kilo moves NW.
0 likes
RIP Kobe Bryant
-
Kingarabian
- S2K Supporter
- Posts: 16350
- Joined: Sat Aug 08, 2009 3:06 am
- Location: Honolulu, Hawaii
Re: CPAC: THREE-C - Tropical Depression
cane2cane wrote:So what?? lol. Why are you bringing other models into the conversation? I didn't say a peep about whether those models were more accurate or not.
I'm talking about SHIPS. SHIPS. Yellow Evan said the SHIPS model was useless or some shi* like that after its latest guidance printed what i assume to be velocities too low for his rubbernecking entertainment value. THen i pointed out that SHIPS has been pretty damn accurate SO FAR with its estimates.
I stand firm with my assertion. You all just WANT to believe in the worst case scenario.
Where is the EC in this? You couldnt wait to bring EC into the conversation when it had a hurricane in HILDA hitting Hawaii before it ultimately fizzled out.
You're overreacting right now. The SHIPS model is on point useless as are most of the other models until that synoptic mission is completed and its data is inputted into the models. But is it useless all the time? No. It's usually spot on with its shear forecasts. The hype and scare for Kilo started when model showed it coming close to Hawaii as a strong hurricane. No one wishes for that to happen, but it's what the models showed. Right now there is just frustration that the models have a very bad handle on it. It makes forecasting and protecting the people of Hawaii a lot harder when it's hard to pin point the a future track for this storm. Nothing more. I hope you understand this and have a good night.
Last edited by Kingarabian on Sat Aug 22, 2015 3:10 am, edited 1 time in total.
0 likes
RIP Kobe Bryant

Re: CPAC: THREE-C - Tropical Depression
cane2cane wrote:So what?? lol. Why are you bringing other models into the conversation? I didn't say a peep about whether those models were more accurate or not.
I'm talking about SHIPS. SHIPS. Yellow Evan said the SHIPS model was useless or some shi* like that after its latest guidance printed what i assume to be velocities too low for his rubbernecking entertainment value. THen i pointed out that SHIPS has been pretty damn accurate SO FAR with its estimates.
I stand firm with my assertion. You all just WANT to believe in the worst case scenario.
Nobody wants to believe in the worst case scenario.
He said that SHIPS was useless because all models are having problems forecasting this. They don't even have a consensus.
Take a look at the model spread:


cane2cane wrote:Where is the EC in this? You couldnt wait to bring EC into the conversation when it had a hurricane in HILDA hitting Hawaii before it ultimately fizzled out.
Here:
Yellow Evan wrote:0z ECMWF quite interesting. 992mbar by Day 5, stronger than last run.
Alyono wrote:ECMWF MUCH stronger and closer to Hawaii
Alyono wrote:EC still is a miss, but was a NE shift
Yellow Evan wrote:ECMWF through 6 days. Seems to have this moving NW due to a trough to the NW that is ex-Atsani.
0 likes
DISCLAIMER: I am not a meteorologist. Any posts I made, unless copied from some official agency, are only my opinion and is unofficial and often exaggerated. Please refer to your official RSMC for official products and warnings.
-
Kingarabian
- S2K Supporter
- Posts: 16350
- Joined: Sat Aug 08, 2009 3:06 am
- Location: Honolulu, Hawaii
-
tolakram
- Admin

- Posts: 20179
- Age: 62
- Joined: Sun Aug 27, 2006 8:23 pm
- Location: Florence, KY (name is Mark)
Re: CPAC: KILO - Tropical Depression
This thread needs to stay on topic. Posts insulting other members will be removed and warnings or suspensions issued. It is perfectly fine to disagree with someones opinion, it is not ok to insult other members.
0 likes
M a r k
- - - - -
Join us in chat: Storm2K Chatroom Invite. Android and IOS apps also available.
The posts in this forum are NOT official forecasts and should not be used as such. Posts are NOT endorsed by any professional institution or STORM2K.org. For official information and forecasts, please refer to NHC and NWS products.
-
Yellow Evan
- Professional-Met
- Posts: 16232
- Age: 27
- Joined: Fri Jul 15, 2011 12:48 pm
- Location: Henderson, Nevada/Honolulu, HI
- Contact:


-
Yellow Evan
- Professional-Met
- Posts: 16232
- Age: 27
- Joined: Fri Jul 15, 2011 12:48 pm
- Location: Henderson, Nevada/Honolulu, HI
- Contact:
WTPA41 PHFO 221453
TCDCP1
TROPICAL DEPRESSION KILO DISCUSSION NUMBER 8
NWS CENTRAL PACIFIC HURRICANE CENTER HONOLULU HI CP032015
500 AM HST SAT AUG 22 2015
THE CYCLONE CONTINUES TO STRUGGLE TO ORGANIZE...DESPITE BEING IN AN
AREA OF RELATIVELY WEAK SHEAR...AND OVER SUFFICIENTLY WARM WATER.
ALTHOUGH KILO IS PRODUCING A PERSISTENT AREA OF DEEP CONVECTION WITH
PROLIFIC LIGHTNING...LATEST SATELLITE IMAGES AND A 1238Z AMSU PASS
INDICATE THAT A POORLY ORGANIZED AND ELONGATED LOW LEVEL CIRCULATION
CENTER LIKELY EXISTS...AND REMAINS DISPLACED TO THE EAST OR
NORTHEAST OF THE CONVECTION. LATEST DVORAK SUBJECTIVE INTENSITY
ESTIMATES ARE UNSURPRISINGLY LOW...RANGING FROM TOO WEAK TO CLASSIFY
TO T1.5/25 KT...AND THESE SUPPORT LOWERING THE CURRENT INTENSITY TO
25 KT.
KILO CONTINUES TO TREK STEADILY WESTWARD...STEERED BY AN EAST TO
WEST ORIENTED MID- AND UPPER-LEVEL RIDGE CENTERED A COUPLE HUNDRED
MILES TO THE NORTH-NORTHEAST. THE INITIAL MOTION VECTOR IS
270/14 KT...AND LITTLE CHANGE IN FORWARD MOTION IS EXPECTED THROUGH
THE NEXT 24 HOURS. FROM 36 TO 72 HOURS...A WEAKNESS IN THE RIDGE
IS FORECAST TO DEVELOP...THUS INDUCING A REDUCTION IN FORWARD SPEED
AND A TURN TOWARD THE NORTHWEST. AS THE CYCLONE ROUNDS THE WESTERN
EDGE OF THE RIDGE ON DAYS 4 AND 5...STEERING CURRENTS WILL BECOME
QUITE WEAK...AND THE SYSTEM IS EXPECTED TO MOVE SLOWLY TOWARD THE
NORTHEAST. THE UPDATED FORECAST TRACK IS ESSENTIALLY AN UPDATE OF
THE PREVIOUS AND LIES VERY CLOSE TO THE TVCN CONSENSUS.
ALTHOUGH NORTHEASTERLY SHEAR IS RELATIVELY LIGHT...ANALYZED
AS BEING LESS THAN 5 KT BY UW-CIMSS...AND NEAR 10 KT BY SHIPS...
THE CYCLONE HAS NOT SHOWN ANY INCLINATION TO BECOME BETTER
ORGANIZED...AND THIS COMPLICATES THE INTENSITY FORECAST. SEA SURFACE
TEMPERATURES ARE ABOVE 28C ALONG THE FORECAST TRACK...AND OCEAN HEAT
CONTENT VALUES WILL INCREASE...PER RAMMB-CIRA ANALYSES. LATEST SHIPS
GUIDANCE OFFERS A SLIGHTLY DIFFERENT VIEW OF THE EVOLUTION OF THE
SHEAR PROFILE THAN EARLIER RUNS...AND NOW INDICATES 10 TO 15 KT OF
NORTHWESTERLY OR NORTHERLY SHEAR WILL OCCUR FROM TONIGHT THROUGH
MONDAY. WITH THIS IN MIND...ONLY MODEST STRENGTHENING IS FORECAST
IN THE SHORT TERM...WITH GREATER STRENGTHENING EXPECTED THEREAFTER
AS SHEAR DECREASES. THE UPDATED INTENSITY FORECAST IS WELL BELOW
HWRF AND GFDL GUIDANCE...IS CLOSER TO THE SHIPS AND LGEM...AND
ANTICIPATES KILO BECOMING A HURRICANE BY DAY 5. ALL OF THIS MAY BE
IRRELEVANT IF KILO IS UNABLE TO EFFECTIVELY ORGANIZE IN THE SHORT
TERM...AND DEGENERATES INTO A POST-TROPICAL REMNANT LOW. WHILE
SURPRISING...IT IS NOT UNHEARD OF IN THE CENTRAL NORTH PACIFIC BASIN.
THE U.S. 53RD WEATHER RECONNAISSANCE SQUADRON WILL CONDUCT ANOTHER
MISSION INTO KILO LATER THIS MORNING...AND WILL CONTINUE TO DO SO AT
12 HOURLY INTERVALS UNTIL FURTHER NOTICE IF NEEDED. AFTER DEPARTING
THE CYCLONE THIS MORNING...THE AIRCRAFT CREW WILL CONDUCT A SYNOPTIC
SURVEILLANCE MISSION TO ITS NORTHWEST...IN ORDER TO PROVIDE VALUABLE
DATA TO FORECASTERS AND NUMERICAL MODELS.
FORECAST POSITIONS AND MAX WINDS
INIT 22/1500Z 13.8N 158.2W 25 KT 30 MPH
12H 23/0000Z 14.5N 160.5W 30 KT 35 MPH
24H 23/1200Z 15.6N 163.0W 30 KT 35 MPH
36H 24/0000Z 16.4N 164.5W 35 KT 40 MPH
48H 24/1200Z 17.4N 165.1W 40 KT 45 MPH
72H 25/1200Z 18.6N 164.9W 50 KT 60 MPH
96H 26/1200Z 20.0N 164.0W 55 KT 65 MPH
120H 27/1200Z 20.6N 163.0W 65 KT 75 MPH
0 likes
-
srainhoutx
- S2K Supporter
- Posts: 6919
- Age: 68
- Joined: Sun Jan 14, 2007 11:34 am
- Location: Haywood County, NC
- Contact:
Re: CPAC: KILO - Tropical Depression
Kilo is providing an impressive light show with at times continuous lightning over the horizon SSE of Waikiki Beach this morning.
0 likes
Carla/Alicia/Jerry(In The Eye)/Michelle/Charley/Ivan/Dennis/Katrina/Rita/Wilma/Ike/Harvey
Member: National Weather Association
Wx Infinity Forums
http://wxinfinity.com/index.php
Facebook.com/WeatherInfinity
Twitter @WeatherInfinity
Member: National Weather Association
Wx Infinity Forums
http://wxinfinity.com/index.php
Facebook.com/WeatherInfinity
Twitter @WeatherInfinity
Who is online
Users browsing this forum: No registered users and 11 guests