Digital-TC-Chaser wrote:
I'm not sure what exactly you're trying to point out wiht this map? It's obviously a 500mb UK map at 120hr. The following 0Z UK modal data was posted a short while ago
UKMET says...
MET OFFICE TROPICAL CYCLONE GUIDANCE FOR NORTH-EAST PACIFIC AND ATLANTIC
GLOBAL MODEL DATA TIME 0000UTC 03.10.2016
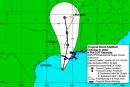
HURRICANE MATTHEW ANALYSED POSITION : 14.4N 74.8W
ATCF IDENTIFIER : AL142016
LEAD CENTRAL MAXIMUM WIND
VERIFYING TIME TIME POSITION PRESSURE (MB) SPEED (KNOTS)
-------------- ---- -------- ------------- -------------
0000UTC 03.10.2016 0 14.4N 74.8W 980 59
1200UTC 03.10.2016 12 15.3N 74.6W 976 59
0000UTC 04.10.2016 24 16.9N 74.3W 975 61
1200UTC 04.10.2016 36 18.9N 74.0W 975 61
0000UTC 05.10.2016 48 20.9N 74.2W 974 64
1200UTC 05.10.2016 60 22.4N 74.8W 975 61
0000UTC 06.10.2016 72 23.9N 75.2W 973 61
1200UTC 06.10.2016 84 25.3N 75.9W 968 67
0000UTC 07.10.2016 96 27.0N 76.4W 959 76
1200UTC 07.10.2016 108 28.8N 77.1W 947 75
0000UTC 08.10.2016 120 30.7N 78.0W 945 77
1200UTC 08.10.2016 132 32.6N 78.0W 946 74
0000UTC 09.10.2016 144 35.1N 76.6W 955 68
Based on the data above, Matthew will be approx. 200 miles ENE of Jacksonville Fl. The map you are displaying is not an indication of the storm itself, but I am curious what this mid level vorticity is related too and where did it come from???


