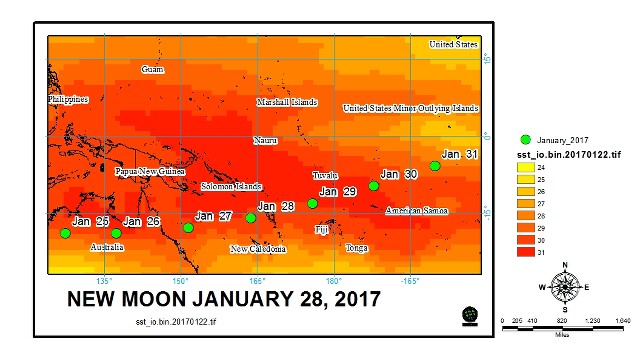
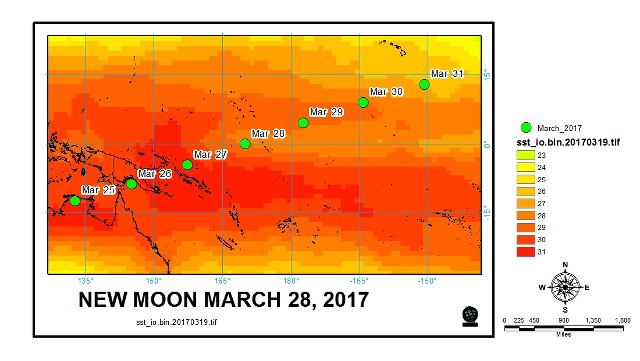
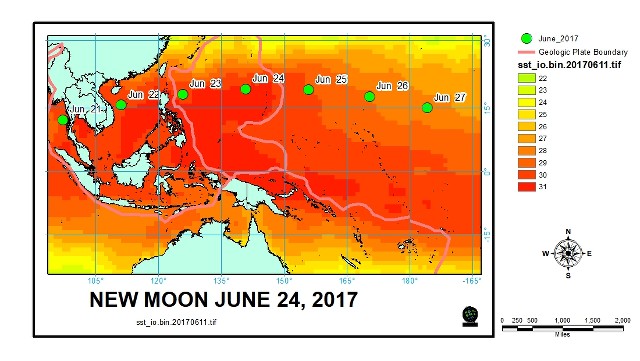
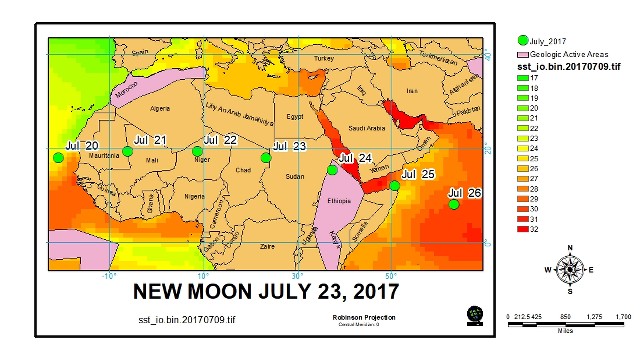
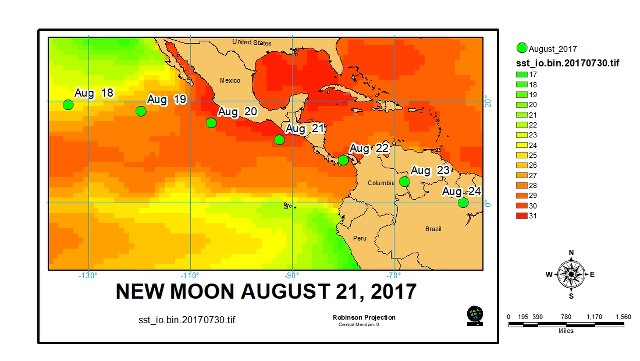
This is the plot of global water vapor for August 2017. The square miles of cloud cover ticked up year over year. There seems to be a pattern emerging of a progression in the month of the annual uptick, in 2015 the up tick was in October, 2016 it was September, 2017 it was August.
Also global earthquake frequency seems to be generally inversely related to the strength of relative incoming celestial gravity. There is a lot of variability to this. There was a drop in earthquake frequency over the New Moon Phase during the eclipse over last month. I was expecting an up tick being that the earth moon distance had increased over last month, perigee at the New Moon was May 2017, so the New Moon distance to earth is increasing. The overall frequency of earthquakes at the New Moon has been dropping since June 2014.