2017 indicators: SST's / MSLP / SAL / Steering / Instability

This is the general tropical discussion area. Anyone can take their shot at predicting a storms path.

Moderator: S2k Moderators

Forum rules

The posts in this forum are NOT official forecasts and should not be used as such. They are just the opinion of the poster and may or may not be backed by sound meteorological data. They are NOT endorsed by any professional institution or STORM2K. For official information, please refer to products from the National Hurricane Center and National Weather Service.

Help Support Storm2K
Message
Author
User avatar
Bocadude85
Category 5
Category 5
Posts: 2991
Age: 38
Joined: Mon Apr 18, 2005 2:20 pm
Location: Honolulu,Hi

Re: 2017 indicators: SST's / MSLP / SAL / Steering / Instability

#1161 Postby Bocadude85 » Fri Aug 04, 2017 2:25 pm

tolakram wrote:I was wondering why the models were so enthusiastic this early but I figured I missed something. We shall see.

In 2013 we were all gobsmacked that no activity was happening but, as we've said, the signs were there. Are we missing any signs that this season might be below normal? Expectations are still slightly above normal and as far as I know we don't have any of the negative indicators that we've seen in prior years.


I think the biggest factor so far is that the season is still very young, yes hurricane activity dramatically increases in August but it is only August 4th after all. We could see a potential hurricane in the BOC and 99L could very well become a hurricane once it reaches farther west as well. The conditions in the Atlantic are becoming more favorable with each passing day. I personally think this season is going to be a late bloomer.
0 likes   

User avatar
Hammy
Category 5
Category 5
Posts: 5849
Age: 41
Joined: Fri May 25, 2012 5:25 pm
Contact:

Re: 2017 indicators: SST's / MSLP / SAL / Steering / Instability

#1162 Postby Hammy » Fri Aug 04, 2017 2:33 pm

cycloneye wrote:
tolakram wrote:I was wondering why the models were so enthusiastic this early but I figured I missed something. We shall see.

In 2013 we were all gobsmacked that no activity was happening but, as we've said, the signs were there. Are we missing any signs that this season might be below normal? Expectations are still slightly above normal and as far as I know we don't have any of the negative indicators that we've seen in prior years.


One of the main factors in favor of the North Atlantic in 2017 season is the lack of El Nino so that alone should be a plus.


I've done quite a bit of after-the-fact comparison (each year since in fact) of 2013 vs now, and the thing that stands out the most was that year featured significantly above normal shear (basin-wide), below normal MDR water temps, and for the most part a lack of strong waves exiting Africa--in fact I even remember a few that got hung up at the coast and dissipated entirely before even exiting.

Interestingly I remember 2011, which had 8 storms by Aug 20 with no hurricanes (quantity over quality) and remember many "will this year go hurricane-free" posts.

I will say the models are adding to people's impatience this year, as the GFS has been far more conservative if there's not an active invest out there (a few days ago it showed nothing at all, not even tropical waves, through the middle of August) and then back to it's old tricks once we get an invest.

And given the model issues, I still think we'll have 3-5 days notice prior to things getting active--f that magic date is August 20, the season will likely look dead for the whole two week period up until the Aug 17 runs.
1 likes   
The above post is not official and should not be used as such. It is the opinion of the poster and may or may not be backed by sound meteorological data. It is not endorsed by any professional institution or storm2k.org. For official information, please refer to the NHC and NWS products.

TheStormExpert

Re: 2017 indicators: SST's / MSLP / SAL / Steering / Instability

#1163 Postby TheStormExpert » Fri Aug 04, 2017 2:53 pm

I've always considered the months of August, September, and October as the peak months. I guess that has changed within the past few years.
1 likes   

RL3AO
Moderator-Pro Met
Moderator-Pro Met
Posts: 16308
Joined: Thu Jun 14, 2007 10:03 pm
Location: NC

Re: 2017 indicators: SST's / MSLP / SAL / Steering / Instability

#1164 Postby RL3AO » Fri Aug 04, 2017 3:06 pm

TheStormExpert wrote:I've always considered the months of August, September, and October as the peak months. I guess that has changed within the past few years.


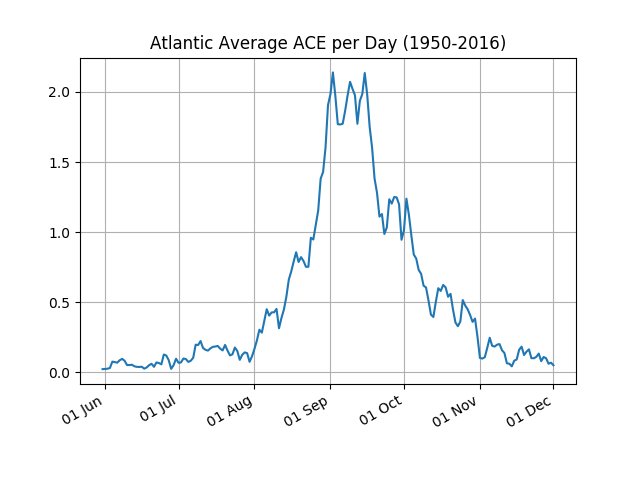
Yes, but the change is very quick. If you look at the average ACE per day, the ramp up during the first few weeks of August is surprisingly quick. August 15th is much different than August 1st

Code: Select all

01 Aug = 0.17
08 Aug = 0.43
15 Aug = 0.66
22 Aug = 0.75
29 Aug = 1.43
06 Sep = 1.77
13 Sep = 1.94
15 Sep = 2.14 <- Peak for ACE per day
0 likes   

User avatar
Hammy
Category 5
Category 5
Posts: 5849
Age: 41
Joined: Fri May 25, 2012 5:25 pm
Contact:

Re: 2017 indicators: SST's / MSLP / SAL / Steering / Instability

#1165 Postby Hammy » Fri Aug 04, 2017 3:07 pm

TheStormExpert wrote:I've always considered the months of August, September, and October as the peak months. I guess that has changed within the past few years.


I did a bit of number crunching and it seems like the peak has shifted later in the year recently. From 1979-97, there were 50 storms and 19 hurricanes prior to August 15, and 39 storms with 28 hurricanes after September 30. From 1997-2016, there were 50 storms and 19 hurricanes before Aug 15, and 67 storms with 38 hurricanes after Sep 30. The interesting thing to note is the numbers are expected to all be higher due to the active cycle vs quiet, but the number of hurricanes in the first 10-12 weeks didn't change, but the number in the last 8+ weeks went up 35%, while the number of storms for those periods went up 26% for the first period but went up 72% for the second, so there's been a clear increase in the frequency of back-loaded seasons compared to front-loaded ones. Seasons like 1998 and 2010 are seemingly more common than ones like 1996 and 2008.
3 likes   
The above post is not official and should not be used as such. It is the opinion of the poster and may or may not be backed by sound meteorological data. It is not endorsed by any professional institution or storm2k.org. For official information, please refer to the NHC and NWS products.

RL3AO
Moderator-Pro Met
Moderator-Pro Met
Posts: 16308
Joined: Thu Jun 14, 2007 10:03 pm
Location: NC

Re: 2017 indicators: SST's / MSLP / SAL / Steering / Instability

#1166 Postby RL3AO » Fri Aug 04, 2017 3:19 pm

Hammy wrote:
TheStormExpert wrote:I've always considered the months of August, September, and October as the peak months. I guess that has changed within the past few years.


I did a bit of number crunching and it seems like the peak has shifted later in the year recently. From 1979-97, there were 50 storms and 19 hurricanes prior to August 15, and 39 storms with 28 hurricanes after September 30. From 1997-2016, there were 50 storms and 19 hurricanes before Aug 15, and 67 storms with 38 hurricanes after Sep 30. The interesting thing to note is the numbers are expected to all be higher due to the active cycle vs quiet, but the number of hurricanes in the first 10-12 weeks didn't change, but the number in the last 8+ weeks went up 35%, while the number of storms for those periods went up 26% for the first period but went up 72% for the second, so there's been a clear increase in the frequency of back-loaded seasons compared to front-loaded ones. Seasons like 1998 and 2010 are seemingly more common than ones like 1996 and 2008.


I made these for you. Average ACE per day during those two periods. It does actually appear that the first part of August has been slower during the last 20 years or so. On the other hand, I'm guessing July appears so active in 1998-2016 mostly due to Dennis and Emily.


Image
Image
1 likes   

RL3AO
Moderator-Pro Met
Moderator-Pro Met
Posts: 16308
Joined: Thu Jun 14, 2007 10:03 pm
Location: NC

Re: 2017 indicators: SST's / MSLP / SAL / Steering / Instability

#1167 Postby RL3AO » Fri Aug 04, 2017 3:30 pm

Heres since 1950 if anyone cares. The average ACE today is what you'd expect in late-October.

Image
1 likes   

User avatar
tarheelprogrammer
S2K Supporter
S2K Supporter
Posts: 1793
Joined: Mon Mar 28, 2016 9:25 pm
Location: Raleigh, NC area (Garner, NC)

Re: 2017 indicators: SST's / MSLP / SAL / Steering / Instability

#1168 Postby tarheelprogrammer » Fri Aug 04, 2017 3:45 pm

What is the average date of the first hurricane in the Atlantic? From 1950-2016.
0 likes   
My posts are not official forecasts. They are just my opinion and may or may not be backed by sound meteorological data. They are NOT endorsed by any professional institution or storm2k.org. For official information, please refer to the NHC and NWS products.

User avatar
CyclonicFury
Category 5
Category 5
Posts: 2025
Age: 26
Joined: Sun Jul 02, 2017 12:32 pm
Location: NC
Contact:

Re: 2017 indicators: SST's / MSLP / SAL / Steering / Instability

#1169 Postby CyclonicFury » Fri Aug 04, 2017 3:47 pm

tarheelprogrammer wrote:What is the average date of the first hurricane in the Atlantic? From 1950-2016.

I think it's August 10th.
1 likes   
NCSU B.S. in Meteorology Class of 2021. Tropical weather blogger at http://www.cyclonicfury.com. My forecasts and thoughts are NOT official, for official forecasts please consult the National Hurricane Center.

RL3AO
Moderator-Pro Met
Moderator-Pro Met
Posts: 16308
Joined: Thu Jun 14, 2007 10:03 pm
Location: NC

Re: 2017 indicators: SST's / MSLP / SAL / Steering / Instability

#1170 Postby RL3AO » Fri Aug 04, 2017 4:14 pm

tarheelprogrammer wrote:What is the average date of the first hurricane in the Atlantic? From 1950-2016.


Here's the list for each year sorted by earliest.

Code: Select all

01 Jan 1955
14 Jan 2016
17 May 1951
20 May 1970
03 Jun 1968
03 Jun 1982
04 Jun 1995
06 Jun 1966
18 Jun 1972
19 Jun 1959
21 Jun 2012
25 Jun 1954
25 Jun 1957
25 Jun 1986
30 Jun 2010
03 Jul 1973
03 Jul 2014
06 Jul 2005
07 Jul 1996
07 Jul 2008
10 Jul 2003
11 Jul 1979
12 Jul 1997
15 Jul 1960
20 Jul 1961
24 Jul 1985
26 Jul 1956
27 Jul 1975
29 Jul 1990
01 Aug 1989
02 Aug 1963
03 Aug 1980
03 Aug 2004
06 Aug 1971
06 Aug 2000
07 Aug 1976
08 Aug 1978
11 Aug 1969
12 Aug 1953
13 Aug 1958
14 Aug 1950
16 Aug 2007
17 Aug 1983
17 Aug 1991
17 Aug 2009
18 Aug 1994
20 Aug 1981
20 Aug 2015
21 Aug 1964
21 Aug 1999
22 Aug 1987
22 Aug 1992
22 Aug 1998
22 Aug 2011
23 Aug 1965
26 Aug 1993
27 Aug 2006
28 Aug 1962
28 Aug 1974
29 Aug 1952
30 Aug 1977
02 Sep 1988
03 Sep 1967
09 Sep 2001
10 Sep 1984
11 Sep 2002
11 Sep 2013


Mean Date - July 23rd (mostly because of the two January hurricanes)
Median Date - August 6th
25th Percentile Date - July 4th
75th Percentile Date - August 22nd
90th Percentile Date - August 30th
3 likes   

RL3AO
Moderator-Pro Met
Moderator-Pro Met
Posts: 16308
Joined: Thu Jun 14, 2007 10:03 pm
Location: NC

Re: 2017 indicators: SST's / MSLP / SAL / Steering / Instability

#1171 Postby RL3AO » Fri Aug 04, 2017 4:34 pm

The above data in graphical form.

Image
1 likes   

User avatar
Hammy
Category 5
Category 5
Posts: 5849
Age: 41
Joined: Fri May 25, 2012 5:25 pm
Contact:

Re: 2017 indicators: SST's / MSLP / SAL / Steering / Instability

#1172 Postby Hammy » Fri Aug 04, 2017 6:12 pm

:uarrow: What's interesting above is that not only was there a relative drop in early August but a raw drop for much of the first half as well.
0 likes   
The above post is not official and should not be used as such. It is the opinion of the poster and may or may not be backed by sound meteorological data. It is not endorsed by any professional institution or storm2k.org. For official information, please refer to the NHC and NWS products.

TheStormExpert

Re: 2017 indicators: SST's / MSLP / SAL / Steering / Instability

#1173 Postby TheStormExpert » Fri Aug 04, 2017 11:10 pm

If these Upper level lows keep popping up near the NE Caribbean that should put a lid on the potential for a quality season.
1 likes   

User avatar
tarheelprogrammer
S2K Supporter
S2K Supporter
Posts: 1793
Joined: Mon Mar 28, 2016 9:25 pm
Location: Raleigh, NC area (Garner, NC)

Re: 2017 indicators: SST's / MSLP / SAL / Steering / Instability

#1174 Postby tarheelprogrammer » Fri Aug 04, 2017 11:12 pm

TheStormExpert wrote:If these Upper level lows keep popping up near the NE Caribbean that should put a lid on the potential for a quality season.


They seem to be getting more and more numerous year after year. Always in a good position, or at least almost always in a good position to keep a storm weak. That has been a blessing for the US. Anyone know why the Caribbean is so hostile as we approach the peak of the season? Shouldn't it be better overall in terms of development?
0 likes   
My posts are not official forecasts. They are just my opinion and may or may not be backed by sound meteorological data. They are NOT endorsed by any professional institution or storm2k.org. For official information, please refer to the NHC and NWS products.

TheStormExpert

Re: 2017 indicators: SST's / MSLP / SAL / Steering / Instability

#1175 Postby TheStormExpert » Fri Aug 04, 2017 11:13 pm

tarheelprogrammer wrote:
TheStormExpert wrote:If these Upper level lows keep popping up near the NE Caribbean that should put a lid on the potential for a quality season.


They seem to be getting more and more numerous year after year. Always in a good position, or at least almost always in a good position to keep a storm weak. That has been a blessing for the US. Anyone know why the Caribbean is so hostile as we approach the peak of the season? Shouldn't it be better overall in terms of development?

If this were an El Niño I'd totally understand why the Caribbean is hostile in August but we are not in one.
2 likes   

User avatar
Hammy
Category 5
Category 5
Posts: 5849
Age: 41
Joined: Fri May 25, 2012 5:25 pm
Contact:

Re: 2017 indicators: SST's / MSLP / SAL / Steering / Instability

#1176 Postby Hammy » Fri Aug 04, 2017 11:37 pm

TheStormExpert wrote:
tarheelprogrammer wrote:
TheStormExpert wrote:If these Upper level lows keep popping up near the NE Caribbean that should put a lid on the potential for a quality season.


They seem to be getting more and more numerous year after year. Always in a good position, or at least almost always in a good position to keep a storm weak. That has been a blessing for the US. Anyone know why the Caribbean is so hostile as we approach the peak of the season? Shouldn't it be better overall in terms of development?

If this were an El Niño I'd totally understand why the Caribbean is hostile in August but we are not in one.


This is typical and part of the TUTT--in 2000 few storms (especially early on) made it past 60W intact but the season was still quite productive in both numbers and intensity. Remember, we're in the first week of August right now, not the first week of September.
0 likes   
The above post is not official and should not be used as such. It is the opinion of the poster and may or may not be backed by sound meteorological data. It is not endorsed by any professional institution or storm2k.org. For official information, please refer to the NHC and NWS products.
TheStormExpert

Re: 2017 indicators: SST's / MSLP / SAL / Steering / Instability

#1177 Postby TheStormExpert » Sat Aug 05, 2017 8:28 am

Michael Ventrice starting to become skeptical about this season.

 https://twitter.com/mjventrice/status/893796542406164480


1 likes   

AutoPenalti
Category 5
Category 5
Posts: 4030
Age: 29
Joined: Mon Aug 17, 2015 4:16 pm
Location: Ft. Lauderdale, Florida

Re: 2017 indicators: SST's / MSLP / SAL / Steering / Instability

#1178 Postby AutoPenalti » Sat Aug 05, 2017 1:40 pm

TheStormExpert wrote:Michael Ventrice starting to become skeptical about this season.

 https://twitter.com/mjventrice/status/893796542406164480


In before season cancelled posts... :roll:
1 likes   
The posts in this forum are NOT official forecasts and should not be used as such. They are just the opinion of the poster and may or may not be backed by sound meteorological data. They are NOT endorsed by any professional institution or STORM2K. For official information, please refer to products from the NHC and NWS.


Model Runs Cheat Sheet:
GFS (5:30 AM/PM, 11:30 AM/PM)
HWRF, GFDL, UKMET, NAVGEM (6:30-8:00 AM/PM, 12:30-2:00 AM/PM)
ECMWF (1:45 AM/PM)

TCVN
is a weighted averaged

User avatar
Kingarabian
S2K Supporter
S2K Supporter
Posts: 15981
Joined: Sat Aug 08, 2009 3:06 am
Location: Honolulu, Hawaii

Re: 2017 indicators: SST's / MSLP / SAL / Steering / Instability

#1179 Postby Kingarabian » Sat Aug 05, 2017 2:32 pm

TheStormExpert wrote:Michael Ventrice starting to become skeptical about this season.

 https://twitter.com/mjventrice/status/893796542406164480


As long as that pattern does not change it'll be tough to get systems out in the Atlantic. Background forcing continues to be a problem.

Blue/Purple = rising air = increased convergence = favorable for TC development.

Yellow/Orange/Red = sinking air = deceased convergence = unfavorable for TC development.

It's a La Nina pattern yet an El Nino pattern at the same time. When you have rising air in the WPac and sinking air in the CPac, the sinking usually always includes the EPac thus the air rebounds and rises in the Atlantic. That's why in a La Nina, the EPac is so quiet and the Atlantic is active. But so far, the air is rebounding and rising in the EPac (after it sinks in the CPac) thus displacing the sinking air back into the Atlantic. This is what typically happens in an El Nino and you see increased activity in the EPac and suppressed activity in the Atlantic.

But this should not be happening and the air in the EPac is not supposed to rise -- especially since the SOI is so positive (well into La Nina territory). I'm guessing the warm Nino regions are the culprits for this.
Last edited by Kingarabian on Sat Aug 05, 2017 3:05 pm, edited 3 times in total.
0 likes   
RIP Kobe Bryant

User avatar
Kingarabian
S2K Supporter
S2K Supporter
Posts: 15981
Joined: Sat Aug 08, 2009 3:06 am
Location: Honolulu, Hawaii

Re: 2017 indicators: SST's / MSLP / SAL / Steering / Instability

#1180 Postby Kingarabian » Sat Aug 05, 2017 2:57 pm

Here are the same VP anomalies averages for MJJ posted back in July.

Image

So far for August, convergence has expanded in the EPac and decreased considerably in the Atlantic as shown in the Mike Ventrice tweet.
0 likes   
RIP Kobe Bryant


Return to “Talkin' Tropics”

Who is online

Users browsing this forum: abajan, IsabelaWeather, riapal, Stratton23, TampaWxLurker, TheBurn and 58 guests