One thing that I've noticed that might need to be considered is that, from what I've seen, infrared data from polar orbiters like the AHVRR instrument seem to run a bit colder (and the sea surface much warmer) than data from their geostationary counterparts. As one example, compare
this AVHRR infrared image of Hurricane Kenneth in 1993 with this
this GOES infrared image of Kenneth from the same time. There is, of course, a difference in clarity, but the differences between the two images are a bit more drastic than one might expect from a simple difference in resolution. In the AVHRR image there's an impressive cold medium gray (CMG) ring around a warm medium gray (WMG) eye, with a nearly complete and thick cold dark gray (CDG) ring, information that might tell an aggressive analyst to rate the system a T7.5 for 155 knots. On the other hand, the GOES image shows only light gray (CMG) cloudtops around the eyewall, and even then they don't seem to be thick enough to be considered in calculating the eye number in a Dvorak analysis; an analyst may look at this and classify the system as a T6.5 for 125 knots. The best track data for the system has it at 125 knots at the time.
One might chalk this up to a difference in viewing angle. That's a great guess, but the answer might not be as clear cut as that. In the AVHRR image above, we see that the storm passed well within the scanning area of the polar-orbiting satellite, meaning that the orbiter went almost directly overhead, resulting in a low zenith angle (alternatively, the distance from the storm to the spot directly beneath the satellite is small). By comparison, the GOES satellite, in a stationary position at 135*W, would have a larger zenith angle (alternatively, the distance from the storm to the spot directly beneath the satellite is larger). However, one would expect that a larger zenith angle would produce cooler cloud tops due to the effects of limb cooling (zenith angles explained briefly on page 65 in
this presentation (PDF) and a little bit on limb cooling explained in
this presentation (PDF)).
One may also point to a potential difference in band sensitivities, but even this is a bit ambiguous. The choice band for infrared cloud-top imagery on AVHRR has been band 4,
which is sensitive to wavelengths of 10.3 microns to 11.3 microns for a central wavelength of 10.8 microns. On the other hand, the choice band for infrared cloud-top imagery on the last generation of GOES was band 4,
sensitive to wavelengths of 10.2 microns to 11.2 microns for a central wavelength of 10.7 microns (PDF); that means there wasn't much difference between the two. Ffor an illustration, compare
this clean IR (10.3 microns) image of TD 04E with
this traditional longwave IR (11.2 microns) image of TD 04E. There are some slight differences, but certainly not the drastic ~ 5°C difference implied from the first two images of Kenneth, and 5°C can make a lot of difference in the world of satellite intensity estimation.
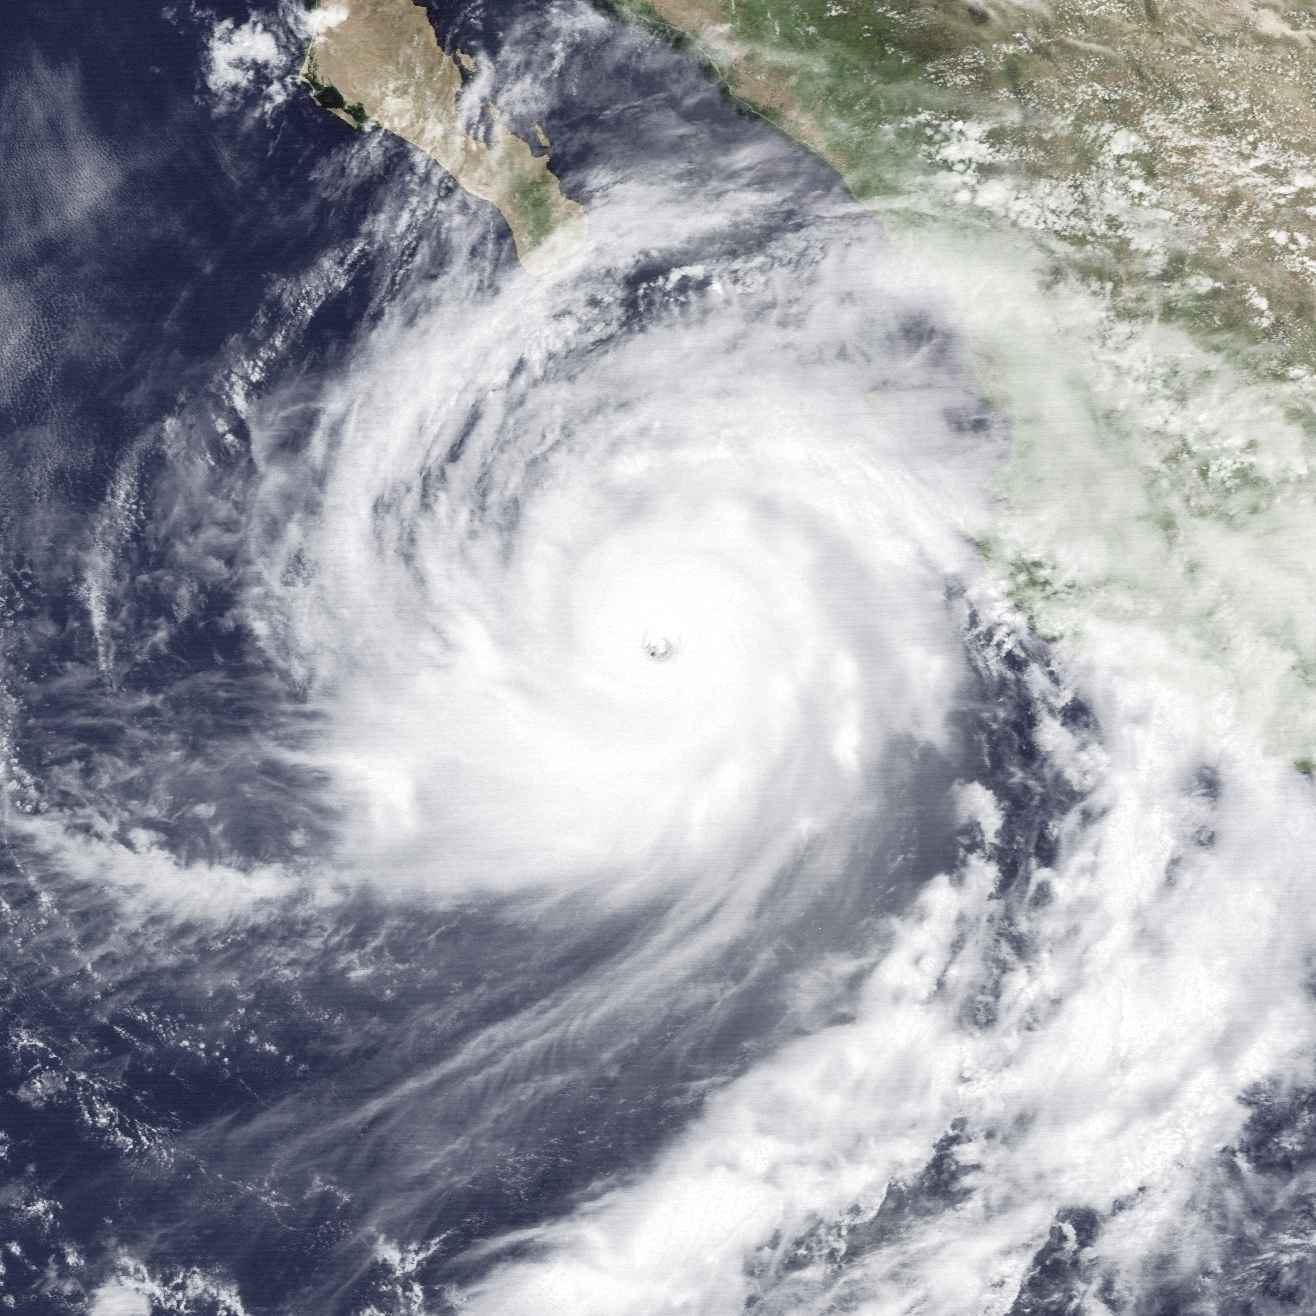
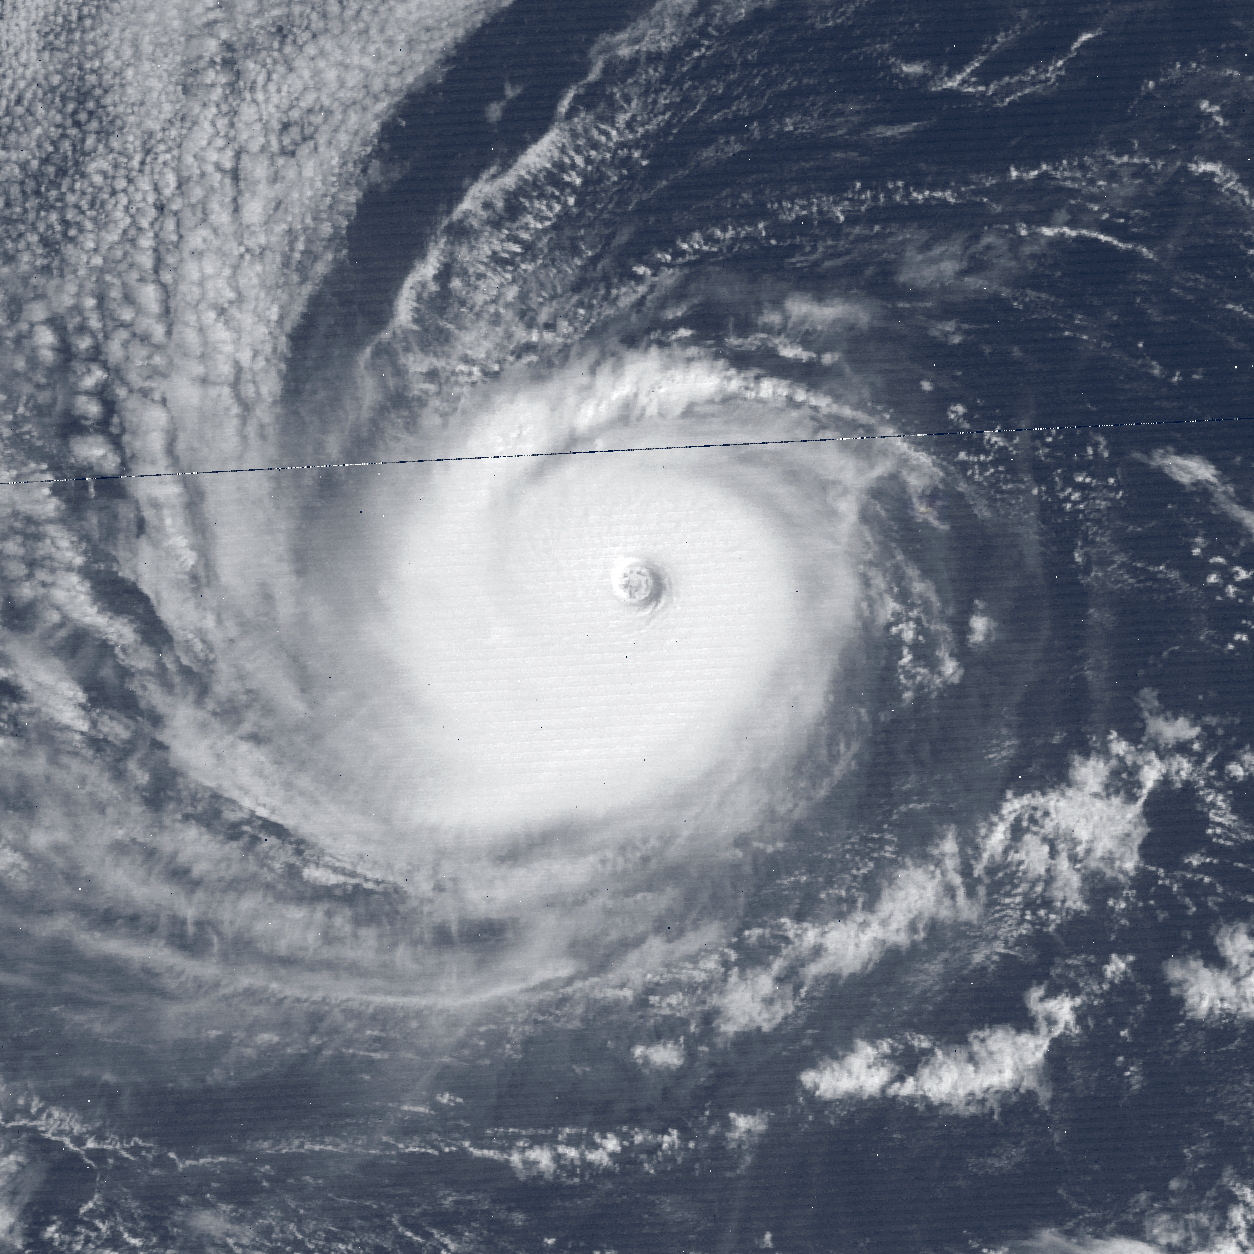
This isn't just something that ought to be considered with old imagery from the 1980s and 1990s, either. Compare
this GOES-13 infrared image of Hurricane Irma with
this image from the F17 polar orbiter, taken within 5 minutes of eachother. There are just a few smidgens of cloud tops that dip below -75°C, while the bulk of the eyewall is around -70°C, forming that large white band you see. The eye there is about +18°C, I would estimate. However, pop open the AVHRR image and wow, where did all those grays in the eyewall come from? In the F17 image, cloud tops are pushing under -80°C and we now have a nearly complete ring of sub -75°C cloud tops. Meanwhile, the eye in the polar orbiter is much warmer, at around +24°C!
Knowing what we know about tropical cyclones today, a lot of cyclones outside of the Atlantic in the 20th century have definitely been grossly underestimated. A lot of that can be gleaned from low-resolution geostationary images, in addition to other supporting evidence. But there might be a little catch, a tiny asterisk if you will, when considering some of the high resolution polar orbiting imagery we have. Food for thought.


