
2018 Indicators: SST's / MSLP / Sal / Steering / Shear / Instability (Graphic updates at first post)
Moderator: S2k Moderators
Forum rules

The posts in this forum are NOT official forecasts and should not be used as such. They are just the opinion of the poster and may or may not be backed by sound meteorological data. They are NOT endorsed by any professional institution or STORM2K. For official information, please refer to products from the National Hurricane Center and National Weather Service.
-
wxman57

- Moderator-Pro Met

- Posts: 23175
- Age: 68
- Joined: Sat Jun 21, 2003 8:06 pm
- Location: Houston, TX (southwest)
Re: 2018 Indicators: SST's / MSLP / Sal / Steering / Shear / Instability (Graphic updates at first post)
The NASA dust forecast at day 10 looks quite hostile toward development. Dry, dusty air to dominate tropics next few weeks. Good chance we'll make it to August before Beryl forms.
1 likes
-
CyclonicFury

- Category 5

- Posts: 2038
- Age: 27
- Joined: Sun Jul 02, 2017 12:32 pm
- Location: NC
- Contact:
Re: 2018 Indicators: SST's / MSLP / Sal / Steering / Shear / Instability (Graphic updates at first post)
Models do seem to be showing some stronger tropical waves moving off Africa beginning next week. However, MDR will likely be too cool and too dry to support any development for the next 4-6 weeks or so. Genesis in the deep tropical Atlantic does not seem likely until August, but we could sneak out a weak storm in the subtropics some time in July.
1 likes
NCSU B.S. in Meteorology Class of 2021. Tropical weather blogger at http://www.cyclonicfury.com. My forecasts and thoughts are NOT official, for official forecasts please consult the National Hurricane Center.


Re: 2018 Indicators: SST's / MSLP / Sal / Steering / Shear / Instability (Graphic updates at first post)
4 likes
The above post and any post by Ntxw is NOT an official forecast and should not be used as such. It is just the opinion of the poster and may or may not be backed by sound meteorological data. It is NOT endorsed by any professional institution including Storm2k. For official information, please refer to NWS products.
Help support Storm2K!

Re: 2018 Indicators: SST's / MSLP / Sal / Steering / Shear / Instability (Graphic updates at first post)
Alyono wrote:
which is why I went with 18 storms
Thats a massive and bold call!
I mean even for a neutral season in terms of ENSO with a decent Atlantic warmth in the deeper tropics and average subtropics, thats a fairly big total to reach, let alone with a season with a rubbish MDR profile and a developing El Nino profile. Equally I'm not buying those who are basically saying a shut-out season either, and besides it really does only need one well timed wave to make a season memorable.
With this set-up aloft, need to watch for those little nippers that race up the W.Atlantic from frontal systems, they seem pretty common in developing El nino seasons during July (Arthur 14, Claudette 15, Beryl 06, Alex 04, etc).
Despite what looks like a decent sub-tropics forecast, I'm still struggling to see us getting above 12 NS, UNLESS we do get one of those stringy LP chains which pump out 2-3 systems in a 7 day period.
Last edited by KWT on Thu Jun 21, 2018 2:22 pm, edited 2 times in total.
6 likes
Personal Forecast Disclaimer:
The posts in this forum are NOT official forecast and should not be used as such. They are just the opinion of the poster and may or may not be backed by sound meteorological data. They are NOT endorsed by any professional institution or storm2k.org. For official information, please refer to the NHC and NWS products
The posts in this forum are NOT official forecast and should not be used as such. They are just the opinion of the poster and may or may not be backed by sound meteorological data. They are NOT endorsed by any professional institution or storm2k.org. For official information, please refer to the NHC and NWS products
-
gatorcane

- S2K Supporter

- Posts: 23708
- Age: 48
- Joined: Sun Mar 13, 2005 3:54 pm
- Location: Boca Raton, FL
Re: 2018 Indicators: SST's / MSLP / Sal / Steering / Shear / Instability (Graphic updates at first post)
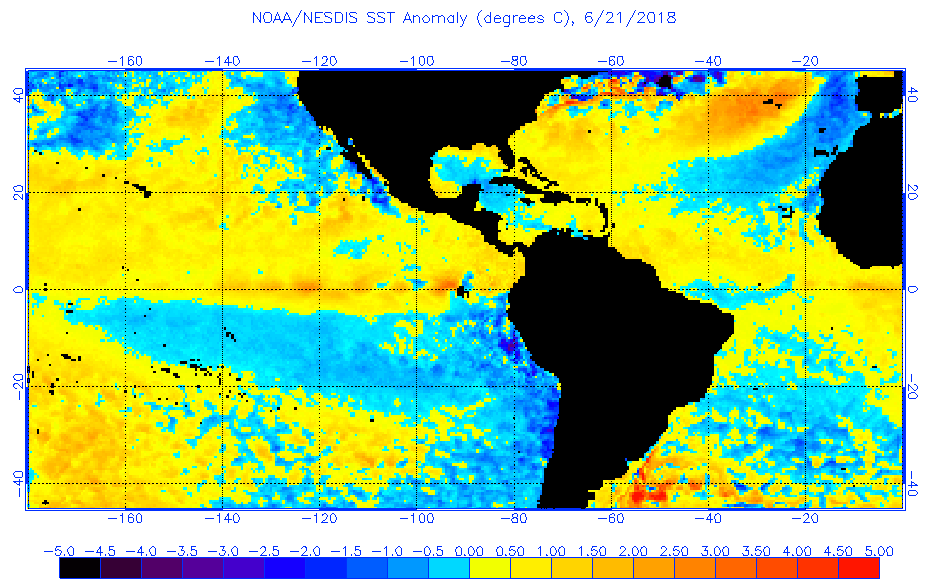
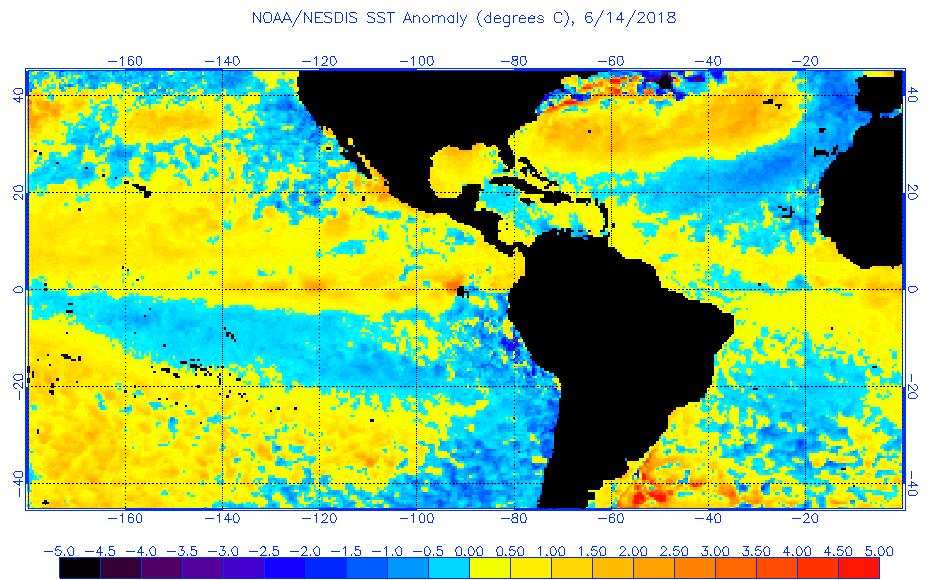
Pretty decent warming in the MDR to SW Atlantic. Just compare to 1 week ago (bottom image). We are still over 2 1/2 months until the peak of the Atlantic season.
0 likes
-
Kingarabian

- S2K Supporter
- Posts: 16379
- Joined: Sat Aug 08, 2009 3:06 am
- Location: Honolulu, Hawaii
Re: 2018 Indicators: SST's / MSLP / Sal / Steering / Shear / Instability (Graphic updates at first post)
KWT wrote:Alyono wrote:
which is why I went with 18 storms
Thats a massive and bold call!
I mean even for a neutral season in terms of ENSO with a decent Atlantic warmth in the deeper tropics and average subtropics, thats a fairly big total to reach, let alone with a season with a rubbish MDR profile and a developing El Nino profile. Equally I'm not buying those who are basically saying a shut-out season either, and besides it really does only need one well timed wave to make a season memorable.
With this set-up aloft, need to watch for those little nippers that race up the W.Atlantic from frontal systems, they seem pretty common in developing El nino seasons during July (Arthur 14, Claudette 15, Beryl 06, Alex 04, etc).
Despite what looks like a decent sub-tropics forecast, I'm still struggling to see us getting above 12 NS, UNLESS we do get one of those stringy LP chains which pump out 2-3 systems in a 7 day period.
Agree completely.
0 likes
RIP Kobe Bryant
-
tarheelprogrammer

- S2K Supporter
- Posts: 1793
- Joined: Mon Mar 28, 2016 9:25 pm
- Location: Raleigh, NC area (Garner, NC)
Re: 2018 Indicators: SST's / MSLP / Sal / Steering / Shear / Instability (Graphic updates at first post)
0 likes
My posts are not official forecasts. They are just my opinion and may or may not be backed by sound meteorological data. They are NOT endorsed by any professional institution or storm2k.org. For official information, please refer to the NHC and NWS products.
-
Eric Webb
Re: 2018 Indicators: SST's / MSLP / Sal / Steering / Shear / Instability (Graphic updates at first post)
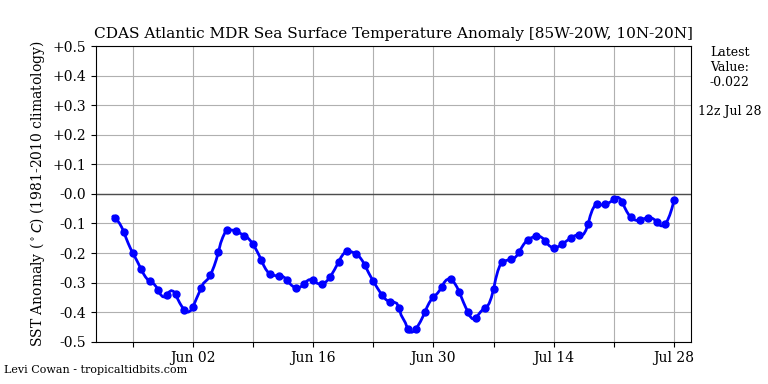
The warming of the MDR in the past week or so is attributable to an MJO pulse passing into Africa and the Indian Ocean, temporarily slowing the easterly trades, but it's hardly a drop in the bucket and won't mean much at the large-scale unless this forcing was sustained for several weeks in a row, which appears unlikely.
2 likes
Re: 2018 Indicators: SST's / MSLP / Sal / Steering / Shear / Instability (Graphic updates at first post)
KWT wrote:Alyono wrote:
which is why I went with 18 storms
Thats a massive and bold call!
I mean even for a neutral season in terms of ENSO with a decent Atlantic warmth in the deeper tropics and average subtropics, thats a fairly big total to reach, let alone with a season with a rubbish MDR profile and a developing El Nino profile. Equally I'm not buying those who are basically saying a shut-out season either, and besides it really does only need one well timed wave to make a season memorable.
With this set-up aloft, need to watch for those little nippers that race up the W.Atlantic from frontal systems, they seem pretty common in developing El nino seasons during July (Arthur 14, Claudette 15, Beryl 06, Alex 04, etc).
Despite what looks like a decent sub-tropics forecast, I'm still struggling to see us getting above 12 NS, UNLESS we do get one of those stringy LP chains which pump out 2-3 systems in a 7 day period.
remember, there have been quite a few seasons recently with 10 or more forming in the subtropics/GOM
speaking of that, I'd keep an eye off the East Coast toward the end of June and early July. Some type of troughing is likely there
1 likes


Re: 2018 Indicators: SST's / MSLP / Sal / Steering / Shear / Instability (Graphic updates at first post)
Eric Webb wrote:The warming of the MDR in the past week or so is attributable to an MJO pulse passing into Africa and the Indian Ocean, temporarily slowing the easterly trades, but it's hardly a drop in the bucket and won't mean much at the large-scale unless this forcing was sustained for several weeks in a row, which appears unlikely.
I don't have access to the EPS weeklies so they might offer different info, but a curious observation in the CFS (and the GEFS to the extent of its recent runs) is the area of anomalously weak low level flow south of the MDR for the next month (it disappears when models finally move upward motion away from Africa / the IO). You (or anyone else) might have insight into consequences of this anomaly. From my understanding of the Atlantic Equatorial Mode, warmer waters near the equator focus rainfall over the Gulf of Guinea vs. the Sahel, shunting the ITCZ further south. Thus a prolonged westerly burst as modeled may be detrimental to Atlantic hurricane activity (and even Pacific activity if it weakens the notably strong waves we've noticed so far) if it results in a sustained +AEM without actually warming the MDR. I don't have any understanding of ocean warming mechanics beyond weaker trades = warming directly below, so I could be totally incorrect. Sample CFS image attached:

1 likes
-
NotSparta

- Professional-Met

- Posts: 1677
- Age: 24
- Joined: Fri Aug 18, 2017 8:24 am
- Location: Naples, FL
- Contact:
Re: 2018 Indicators: SST's / MSLP / Sal / Steering / Shear / Instability (Graphic updates at first post)
Eric Webb wrote:The warming of the MDR in the past week or so is attributable to an MJO pulse passing into Africa and the Indian Ocean, temporarily slowing the easterly trades, but it's hardly a drop in the bucket and won't mean much at the large-scale unless this forcing was sustained for several weeks in a row, which appears unlikely.
[img]https://www.tropicaltidbits.com/analysis/ocean/mdrssta.png[img]
In addition, it is overdone by OSPO, which has bad SSTAs ( especially in the Atlantic), as its baseline is 1985-91 and thus has a +AMO bias.
2 likes
This post was probably an opinion of mine, and in no way is official. Please refer to http://www.hurricanes.gov for official tropical analysis and advisories.
My website, with lots of tropical wx graphics, including satellite and recon: http://cyclonicwx.com
My website, with lots of tropical wx graphics, including satellite and recon: http://cyclonicwx.com
Re: 2018 Indicators: SST's / MSLP / Sal / Steering / Shear / Instability (Graphic updates at first post)
NotSparta wrote:Eric Webb wrote:The warming of the MDR in the past week or so is attributable to an MJO pulse passing into Africa and the Indian Ocean, temporarily slowing the easterly trades, but it's hardly a drop in the bucket and won't mean much at the large-scale unless this forcing was sustained for several weeks in a row, which appears unlikely.
[img]https://www.tropicaltidbits.com/analysis/ocean/mdrssta.png[img]
In addition, it is overdone by OSPO, which has bad SSTAs ( especially in the Atlantic), as its baseline is 1985-91 and thus has a +AMO bias.
Wow, this is really good to know. I even checked for myself because it sounded absurd.
2 likes
-
NotSparta
- Professional-Met
- Posts: 1677
- Age: 24
- Joined: Fri Aug 18, 2017 8:24 am
- Location: Naples, FL
- Contact:
Re: 2018 Indicators: SST's / MSLP / Sal / Steering / Shear / Instability (Graphic updates at first post)
Oops, it's not 1985-91, but 1985-93. 
Still, this is fully in the -AMO era and would still cause the dataset to have a +AMO bias
https://coralreefwatch.noaa.gov/satellite/methodology/methodology.php#clim
Still, this is fully in the -AMO era and would still cause the dataset to have a +AMO bias
https://coralreefwatch.noaa.gov/satellite/methodology/methodology.php#clim
The monthly mean SST climatologies were then derived by averaging these satellite SSTs during the time period of 1985-1993. Observations from the years 1991 and 1992 were omitted due to the aerosol contamination from the eruption of Mt. Pinatubo.
2 likes
This post was probably an opinion of mine, and in no way is official. Please refer to http://www.hurricanes.gov for official tropical analysis and advisories.
My website, with lots of tropical wx graphics, including satellite and recon: http://cyclonicwx.com
My website, with lots of tropical wx graphics, including satellite and recon: http://cyclonicwx.com
-
Eric Webb
Re: 2018 Indicators: SST's / MSLP / Sal / Steering / Shear / Instability (Graphic updates at first post)
NotSparta wrote:Oops, it's not 1985-91, but 1985-93.
Still, this is fully in the -AMO era and would still cause the dataset to have a +AMO bias
https://coralreefwatch.noaa.gov/satellite/methodology/methodology.php#climThe monthly mean SST climatologies were then derived by averaging these satellite SSTs during the time period of 1985-1993. Observations from the years 1991 and 1992 were omitted due to the aerosol contamination from the eruption of Mt. Pinatubo.
I already wasn't a big fan of the NESDIS SST page but this is an even bigger turn off, can't say I'm surprised. It's pretty sad we actually still have -SSTAs in the tropical Atlantic in that product because that portion of the last -AMO era was cold-very cold in the MDR.
2 likes
-
NotSparta
- Professional-Met
- Posts: 1677
- Age: 24
- Joined: Fri Aug 18, 2017 8:24 am
- Location: Naples, FL
- Contact:
Re: 2018 Indicators: SST's / MSLP / Sal / Steering / Shear / Instability (Graphic updates at first post)
Eric Webb wrote:NotSparta wrote:Oops, it's not 1985-91, but 1985-93.
Still, this is fully in the -AMO era and would still cause the dataset to have a +AMO bias
https://coralreefwatch.noaa.gov/satellite/methodology/methodology.php#climThe monthly mean SST climatologies were then derived by averaging these satellite SSTs during the time period of 1985-1993. Observations from the years 1991 and 1992 were omitted due to the aerosol contamination from the eruption of Mt. Pinatubo.
I already wasn't a big fan of the NESDIS SST page but this is an even bigger turn off, can't say I'm surprised. It's pretty sad we actually still have -SSTAs in the tropical Atlantic in that product because that portion of the last -AMO era was cold-very cold in the MDR.
Not to mention that it's only 9 years recorded. That's tiny.
0 likes
This post was probably an opinion of mine, and in no way is official. Please refer to http://www.hurricanes.gov for official tropical analysis and advisories.
My website, with lots of tropical wx graphics, including satellite and recon: http://cyclonicwx.com
My website, with lots of tropical wx graphics, including satellite and recon: http://cyclonicwx.com
-
OuterBanker
- S2K Supporter
- Posts: 1761
- Joined: Wed Feb 26, 2003 10:53 am
- Location: Nags Head, NC
- Contact:
Re: 2018 Indicators: SST's / MSLP / Sal / Steering / Shear / Instability (Graphic updates at first post)
Periodically I check the water temperature at the Duck Research Pier (Army Corp of Engineers). This morning I couldn’t believe the reading. I have never seen the temperature this high at any time much less late June. The northern Outer Banks is unique because the Labrador current lies just below the surface. We have had many summers in which there has been a strong westerly wind which causes the Labrador current to surface (upwell) while the Gulf Stream waters are blown off shore. In other words the temps in July and August can be in the 90’s while the water temps can be in the upper 50’s to low 60’s. You bake and can’t swim. Recently though the temps have been in the 90’s while the H2O temps have been the 80’s (perfect). Today’s reading is a whopping 86. The dominant winds are light and variable which allows the Gulf Stream to dominate, but I can’t ever remember being this warm this far north (36”11”). I’m sure it’s just a temporary anomaly. But, on the other hand it has raised my curiosity and concern.
http://www.frf.usace.army.mil/
http://www.frf.usace.army.mil/
2 likes
-
MississippiWx
- S2K Supporter
- Posts: 1720
- Joined: Sat Aug 14, 2010 1:44 pm
- Location: Hattiesburg, Mississippi
Re: 2018 Indicators: SST's / MSLP / Sal / Steering / Shear / Instability (Graphic updates at first post)
OuterBanker wrote:Periodically I check the water temperature at the Duck Research Pier (Army Corp of Engineers). This morning I couldn’t believe the reading. I have never seen the temperature this high at any time much less late June. The northern Outer Banks is unique because the Labrador current lies just below the surface. We have had many summers in which there has been a strong westerly wind which causes the Labrador current to surface (upwell) while the Gulf Stream waters are blown off shore. In other words the temps in July and August can be in the 90’s while the water temps can be in the upper 50’s to low 60’s. You bake and can’t swim. Recently though the temps have been in the 90’s while the H2O temps have been the 80’s (perfect). Today’s reading is a whopping 86. The dominant winds are light and variable which allows the Gulf Stream to dominate, but I can’t ever remember being this warm this far north (36”11”). I’m sure it’s just a temporary anomaly. But, on the other hand it has raised my curiosity and concern.
http://www.frf.usace.army.mil/
How old are you? How many -AMO's have you experienced? We haven't had a -AMO like this in quite some time.
0 likes
This post is not an official forecast and should not be used as such. It is just the opinion of MississippiWx and may or may not be backed by sound meteorological data. It is not endorsed by any professional institution including storm2k.org. For Official Information please refer to the NHC and NWS products.
-
OuterBanker
- S2K Supporter
- Posts: 1761
- Joined: Wed Feb 26, 2003 10:53 am
- Location: Nags Head, NC
- Contact:
Re: 2018 Indicators: SST's / MSLP / Sal / Steering / Shear / Instability (Graphic updates at first post)
MississippiWx wrote:OuterBanker wrote:Periodically I check the water temperature at the Duck Research Pier (Army Corp of Engineers). This morning I couldn’t believe the reading. I have never seen the temperature this high at any time much less late June. The northern Outer Banks is unique because the Labrador current lies just below the surface. We have had many summers in which there has been a strong westerly wind which causes the Labrador current to surface (upwell) while the Gulf Stream waters are blown off shore. In other words the temps in July and August can be in the 90’s while the water temps can be in the upper 50’s to low 60’s. You bake and can’t swim. Recently though the temps have been in the 90’s while the H2O temps have been the 80’s (perfect). Today’s reading is a whopping 86. The dominant winds are light and variable which allows the Gulf Stream to dominate, but I can’t ever remember being this warm this far north (36”11”). I’m sure it’s just a temporary anomaly. But, on the other hand it has raised my curiosity and concern.
http://www.frf.usace.army.mil/
How old are you? How many -AMO's have you experienced? We haven't had a -AMO like this in quite some time.
Harry Truman was president when I was born and I have a red white and blue health card.
2 likes
-
Kingarabian
- S2K Supporter
- Posts: 16379
- Joined: Sat Aug 08, 2009 3:06 am
- Location: Honolulu, Hawaii
Re: 2018 Indicators: SST's / MSLP / Sal / Steering / Shear / Instability (Graphic updates at first post)
With such a massive sinking anomaly presence over the Atlantic and the GOM, I wouldn't call this a Modoki El Nino. The current SST configuration may resemble one (although that's really debatable IMO), but atmospherically it doesn't.
https://twitter.com/BenNollWeather/status/1009748270392885248
https://twitter.com/BenNollWeather/status/1009748270392885248
1 likes
RIP Kobe Bryant
Who is online
Users browsing this forum: hurricanes1234 and 77 guests