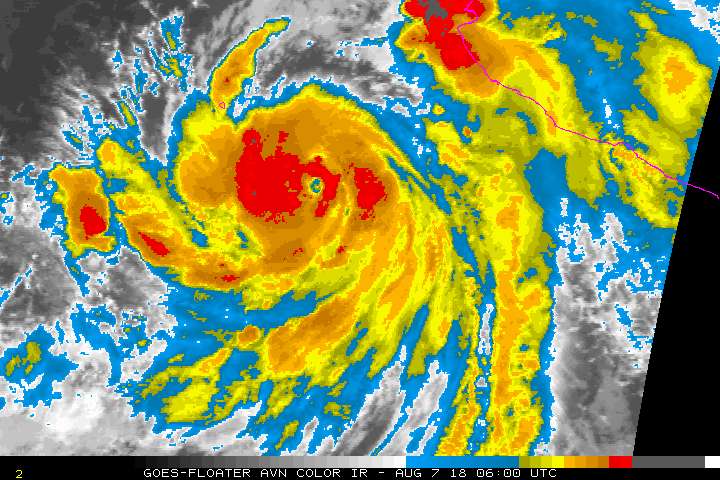
EPAC: JOHN - Post-Tropical
Moderator: S2k Moderators
-
- Category 1
- Posts: 252
- Joined: Fri May 11, 2018 9:20 pm
Re: EPAC: JOHN - Hurricane
low level structure looked pretty good.
https://imgur.com/hyxmUBg
https://imgur.com/cwUUkQL
92H Deep low- level cloud suggests a precursor to future eyewall formation.
https://imgur.com/hyxmUBg
https://imgur.com/cwUUkQL
92H Deep low- level cloud suggests a precursor to future eyewall formation.
2 likes
Re: EPAC: JOHN - Hurricane
I don't think it has a good structure but as of right now its okay. Its mainly too broad. A deep convection band started wrapping into the core from the east so we'll see how that goes. The convection right next to it on the south-right really is pitiful. Ileana must be robbing John's head (north and east side) of energy. I'm eager to see how Ileana gets wrapped into John and what that ultimately does. Sometimes when TCs in this spot just suddenly degrade instead of explode I giggle. It strikes me as humorous as everyone is waiting for angry John to pop his lid and instead appears ragged and reefed with shallow convection.
1 likes
- cycloneye
- Admin
- Posts: 142744
- Age: 68
- Joined: Thu Oct 10, 2002 10:54 am
- Location: San Juan, Puerto Rico
Re: EPAC: JOHN - Hurricane
Hurricane John Discussion Number 6
NWS National Hurricane Center Miami FL EP122018
900 PM MDT Mon Aug 06 2018
John's satellite presentation has not changed significantly during
the past few hours. The tops warmed up significantly earlier, but a
new convective curved band is developing around the eye as we
speak. T-numbers from TAFB and SAB are 4.0 on the Dvorak scale and
on this basis, the initial intensity is keep at 65 kt in this
advisory. The environment is quite favorable for intensification,
and although the intensity guidance is not as aggressive as earlier,
it still shows a strengthening hurricane, and this is reflected in
the NHC forecast. Beyond 3 days, John should be moving over cooler
waters, and rapid weakening should then begin. John is very likely
to become a remnant low by day 5 or perhaps earlier.
John continues to move toward the northwest or 315 degrees at 7 kt,
steered by the flow around a strong subtropical ridge extending
from the western United States westward across the Pacific. Since
the steering pattern is well established, track models are tightly
clustered increasing the confidence in the forecast. NHC keeps the
hurricane in the middle of the guidance envelope very close to
the HCCA corrected consensus and is not very different from the
previous one.
The core of John with its strongest winds is forecast to remain well
off the Baja California Peninsula, but having said that, any
deviation to the right of the track or an unexpected increase in the
area of tropical force winds, could bring tropical-storm-force
winds to portions of the west coast of the peninsula. Therefore,
interests in the southern portion of the Baja California Peninsula
should monitor the progress of this hurricane.
FORECAST POSITIONS AND MAX WINDS
INIT 07/0300Z 16.7N 108.6W 65 KT 75 MPH
12H 07/1200Z 17.4N 109.3W 80 KT 90 MPH
24H 08/0000Z 18.8N 110.4W 95 KT 110 MPH
36H 08/1200Z 20.4N 112.0W 105 KT 120 MPH
48H 09/0000Z 22.3N 114.0W 100 KT 115 MPH
72H 10/0000Z 25.5N 118.5W 70 KT 80 MPH
96H 11/0000Z 27.5N 122.5W 45 KT 50 MPH
120H 12/0000Z 27.5N 126.0W 30 KT 35 MPH...POST-TROP/REMNT LOW
$$
Forecaster Avila
0 likes
Visit the Caribbean-Central America Weather Thread where you can find at first post web cams,radars
and observations from Caribbean basin members Click Here
- Yellow Evan
- Professional-Met
- Posts: 16050
- Age: 26
- Joined: Fri Jul 15, 2011 12:48 pm
- Location: Henderson, Nevada/Honolulu, HI
- Contact:
Re: EPAC: JOHN - Hurricane
We're getting somewhere here. Going for the wrap around with eye warming.
3 likes
- Yellow Evan
- Professional-Met
- Posts: 16050
- Age: 26
- Joined: Fri Jul 15, 2011 12:48 pm
- Location: Henderson, Nevada/Honolulu, HI
- Contact:
- Yellow Evan
- Professional-Met
- Posts: 16050
- Age: 26
- Joined: Fri Jul 15, 2011 12:48 pm
- Location: Henderson, Nevada/Honolulu, HI
- Contact:
Re: EPAC: JOHN - Hurricane
* EAST PACIFIC 2018 SHIPS INTENSITY FORECAST *
* IR SAT DATA AVAILABLE, OHC AVAILABLE *
* JOHN EP122018 08/07/18 06 UTC *
TIME (HR) 0 6 12 18 24 36 48 60 72 84 96 108 120
V (KT) NO LAND 75 83 92 96 102 108 105 94 82 71 57 47 38
V (KT) LAND 75 83 92 96 102 108 105 94 82 71 57 47 38
V (KT) LGEM 75 82 89 94 96 91 78 60 48 38 32 27 24
Storm Type TROP TROP TROP TROP TROP TROP TROP TROP TROP TROP TROP TROP TROP
SHEAR (KT) 7 8 9 9 14 7 2 3 2 4 14 14 19
SHEAR ADJ (KT) 3 5 4 3 2 0 2 -3 3 -3 -2 0 -6
SHEAR DIR 47 36 21 351 328 272 148 178 170 206 215 219 197
SST (C) 29.9 29.9 30.0 29.7 28.9 27.4 24.6 22.6 21.3 21.0 20.6 20.4 21.0
POT. INT. (KT) 163 163 165 162 154 139 110 89 75 71 66 64 71
200 MB T (C) -52.3 -52.3 -51.7 -51.3 -51.5 -51.1 -50.9 -51.0 -50.6 -51.0 -51.2 -51.7 -51.9
200 MB VXT (C) 0.3 0.4 0.3 0.4 0.6 0.8 1.3 1.1 1.0 1.3 0.9 0.8 0.9
TH_E DEV (C) 7 6 7 7 7 6 4 1 0 0 0 0 0
700-500 MB RH 76 75 77 76 76 74 73 73 69 69 62 61 59
MODEL VTX (KT) 24 30 33 30 34 37 36 32 29 27 23 22 21
850 MB ENV VOR 9 14 39 46 37 59 55 78 40 47 47 53 50
200 MB DIV 116 131 151 109 58 33 47 19 -9 -6 8 -2 2
700-850 TADV -7 -12 -3 3 19 13 -7 0 -16 -13 -11 2 3
LAND (KM) 491 493 498 432 366 344 324 392 494 648 753 863 1023
LAT (DEG N) 17.0 17.7 18.3 19.1 19.8 21.5 23.4 25.0 26.3 27.3 28.0 28.0 27.4
LONG(DEG W) 108.9 109.4 109.9 110.6 111.2 113.0 115.1 117.4 119.7 121.7 123.4 125.1 127.0
STM SPEED (KT) 8 8 9 10 11 13 13 13 11 10 7 9 9
HEAT CONTENT 26 20 17 15 11 4 0 0 0 0 0 0 0
FORECAST TRACK FROM OFCI INITIAL HEADING/SPEED (DEG/KT):325/ 8 CX,CY: -4/ 7
T-12 MAX WIND: 60 PRESSURE OF STEERING LEVEL (MB): 584 (MEAN=584)
GOES IR BRIGHTNESS TEMP. STD DEV. 50-200 KM RAD: 6.1 (MEAN=14.5)
% GOES IR PIXELS WITH T < -20 C 50-200 KM RAD: 100.0 (MEAN=65.0)
PRELIM RI PROB (DV .GE. 55 KT IN 48 HR): 21.3
INDIVIDUAL CONTRIBUTIONS TO INTENSITY CHANGE
6 12 18 24 36 48 60 72 84 96 108 120
----------------------------------------------------------
SAMPLE MEAN CHANGE 0. 0. 1. 1. 1. 1. 1. 0. -1. -1. -2. -3.
SST POTENTIAL 1. 2. 3. 4. 4. 1. -4. -10. -15. -20. -23. -25.
VERTICAL SHEAR MAG 0. 0. 0. -1. 0. 2. 4. 6. 7. 7. 6. 4.
VERTICAL SHEAR ADJ 0. 0. 0. 0. -1. 0. 0. 0. 0. 0. 0. 0.
VERTICAL SHEAR DIR 0. 0. 0. 0. 0. 0. -1. -1. -1. 0. 2. 2.
PERSISTENCE 4. 5. 6. 6. 4. 3. 1. 0. 0. 0. -1. -1.
200/250 MB TEMP. 0. 0. 0. -1. -1. -1. -1. 0. 1. 1. 1. 2.
THETA_E EXCESS 0. 0. 0. 0. 0. 0. -2. -4. -5. -7. -9. -10.
700-500 MB RH 0. 0. 1. 1. 1. 2. 2. 3. 3. 3. 3. 3.
MODEL VTX TENDENCY 1. 5. 5. 9. 12. 10. 9. 6. 3. -2. -3. -5.
850 MB ENV VORTICITY 0. 0. 0. 0. 0. 0. -1. -1. -1. -1. -1. -1.
200 MB DIVERGENCE 0. 1. 2. 3. 2. 2. 2. 2. 1. 1. 1. 0.
850-700 T ADVEC 0. 0. 0. 0. 0. 0. 0. 0. 0. 0. 0. 0.
ZONAL STORM MOTION 0. 0. 0. -1. -1. -1. -1. -1. -1. -1. -1. -1.
STEERING LEVEL PRES 0. 0. 0. 0. 0. 0. 0. 0. 0. 0. 0. 0.
DAYS FROM CLIM. PEAK 0. 0. 0. 0. 0. 0. 0. 1. 1. 1. 1. 1.
GOES PREDICTORS 1. 2. 3. 4. 4. 4. 3. 3. 2. 2. 2. 2.
OCEAN HEAT CONTENT 0. 0. 0. 0. 0. 0. 0. 0. 0. 0. 0. 0.
RI POTENTIAL 0. 1. 2. 3. 6. 8. 6. 3. 1. -1. -3. -3.
----------------------------------------------------------
TOTAL CHANGE 8. 17. 21. 27. 33. 30. 19. 7. -4. -18. -28. -37.
CURRENT MAX WIND (KT): 75. LAT, LON: 17.0 108.9
** 2018 E. Pacific RI INDEX EP122018 JOHN 08/07/18 06 UTC **
(SHIPS-RII PREDICTOR TABLE for 30 KT OR MORE MAXIMUM WIND INCREASE IN NEXT 24-h)
Predictor Value RI Predictor Range Scaled Value(0-1) % Contribution
POT = MPI-VMAX (KT) : 81.3 40.5 to 149.3 0.37 4.4
12 HR PERSISTENCE (KT) : 15.0 -22.0 to 44.0 0.56 7.8
850-200 MB SHEAR (KT) : 9.5 19.6 to 1.4 0.55 6.1
HEAT CONTENT (KJ/CM2) : 17.8 1.8 to 106.7 0.15 1.3
D200 (10**7s-1) : 113.0 -33.0 to 156.2 0.77 7.6
STD DEV OF IR BR TEMP : 6.1 37.8 to 2.1 0.89 7.1
MAXIMUM WIND (KT) : 75.0 22.5 to 132.0 0.76 5.9
BL DRY-AIR FLUX (W/M2) : 89.8 721.6 to -82.5 0.79 -5.3
%area of TPW <45 mm upshear : 0.0 62.3 to 0.0 1.00 0.8
2nd PC OF IR BR TEMP : 0.1 2.2 to -1.9 0.51 0.6
SHIPS Prob RI for 20kt/ 12hr RI threshold= 43% is 7.1 times climatological mean ( 6.1%)
SHIPS Prob RI for 25kt/ 24hr RI threshold= 56% is 4.5 times climatological mean (12.5%)
SHIPS Prob RI for 30kt/ 24hr RI threshold= 36% is 4.3 times climatological mean ( 8.4%)
SHIPS Prob RI for 35kt/ 24hr RI threshold= 28% is 4.7 times climatological mean ( 6.0%)
SHIPS Prob RI for 40kt/ 24hr RI threshold= 15% is 3.8 times climatological mean ( 4.0%)
SHIPS Prob RI for 45kt/ 36hr RI threshold= 20% is 3.1 times climatological mean ( 6.5%)
SHIPS Prob RI for 55kt/ 48hr RI threshold= 17% is 2.9 times climatological mean ( 5.9%)
SHIPS Prob RI for 65kt/ 72hr RI threshold= 0% is 0.0 times climatological mean ( 4.8%)
Matrix of RI probabilities
------------------------------------------------------------------------------
RI (kt / h) | 20/12 | 25/24 | 30/24 | 35/24 | 40/24 | 45/36 | 55/48 |65/72
------------------------------------------------------------------------------
SHIPS-RII: 43.2% 55.7% 36.3% 28.3% 15.2% 20.0% 16.9% 0.0%
Logistic: 21.8% 26.7% 13.3% 7.5% 1.3% 3.5% 0.4% 0.1%
Bayesian: 37.9% 34.9% 40.7% 26.5% 0.9% 0.7% 0.0% 0.0%
Consensus: 34.3% 39.1% 30.1% 20.8% 5.8% 8.1% 5.8% 0.0%
DTOPS: 43.0% 84.0% 70.0% 46.0% 51.0% 14.0% 0.0% 0.0%
## ANNULAR HURRICANE INDEX (AHI) EP122018 JOHN 08/07/18 06 UTC ##
## STORM NOT ANNULAR, SCREENING STEP FAILED, NPASS=4 NFAIL=3 ##
## AHI= 0 (AHI OF 100 IS BEST FIT TO ANN. STRUC., 1 IS MARGINAL, 0 IS NOT ANNULAR) ##
CONTRIBUTIONS TO ANNULAR INDEX
0 likes
- mrbagyo
- Category 5
- Posts: 3674
- Age: 32
- Joined: Thu Apr 12, 2012 9:18 am
- Location: 14.13N 120.98E
- Contact:
Re: EPAC: JOHN - Hurricane
Eye has now appeared on enhanced IR .
1 likes
The posts in this forum are NOT official forecast and should not be used as such. They are just the opinion of the poster and may or may not be backed by sound meteorological data. They are NOT endorsed by any professional institution or storm2k.org. For official information, please refer to RSMC, NHC and NWS products.
- Kingarabian
- S2K Supporter
- Posts: 15762
- Joined: Sat Aug 08, 2009 3:06 am
- Location: Honolulu, Hawaii
Re: EPAC: JOHN - Hurricane
mrbagyo wrote:Eye has now appeared on enhanced IR .
[img]https://imageshack.com/a/img923/92/1dBHrU.gif[img]
WPACish system.
0 likes
RIP Kobe Bryant
- Kingarabian
- S2K Supporter
- Posts: 15762
- Joined: Sat Aug 08, 2009 3:06 am
- Location: Honolulu, Hawaii
Re: EPAC: JOHN - Hurricane
Twisted-core wrote:low level structure looked pretty good.
[img]https://i.imgur.com/hyxmUBg.jpg[img]
https://imgur.com/hyxmUBg
[img]https://i.imgur.com/cwUUkQL.jpg[img]
https://imgur.com/cwUUkQL
92H Deep low- level cloud suggests a precursor to future eyewall formation.
You were right on the money here.
Research has shown that a solid cyan ring on 37ghz MW imagery is a precursor for RI.
1 likes
RIP Kobe Bryant
-
- Category 1
- Posts: 263
- Joined: Sun Jul 09, 2017 10:50 pm
Re: EPAC: JOHN - Hurricane
Kingarabian wrote:Twisted-core wrote:low level structure looked pretty good.
[img]https://i.imgur.com/hyxmUBg.jpg[img]
https://imgur.com/hyxmUBg
[img]https://i.imgur.com/cwUUkQL.jpg[img]
https://imgur.com/cwUUkQL
92H Deep low- level cloud suggests a precursor to future eyewall formation.
You were right on the money here.
Research has shown that a solid cyan ring on 37ghz MW imagery is a precursor for RI.
Now that Ileana is not really much of a factor and likely won’t impinge on this storm anymore, everything is in place for John to rapidly intensify and it looks like it may have already begun this process.
Never mind. Why are the cloud tops warming so much?
Last edited by storminabox on Tue Aug 07, 2018 5:02 am, edited 1 time in total.
1 likes
- cycloneye
- Admin
- Posts: 142744
- Age: 68
- Joined: Thu Oct 10, 2002 10:54 am
- Location: San Juan, Puerto Rico
Re: EPAC: JOHN - Hurricane
Hurricane John Discussion Number 7
NWS National Hurricane Center Miami FL EP122018
300 AM MDT Tue Aug 07 2018
Satellite images indicate that John has resumed its intensification
trend, with a ragged eye showing up in the night-visible and other
channels. Dvorak estimates are between 70-90 kt, so 80 kt is used
as the initial wind speed. John has another day or so to intensify
in a low-shear, warm-water environment before it rapidly crosses
into cooler waters. The hurricane has been intensifying at a rate
of about 30 kt/24 hours, so this trend was heavily weighted in the
latest forecast given the continuation of the conducive environment.
All of the guidance show a pretty steep drop in intensity as the
hurricane quickly enters cool waters, with rapid weakening likely.
The latest forecast is close to the previous one, but shows John
becoming post-tropical by day 4 when it will be over 21C waters.
John continues to move northwestward, now at about 8 kt. The
hurricane should move in that general direction but faster over the
next 3 days under the influence of a strengthening subtropical
ridge. As John weakens, the cyclone is forecast to turn westward,
steered more by the low-level ridge. Guidance remains tightly
clustered and no significant change was made to the previous
forecast track.
The dangerous core of John is forecast to remain well offshore of
the Baja California Peninsula. However, an eastward shift of the
forecast track or an unexpected increase in the size of the outer
wind field of the hurricane could bring tropical-storm-force winds
to portions of the west coast of the peninsula. Therefore, interests
in the southern portion of the Baja California Peninsula should
monitor the progress of this hurricane.
FORECAST POSITIONS AND MAX WINDS
INIT 07/0900Z 17.3N 109.1W 80 KT 90 MPH
12H 07/1800Z 18.2N 109.9W 90 KT 105 MPH
24H 08/0600Z 19.7N 111.2W 105 KT 120 MPH
36H 08/1800Z 21.3N 112.8W 105 KT 120 MPH
48H 09/0600Z 22.9N 114.9W 90 KT 105 MPH
72H 10/0600Z 25.8N 119.3W 55 KT 65 MPH
96H 11/0600Z 27.2N 123.1W 40 KT 45 MPH...POST-TROPICAL
120H 12/0600Z 27.0N 126.5W 30 KT 35 MPH...POST-TROP/REMNT LOW
$$
Forecaster Blake
0 likes
Visit the Caribbean-Central America Weather Thread where you can find at first post web cams,radars
and observations from Caribbean basin members Click Here
- cycloneye
- Admin
- Posts: 142744
- Age: 68
- Joined: Thu Oct 10, 2002 10:54 am
- Location: San Juan, Puerto Rico
Re: EPAC: JOHN - Hurricane
Up to 90 kts.
EP, 12, 2018080712, , BEST, 0, 175N, 1095W, 90, 980, HU
1 likes
Visit the Caribbean-Central America Weather Thread where you can find at first post web cams,radars
and observations from Caribbean basin members Click Here
- cycloneye
- Admin
- Posts: 142744
- Age: 68
- Joined: Thu Oct 10, 2002 10:54 am
- Location: San Juan, Puerto Rico
Re: EPAC: JOHN - Hurricane
Hurricane John Discussion Number 8
NWS National Hurricane Center Miami FL EP122018
900 AM MDT Tue Aug 07 2018
Visible and infrared satellite images have continued to show the
ragged eye of John this morning, but the surrounding convective
cloud tops have become more symmetric and cooled since the previous
advisory. The latest Dvorak satellite intensity estimates from
TAFB and SAB were T5.0/90 kt, which support increasing the initial
wind speed to that value. John has about another 24 hours over
warm water in which to intensify, and the NHC intensity forecast
calls for John to attain major hurricane strength later today or
tonight. After that time, decreasing SSTs and a more stable
environment should lead to steady or rapid weakening, and John is
expected to become a post-tropical cyclone by day 4. The NHC
intensity forecast is near the SHIPS and HCCA models for the first
12 to 24 hours, and then is between the aforementioned models and
the intensity consensus thereafter.
John is moving northwestward or 320/8 kt. The track guidance is in
good agreement on taking the hurricane northwestward around the
western portion of a mid-level ridge centered over northern Mexico.
Once John weakens and becomes a vertically shallow system it should
turn westward in the low-level flow. The NHC track forecast is
near the middle of the tightly clustered guidance envelope.
The dangerous core of John is forecast to remain well offshore of
the Baja California Peninsula. However, an eastward shift of the
forecast track or an unexpected increase in the size of the outer
wind field of the hurricane could bring tropical-storm-force winds
to portions of the west coast of the peninsula. Therefore, interests
in the southern portion of the Baja California Peninsula should
monitor the progress of this hurricane.
FORECAST POSITIONS AND MAX WINDS
INIT 07/1500Z 17.9N 109.8W 90 KT 105 MPH
12H 08/0000Z 18.9N 110.7W 100 KT 115 MPH
24H 08/1200Z 20.5N 112.2W 105 KT 120 MPH
36H 09/0000Z 22.0N 114.0W 90 KT 105 MPH
48H 09/1200Z 23.5N 116.1W 80 KT 90 MPH
72H 10/1200Z 26.2N 120.2W 50 KT 60 MPH
96H 11/1200Z 27.0N 123.8W 40 KT 45 MPH...POST-TROPICAL
120H 12/1200Z 27.0N 126.8W 30 KT 35 MPH...POST-TROP/REMNT LOW
$$
Forecaster Brown
0 likes
Visit the Caribbean-Central America Weather Thread where you can find at first post web cams,radars
and observations from Caribbean basin members Click Here
-
- Category 5
- Posts: 2905
- Joined: Sat Jul 28, 2012 6:19 pm
- Location: Trinidad and Tobago
Re: EPAC: JOHN - Hurricane
It's official! John eats Ileana for breakfast while Kristy watches in dismay ... meanwhile, Hector laughs more than 1,000 miles away!
4 likes
PLEASE NOTE: With the exception of information from weather agencies that I may copy and paste here, my posts will NEVER be official, since I am NOT a meteorologist. They are solely my amateur opinion, and may or may not be accurate. Therefore, please DO NOT use them as official details, particularly when making important decisions. Thank you.
- NotSparta
- Professional-Met
- Posts: 1668
- Age: 23
- Joined: Fri Aug 18, 2017 8:24 am
- Location: Naples, FL
- Contact:
Re: EPAC: JOHN - Hurricane
2 likes
This post was probably an opinion of mine, and in no way is official. Please refer to http://www.hurricanes.gov for official tropical analysis and advisories.
My website, with lots of tropical wx graphics, including satellite and recon: http://cyclonicwx.com
- AnnularCane
- S2K Supporter
- Posts: 2817
- Joined: Thu Jun 08, 2006 9:18 am
- Location: Wytheville, VA
Re: EPAC: JOHN - Hurricane
hurricanes1234 wrote:It's official! John eats Ileana for breakfast while Kristy watches in dismay ... meanwhile, Hector laughs more than 1,000 miles away!
John: "GET IN MY BELLY!"
Poor Ileana. What a grisly fate!
7 likes
- Yellow Evan
- Professional-Met
- Posts: 16050
- Age: 26
- Joined: Fri Jul 15, 2011 12:48 pm
- Location: Henderson, Nevada/Honolulu, HI
- Contact:
Re: EPAC: JOHN - Hurricane
http://smn1.conagua.gob.mx/emas/txt/CO02_10M.TXT - Soccoro Island observations
0 likes
- Yellow Evan
- Professional-Met
- Posts: 16050
- Age: 26
- Joined: Fri Jul 15, 2011 12:48 pm
- Location: Henderson, Nevada/Honolulu, HI
- Contact:
- Yellow Evan
- Professional-Met
- Posts: 16050
- Age: 26
- Joined: Fri Jul 15, 2011 12:48 pm
- Location: Henderson, Nevada/Honolulu, HI
- Contact:
Re: EPAC: JOHN - Hurricane
* EAST PACIFIC 2018 SHIPS INTENSITY FORECAST *
* IR SAT DATA AVAILABLE, OHC AVAILABLE *
* JOHN EP122018 08/07/18 18 UTC *
TIME (HR) 0 6 12 18 24 36 48 60 72 84 96 108 120
V (KT) NO LAND 90 95 98 100 97 94 82 71 63 53 47 40 34
V (KT) LAND 90 95 98 100 97 94 82 71 63 53 47 40 34
V (KT) LGEM 90 95 97 95 91 78 64 52 41 35 31 28 24
Storm Type TROP TROP TROP TROP TROP TROP TROP TROP TROP TROP TROP TROP TROP
SHEAR (KT) 14 11 12 9 6 4 2 1 3 8 11 11 5
SHEAR ADJ (KT) 3 2 1 0 0 0 -2 -1 -5 -4 -4 -5 -3
SHEAR DIR 8 10 354 328 311 37 22 326 246 230 236 178 198
SST (C) 30.0 29.8 29.1 28.0 27.3 25.5 23.6 21.3 21.7 20.6 20.7 20.0 20.1
POT. INT. (KT) 165 163 156 145 137 119 99 75 78 66 67 59 60
200 MB T (C) -52.3 -51.7 -51.9 -51.7 -51.4 -51.1 -51.0 -50.8 -51.1 -51.1 -51.4 -51.7 -52.0
200 MB VXT (C) 0.5 0.4 0.3 0.5 0.7 1.2 1.1 1.2 1.5 1.1 1.1 0.9 0.8
TH_E DEV (C) 7 7 7 6 6 5 3 1 0 0 0 0 0
700-500 MB RH 76 75 73 74 73 72 72 70 70 65 63 58 55
MODEL VTX (KT) 29 30 32 34 32 33 30 27 25 22 21 20 18
850 MB ENV VOR 32 45 48 45 44 44 63 51 62 37 38 30 35
200 MB DIV 136 111 53 36 39 0 35 -3 -20 0 -3 -6 -10
700-850 TADV -5 7 17 11 8 -8 7 -5 0 -5 0 0 4
LAND (KM) 511 436 378 349 358 361 425 481 622 755 914 1006 1071
LAT (DEG N) 18.3 19.1 19.8 20.6 21.4 22.8 24.4 25.8 26.8 27.2 27.0 27.1 27.2
LONG(DEG W) 110.1 110.8 111.5 112.3 113.1 115.1 117.2 119.3 121.2 123.0 124.7 126.2 127.5
STM SPEED (KT) 10 10 10 11 11 12 12 11 9 8 7 6 5
HEAT CONTENT 16 14 11 7 5 0 0 0 0 0 0 0 0
FORECAST TRACK FROM OFCI INITIAL HEADING/SPEED (DEG/KT):320/ 9 CX,CY: -5/ 7
T-12 MAX WIND: 75 PRESSURE OF STEERING LEVEL (MB): 577 (MEAN=584)
GOES IR BRIGHTNESS TEMP. STD DEV. 50-200 KM RAD: 10.2 (MEAN=14.5)
% GOES IR PIXELS WITH T < -20 C 50-200 KM RAD: 97.0 (MEAN=65.0)
PRELIM RI PROB (DV .GE. 55 KT IN 48 HR): 0.0
INDIVIDUAL CONTRIBUTIONS TO INTENSITY CHANGE
6 12 18 24 36 48 60 72 84 96 108 120
----------------------------------------------------------
SAMPLE MEAN CHANGE 0. 0. 1. 1. 1. 1. 1. 0. -1. -1. -2. -3.
SST POTENTIAL 1. 2. 2. 2. -1. -8. -17. -25. -32. -37. -41. -43.
VERTICAL SHEAR MAG -1. -3. -3. -3. -1. 2. 5. 7. 8. 8. 8. 8.
VERTICAL SHEAR ADJ 0. 0. 0. 0. 0. 0. 0. 0. 0. 0. -1. -1.
VERTICAL SHEAR DIR 0. 0. 0. -1. -1. -3. -4. -2. 0. 2. 2. 2.
PERSISTENCE 4. 5. 6. 5. 4. 2. 1. 0. -1. -1. -2. -2.
200/250 MB TEMP. 0. 0. 0. -1. -1. -1. 0. 1. 2. 2. 2. 3.
THETA_E EXCESS 0. 0. 0. 0. 0. -1. -2. -4. -6. -8. -9. -11.
700-500 MB RH 0. 0. 0. 1. 1. 2. 2. 2. 2. 2. 2. 2.
MODEL VTX TENDENCY 0. 2. 4. 3. 4. 1. -1. -5. -10. -12. -13. -15.
850 MB ENV VORTICITY 0. 0. 0. 0. 0. 0. -1. -1. -1. -1. -1. -1.
200 MB DIVERGENCE 0. 1. 1. 1. 1. 1. 0. 0. -1. -1. -2. -2.
850-700 T ADVEC 0. 0. 0. 0. 0. 0. 0. 1. 1. 1. 1. 1.
ZONAL STORM MOTION 0. 0. 0. 0. -1. -1. -1. -1. -1. -1. -1. -1.
STEERING LEVEL PRES 0. 0. 0. 0. 0. 0. 0. 0. 0. 0. 0. 0.
DAYS FROM CLIM. PEAK 0. 0. 0. 0. 0. 0. 0. 1. 1. 1. 1. 1.
GOES PREDICTORS 0. 0. 0. 0. 1. 2. 2. 2. 1. 2. 2. 3.
OCEAN HEAT CONTENT 0. 0. 0. 0. 0. 0. -1. 0. 0. 0. 0. 0.
RI POTENTIAL 0. 0. -1. -1. -2. -3. -3. -2. 0. 1. 2. 3.
----------------------------------------------------------
TOTAL CHANGE 5. 8. 10. 7. 4. -8. -19. -27. -37. -43. -50. -56.
CURRENT MAX WIND (KT): 90. LAT, LON: 18.3 110.1
** 2018 E. Pacific RI INDEX EP122018 JOHN 08/07/18 18 UTC **
(SHIPS-RII PREDICTOR TABLE for 30 KT OR MORE MAXIMUM WIND INCREASE IN NEXT 24-h)
Predictor Value RI Predictor Range Scaled Value(0-1) % Contribution
POT = MPI-VMAX (KT) : 55.9 40.5 to 149.3 0.14 1.2
12 HR PERSISTENCE (KT) : 15.0 -22.0 to 44.0 0.56 5.5
850-200 MB SHEAR (KT) : 10.4 19.6 to 1.4 0.51 4.0
HEAT CONTENT (KJ/CM2) : 10.6 1.8 to 106.7 0.08 0.5
D200 (10**7s-1) : 75.0 -33.0 to 156.2 0.57 4.0
STD DEV OF IR BR TEMP : 10.2 37.8 to 2.1 0.77 4.4
MAXIMUM WIND (KT) : 90.0 22.5 to 132.0 0.56 3.1
BL DRY-AIR FLUX (W/M2) : 127.4 721.6 to -82.5 0.74 -3.6
%area of TPW <45 mm upshear : 0.0 62.3 to 0.0 1.00 0.6
2nd PC OF IR BR TEMP : 0.5 2.2 to -1.9 0.41 0.4
SHIPS Prob RI for 20kt/ 12hr RI threshold= 19% is 3.1 times climatological mean ( 6.1%)
SHIPS Prob RI for 25kt/ 24hr RI threshold= 22% is 1.8 times climatological mean (12.5%)
SHIPS Prob RI for 30kt/ 24hr RI threshold= 20% is 2.4 times climatological mean ( 8.4%)
SHIPS Prob RI for 35kt/ 24hr RI threshold= 14% is 2.3 times climatological mean ( 6.0%)
SHIPS Prob RI for 40kt/ 24hr RI threshold= 10% is 2.4 times climatological mean ( 4.0%)
SHIPS Prob RI for 45kt/ 36hr RI threshold= 0% is 0.0 times climatological mean ( 6.5%)
SHIPS Prob RI for 55kt/ 48hr RI threshold= 0% is 0.0 times climatological mean ( 5.9%)
SHIPS Prob RI for 65kt/ 72hr RI threshold= 0% is 0.0 times climatological mean ( 4.8%)
Matrix of RI probabilities
------------------------------------------------------------------------------
RI (kt / h) | 20/12 | 25/24 | 30/24 | 35/24 | 40/24 | 45/36 | 55/48 |65/72
------------------------------------------------------------------------------
SHIPS-RII: 19.2% 22.1% 20.0% 14.1% 9.5% 0.0% 0.0% 0.0%
Logistic: 6.6% 9.2% 3.1% 1.7% 0.5% 0.3% 0.0% 0.0%
Bayesian: 4.3% 2.9% 1.5% 0.6% 0.1% 0.0% 0.0% 0.0%
Consensus: 10.0% 11.4% 8.2% 5.5% 3.4% 0.1% 0.0% 0.0%
DTOPS: 21.0% 3.0% 1.0% 1.0% 0.0% 0.0% 0.0% 0.0%
## ANNULAR HURRICANE INDEX (AHI) EP122018 JOHN 08/07/18 18 UTC ##
## STORM NOT ANNULAR, SCREENING STEP FAILED, NPASS=5 NFAIL=2 ##
## AHI= 0 (AHI OF 100 IS BEST FIT TO ANN. STRUC., 1 IS MARGINAL, 0 IS NOT ANNULAR) ##
CONTRIBUTIONS TO ANNULAR INDEX
0 likes
- Kingarabian
- S2K Supporter
- Posts: 15762
- Joined: Sat Aug 08, 2009 3:06 am
- Location: Honolulu, Hawaii
Who is online
Users browsing this forum: No registered users and 2 guests