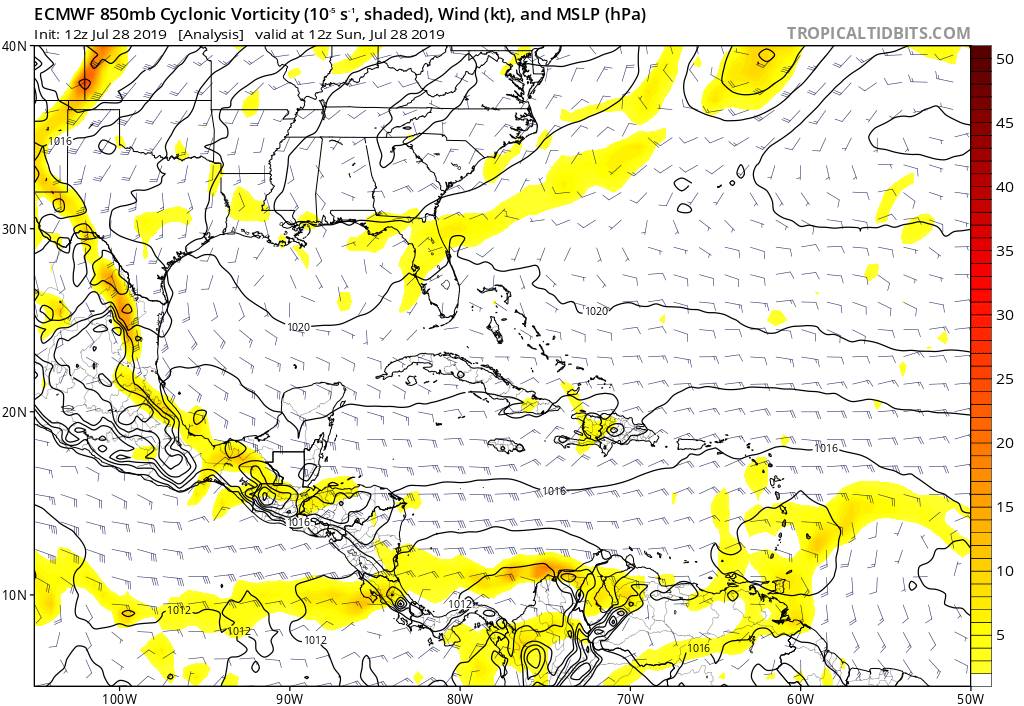
ATL: INVEST 95L - Models
Moderator: S2k Moderators
-
cycloneye

- Admin

- Posts: 149845
- Age: 69
- Joined: Thu Oct 10, 2002 10:54 am
- Location: San Juan, Puerto Rico
ATL: INVEST 95L - Models
Models only.
0 likes
Visit the Caribbean-Central America Weather Thread where you can find at first post web cams,radars
and observations from Caribbean basin members Click Here
and observations from Caribbean basin members Click Here
-
gatorcane

- S2K Supporter

- Posts: 23708
- Age: 48
- Joined: Sun Mar 13, 2005 3:54 pm
- Location: Boca Raton, FL
Re: ATL: INVEST 95L - Models
12Z EC initialization looks too far to the east. Models may indeed be playing catch-up:
0 likes


-
cycloneye
- Admin
- Posts: 149845
- Age: 69
- Joined: Thu Oct 10, 2002 10:54 am
- Location: San Juan, Puerto Rico
Re: ATL: INVEST 95L - Models
First model tracks for 95L.

0 likes
Visit the Caribbean-Central America Weather Thread where you can find at first post web cams,radars
and observations from Caribbean basin members Click Here
and observations from Caribbean basin members Click Here
-
Evil Jeremy
- S2K Supporter
- Posts: 5463
- Age: 32
- Joined: Mon Apr 10, 2006 2:10 pm
- Location: Los Angeles, CA
Re: ATL: INVEST 95L - Models
Anyone else notice the 12z GFS throws this for a full loop around the Bermuda high, starts redeveloping it in 300 hours once it gets back south of 25n, and from there sets 95L up on an Andrew-like path to SFL?
3 likes
Frances 04 / Jeanne 04 / Katrina 05 / Wilma 05 / Fay 08 / Debby 12 / Andrea 13 / Colin 16 / Hermine 16 / Matthew 16 / Irma 17

-
Yellow Evan

- Professional-Met

- Posts: 16257
- Age: 27
- Joined: Fri Jul 15, 2011 12:48 pm
- Location: Henderson, Nevada/Honolulu, HI
- Contact:
Re: ATL: INVEST 95L - Models
* ATLANTIC 2019 SHIPS INTENSITY FORECAST *
* IR SAT DATA AVAILABLE, OHC AVAILABLE *
* INVEST AL952019 07/28/19 18 UTC *
TIME (HR) 0 6 12 18 24 36 48 60 72 84 96 108 120
V (KT) NO LAND 25 28 30 32 35 39 43 47 51 53 56 59 62
V (KT) LAND 25 28 30 32 35 39 43 40 42 44 46 50 52
V (KT) LGEM 25 27 30 32 34 38 40 36 36 37 37 38 40
Storm Type TROP TROP TROP TROP TROP TROP TROP TROP TROP TROP TROP TROP TROP
SHEAR (KT) 6 6 2 8 8 11 18 19 19 21 16 18 14
SHEAR ADJ (KT) -3 -1 6 3 0 8 6 5 3 0 0 0 1
SHEAR DIR 83 118 312 325 352 276 287 276 287 287 307 306 298
SST (C) 28.6 28.5 28.3 28.4 28.4 28.3 28.2 28.5 29.6 29.0 29.3 29.4 29.8
POT. INT. (KT) 145 143 141 143 142 141 139 143 161 151 155 158 165
ADJ. POT. INT. 141 139 137 139 138 134 131 134 149 139 142 147 155
200 MB T (C) -53.8 -53.8 -54.0 -54.0 -53.7 -53.9 -53.7 -53.7 -53.8 -53.7 -53.7 -53.5 -53.6
200 MB VXT (C) -0.3 -0.3 -0.2 -0.3 -0.3 0.0 0.0 0.0 0.0 0.0 0.0 0.0 0.0
TH_E DEV (C) 9 9 9 8 9 9 10 10 10 10 10 9 9
700-500 MB RH 62 62 63 61 59 61 59 63 62 65 61 63 60
MODEL VTX (KT) 7 7 5 5 6 LOST LOST LOST LOST LOST LOST LOST LOST
850 MB ENV VOR 60 50 45 32 36 42 34 58 31 30 19 34 20
200 MB DIV 16 39 41 1 32 28 10 22 13 13 -5 -2 9
700-850 TADV -1 0 -2 -3 -1 9 4 6 2 -3 -4 -15 -2
LAND (KM) 233 300 362 391 314 217 104 -21 17 57 63 78 138
LAT (DEG N) 12.8 13.4 13.9 14.5 15.1 16.2 17.4 18.1 18.8 19.1 19.3 19.1 19.2
LONG(DEG W) 63.3 63.9 64.6 65.5 66.4 68.0 69.7 71.3 72.8 74.3 75.9 77.3 79.1
STM SPEED (KT) 8 8 10 11 10 9 9 9 7 8 7 8 9
HEAT CONTENT 48 39 33 30 31 43 38 31 55 42 48 61 84
FORECAST TRACK FROM TABM INITIAL HEADING/SPEED (DEG/KT):355/ 9 CX,CY: 0/ 9
T-12 MAX WIND: 20 PRESSURE OF STEERING LEVEL (MB): 378 (MEAN=620)
GOES IR BRIGHTNESS TEMP. STD DEV. 50-200 KM RAD: 24.1 (MEAN=14.5)
% GOES IR PIXELS WITH T < -20 C 50-200 KM RAD: 69.0 (MEAN=65.0)
PRELIM RI PROB (DV .GE. 35 KT IN 36 HR): 7.1
INDIVIDUAL CONTRIBUTIONS TO INTENSITY CHANGE
6 12 18 24 36 48 60 72 84 96 108 120
----------------------------------------------------------
SAMPLE MEAN CHANGE 1. 2. 3. 4. 6. 8. 9. 10. 11. 11. 12. 12.
SST POTENTIAL 0. 0. 0. 0. 3. 8. 16. 21. 26. 29. 32. 35.
VERTICAL SHEAR MAG 1. 2. 4. 5. 7. 8. 7. 5. 3. 1. 0. -1.
VERTICAL SHEAR ADJ 0. 0. 0. 0. -1. -2. -3. -3. -2. -2. -1. -1.
VERTICAL SHEAR DIR 0. 0. 0. 1. 0. 0. -1. -1. -2. -2. -2. -3.
PERSISTENCE 1. 1. 1. 1. 1. 1. 0. 0. 0. 1. 0. 0.
200/250 MB TEMP. 0. -1. -1. -1. -1. 0. 0. 0. 0. 0. 0. 0.
THETA_E EXCESS 0. 0. 0. 0. 0. 0. 0. 0. 0. 0. 0. 0.
700-500 MB RH 0. 0. 0. 0. -1. -1. -2. -2. -3. -3. -3. -3.
MODEL VTX TENDENCY 0. -1. -2. -1. -2. -4. -5. -6. -7. -8. -8. -9.
850 MB ENV VORTICITY 0. 0. 0. 0. 0. 1. 1. 1. 1. 1. 1. 1.
200 MB DIVERGENCE 0. 0. 0. 0. 0. 0. 0. 0. 0. 0. 0. 1.
850-700 T ADVEC 0. 0. 0. 0. 0. 0. 0. 0. 0. 0. 0. 0.
ZONAL STORM MOTION 0. 0. 0. 0. 0. 0. -1. -1. -1. -2. -2. -3.
STEERING LEVEL PRES 0. 1. 1. 1. 2. 2. 1. 2. 3. 3. 5. 4.
DAYS FROM CLIM. PEAK 0. 0. 0. 0. 0. 0. 0. 0. 0. 1. 1. 1.
GOES PREDICTORS 0. 0. 1. 0. 0. 0. 0. -1. -1. -1. -1. -1.
OCEAN HEAT CONTENT 0. 0. 0. 0. 0. 0. 0. 0. 0. 0. 0. 0.
RI POTENTIAL 0. 0. 0. -1. -1. -1. -1. -1. 0. 0. 1. 1.
----------------------------------------------------------
TOTAL CHANGE 3. 5. 7. 10. 14. 18. 22. 26. 28. 31. 34. 37.
CURRENT MAX WIND (KT): 25. LAT, LON: 12.8 63.3
** 2019 ATLANTIC RI INDEX AL952019 INVEST 07/28/19 18 UTC **
(SHIPS-RII PREDICTOR TABLE for 30 KT OR MORE MAXIMUM WIND INCREASE IN NEXT 24-h)
Predictor Value RI Predictor Range Scaled Value(0-1) % Contribution
12 HR PERSISTENCE (KT) : 5.0 -49.5 to 33.0 0.66 6.0
850-200 MB SHEAR (KT) : 6.0 30.1 to 2.3 0.87 3.0
HEAT CONTENT (KJ/CM2) : 36.2 0.0 to 151.8 0.24 0.7
STD DEV OF IR BR TEMP : 24.1 36.6 to 2.8 0.37 1.4
MAXIMUM WIND (KT) : 25.0 22.5 to 137.5 0.07 0.1
2nd PC OF IR BR TEMP : -1.2 2.9 to -2.9 0.70 1.8
POT = MPI-VMAX (KT) : 113.5 27.5 to 139.6 0.77 1.9
D200 (10**7s-1) : 25.8 -29.7 to 185.9 0.26 0.3
%area of TPW <45 mm upshear : 0.0 100.0 to 0.0 1.00 0.0
BL DRY-AIR FLUX (W/M2) : 122.0 895.4 to -55.0 0.81 0.0
SHIPS Prob RI for 20kt/ 12hr RI threshold= 6% is 1.2 times climatological mean ( 5.2%)
SHIPS Prob RI for 25kt/ 24hr RI threshold= 22% is 2.0 times climatological mean (10.9%)
SHIPS Prob RI for 30kt/ 24hr RI threshold= 15% is 2.2 times climatological mean ( 6.9%)
SHIPS Prob RI for 35kt/ 24hr RI threshold= 9% is 2.5 times climatological mean ( 3.8%)
SHIPS Prob RI for 40kt/ 24hr RI threshold= 0% is 0.0 times climatological mean ( 2.4%)
SHIPS Prob RI for 45kt/ 36hr RI threshold= 0% is 0.0 times climatological mean ( 4.5%)
SHIPS Prob RI for 55kt/ 48hr RI threshold= 15% is 3.3 times climatological mean ( 4.6%)
SHIPS Prob RI for 65kt/ 72hr RI threshold= 0% is 0.0 times climatological mean ( 5.4%)
Matrix of RI probabilities
------------------------------------------------------------------------------
RI (kt / h) | 20/12 | 25/24 | 30/24 | 35/24 | 40/24 | 45/36 | 55/48 |65/72
------------------------------------------------------------------------------
SHIPS-RII: 6.4% 22.1% 15.2% 9.4% 0.0% 0.0% 15.3% 0.0%
Logistic: 9.1% 31.9% 18.2% 4.5% 2.2% 13.6% 22.2% 28.2%
Bayesian: 3.8% 24.4% 6.1% 0.5% 0.3% 6.8% 9.4% 8.1%
Consensus: 6.4% 26.1% 13.2% 4.8% 0.8% 6.8% 15.6% 12.1%
DTOPS: 999.0% 999.0% 999.0% 999.0% 999.0% 999.0% 999.0% 999.0%
## ANNULAR HURRICANE INDEX (AHI) AL952019 INVEST 07/28/19 18 UTC ##
## STORM NOT ANNULAR, SCREENING STEP FAILED, NPASS=5 NFAIL=2 ##
## AHI= 0 (AHI OF 100 IS BEST FIT TO ANN. STRUC., 1 IS MARGINAL, 0 IS NOT ANNULAR) ##
** PROBLTY OF AT LEAST 1 SCNDRY EYEWL FORMTN EVENT AL952019 INVEST 07/28/2019 18 UTC **
TIME(HR) 0-12 12-24(0-24) 24-36(0-36) 36-48(0-48)
CLIMO(%) 0 0( 0) 0( 0) 0( 0) <-- PROB BASED ON INTENSITY ONLY
PROB(%) 0 0( 0) 0( 0) 0( 0) <-- FULL MODEL PROB (RAN NORMALLY)
** DSHIPS INTENSITY FORECAST ADJUSTED RELATIVE TO ONSET OF ERC WEAKENING PHASE **
TIME (HR) 0 6 12 18 24 36 48 60 72 84 96 108 120
>24HR AGO (DSHIPS) 25 28 30 32 35 39 43 40 42 44 46 50 52
18HR AGO 25 24 26 28 31 35 39 36 38 40 42 46 48
12HR AGO 25 22 21 23 26 30 34 31 33 35 37 41 43
6HR AGO 25 19 16 15 18 22 26 23 25 27 29 33 35
NOW CURRENT INTENSITY < 83 KT
IN 6HR INTENSITY IN 6HR < 83 KT
IN 12HR INTENSITY IN 12HR < 83 KT
0 likes


Re: ATL: INVEST 95L - Models
Looks like the 12z Euro stretches it out ahead of a trough before any development can occur (unless it gets trapped and loops back like that wild GFS run).
0 likes
-
Aric Dunn
- Category 5

- Posts: 21238
- Age: 43
- Joined: Sun Sep 19, 2004 9:58 pm
- Location: Ready for the Chase.
- Contact:
ATL: INVEST 95L - Discussion
UKMET Sticking with the eastern gulf. essentially takes it over central cuba
0 likes
Note: If I make a post that is brief. Please refer back to previous posts for the analysis or reasoning. I do not re-write/qoute what my initial post said each time.
If there is nothing before... then just ask
Space & Atmospheric Physicist, Embry-Riddle Aeronautical University,
I believe the sky is falling...
If there is nothing before... then just ask
Space & Atmospheric Physicist, Embry-Riddle Aeronautical University,
I believe the sky is falling...
Re: ATL: INVEST 95L - Models
SHIPS keeps shear under 21 knots over it after 36-48 hours, land interaction is its biggest inhibitor to much if any development according to it.
1 likes
-
Hurricaneman

- Category 5
- Posts: 7404
- Age: 45
- Joined: Tue Aug 31, 2004 3:24 pm
- Location: central florida
Re: ATL: INVEST 95L - Models
Siker wrote:Looks like the 12z Euro stretches it out ahead of a trough before any development can occur (unless it gets trapped and loops back like that wild GFS run).
Honestly it looks like it would move WSW after 240 so maybe the GFS isn’t off it’s meds so if future runs show something similar not only would that be crazy, but few have looped back and hit Florida. The last time anything similar to the GFS happened was Jeanne in 2004
0 likes
-
Aric Dunn
- Category 5
- Posts: 21238
- Age: 43
- Joined: Sun Sep 19, 2004 9:58 pm
- Location: Ready for the Chase.
- Contact:
Re: ATL: INVEST 95L - Models
The map is not centered but look at the BAM models tracks. the bend back to the left is interesting..

0 likes
Note: If I make a post that is brief. Please refer back to previous posts for the analysis or reasoning. I do not re-write/qoute what my initial post said each time.
If there is nothing before... then just ask
Space & Atmospheric Physicist, Embry-Riddle Aeronautical University,
I believe the sky is falling...
If there is nothing before... then just ask
Space & Atmospheric Physicist, Embry-Riddle Aeronautical University,
I believe the sky is falling...
Re: ATL: INVEST 95L - Models
The good news for the CONUS is that the 12Z EPS doesn't have even one TS from the 50+ members hitting the Gulf with 95L over the next 10 days. About all they have are 2 TDs in the GOM that then hit FL. There's also a TD that hits SE FL. (There's one member hitting NC with a TS from the E. I don't know what that is.) Many of the remaining members of the 12Z EPS as well as 12Z GEFS and 12Z GEPS are TDs or TSs offshore the SE US recurving.
This is in contrast to the much more active EPS in advance of Barry in the GOM.
The main threat would be if the various models/ensemble members are too aggressive with their recurvatures due to too much E US troughing being assumed due to bias. Hopefully that is not the case, but there has been a subtle SW shift in the mean 12Z EPS track vs the 0Z EPS.
12Z EPS tracks link:
https://weather.us/cyclone-tracks/euro/ ... 2-240.html
0 likes
Personal Forecast Disclaimer:
The posts in this forum are NOT official forecasts and should not be used as such. They are just the opinion of the poster and may or may not be backed by sound meteorological data. They are NOT endorsed by any professional institution or storm2k.org. For official information, please refer to the NHC and NWS products.
The posts in this forum are NOT official forecasts and should not be used as such. They are just the opinion of the poster and may or may not be backed by sound meteorological data. They are NOT endorsed by any professional institution or storm2k.org. For official information, please refer to the NHC and NWS products.
-
Aric Dunn
- Category 5
- Posts: 21238
- Age: 43
- Joined: Sun Sep 19, 2004 9:58 pm
- Location: Ready for the Chase.
- Contact:
Re: ATL: INVEST 95L - Models
LarryWx wrote:The good news for the CONUS is that the 12Z EPS doesn't have even one TS from the 50+ members hitting the Gulf with 95L over the next 10 days. About all they have are 2 TDs in the GOM that then hit FL. There's also a TD that hits SE FL. (There's one member hitting NC with a TS from the E. I don't know what that is.) Many of the remaining members of the 12Z EPS as well as 12Z GEFS and 12Z GEPS are TDs or TSs offshore the SE US recurving.
This is in contrast to the much more active EPS in advance of Barry in the GOM.
The main threat would be if the various models/ensemble members are too aggressive with their recurvatures due to too much E US troughing being assumed due to bias. Hopefully that is not the case, but there has been a subtle SW shift in the mean 12Z EPS track vs the 0Z EPS.
12Z EPS tracks link:
https://weather.us/cyclone-tracks/euro/ ... 2-240.html
Dont forget with the sw shift the energy spends a lot of time over Hispaniola and Cuba. so not surprised with the low development now.
0 likes
Note: If I make a post that is brief. Please refer back to previous posts for the analysis or reasoning. I do not re-write/qoute what my initial post said each time.
If there is nothing before... then just ask
Space & Atmospheric Physicist, Embry-Riddle Aeronautical University,
I believe the sky is falling...
If there is nothing before... then just ask
Space & Atmospheric Physicist, Embry-Riddle Aeronautical University,
I believe the sky is falling...
-
USTropics
- Professional-Met
- Posts: 2742
- Joined: Sun Aug 12, 2007 3:45 am
- Location: Florida State University
Re: ATL: INVEST 95L - Models
18z GFS has a sheared mess impacting FL, GFS legacy has development in the Bahamas:
18z GFS:

18z legacy GFS:

18z GFS:
18z legacy GFS:
0 likes

-
Hurricaneman
- Category 5
- Posts: 7404
- Age: 45
- Joined: Tue Aug 31, 2004 3:24 pm
- Location: central florida
Re: ATL: INVEST 95L - Models
The 18zGFS is still sending a part of 95L for a loop back near the Bahamas at the end of the run, it’s not the strength I’m looking at past day 10 but if it’s clueing in on a potential loop back to the US in the long run. Let’s hope this doesn’t loop back around like the last few runs of the GFS has shown and I would have to see farther out but potentially the Euro shows after 240hrs
0 likes
Re: ATL: INVEST 95L - Models
Although the mean is still just over 100 miles offshore SE FL, the 0Z GEFS is continuing a trend of the last 3 GEFS means of very slightly closer to FL/SE US with an ever so slightly stronger Bermuda High with each run, pushing 95L ever so slightly SW with each run. Whereas the 6Z was just E of Grand Bahama Is., the 0z is further west over the west central part of that island representing a shift of ~100 miles the last 3 runs. Is this trend going to continue? If this trend is due to a correction of a quite common bias toward too much E US troughing, then later GEFS means may very well correct even further SW and thus put SE FL in its crosshairs. We'll see. Regardless, the members are still pretty weak with mainly TDs to maybe some TSs.
0 likes
Personal Forecast Disclaimer:
The posts in this forum are NOT official forecasts and should not be used as such. They are just the opinion of the poster and may or may not be backed by sound meteorological data. They are NOT endorsed by any professional institution or storm2k.org. For official information, please refer to the NHC and NWS products.
The posts in this forum are NOT official forecasts and should not be used as such. They are just the opinion of the poster and may or may not be backed by sound meteorological data. They are NOT endorsed by any professional institution or storm2k.org. For official information, please refer to the NHC and NWS products.
-
plasticup
Re: ATL: INVEST 95L - Models
Aric Dunn wrote:LarryWx wrote:The good news for the CONUS is that the 12Z EPS doesn't have even one TS from the 50+ members hitting the Gulf with 95L over the next 10 days. About all they have are 2 TDs in the GOM that then hit FL. There's also a TD that hits SE FL. (There's one member hitting NC with a TS from the E. I don't know what that is.) Many of the remaining members of the 12Z EPS as well as 12Z GEFS and 12Z GEPS are TDs or TSs offshore the SE US recurving.
This is in contrast to the much more active EPS in advance of Barry in the GOM.
The main threat would be if the various models/ensemble members are too aggressive with their recurvatures due to too much E US troughing being assumed due to bias. Hopefully that is not the case, but there has been a subtle SW shift in the mean 12Z EPS track vs the 0Z EPS.
12Z EPS tracks link:
https://weather.us/cyclone-tracks/euro/ ... 2-240.html
Dont forget with the sw shift the energy spends a lot of time over Hispaniola and Cuba. so not surprised with the low development now.
Wouldn't take much of a shift to avoid that land interaction though, and then we'd have a very different picture.
2 likes
Who is online
Users browsing this forum: No registered users and 10 guests