

wxman57 wrote:DioBrando wrote:oh and not to forget they were all during the cold period (before 1995)
Note that the Atlantic Multidecadal Oscillation is currently in a cool cycle which began in 2013 (Klotzbach/Gray method).
Moderator: S2k Moderators

wxman57 wrote:DioBrando wrote:oh and not to forget they were all during the cold period (before 1995)
Note that the Atlantic Multidecadal Oscillation is currently in a cool cycle which began in 2013 (Klotzbach/Gray method).


wxman57 wrote:DioBrando wrote:oh and not to forget they were all during the cold period (before 1995)
Note that the Atlantic Multidecadal Oscillation is currently in a cool cycle which began in 2013 (Klotzbach/Gray method).
CyclonicFury wrote:wxman57 wrote:DioBrando wrote:oh and not to forget they were all during the cold period (before 1995)
Note that the Atlantic Multidecadal Oscillation is currently in a cool cycle which began in 2013 (Klotzbach/Gray method).
Klotzbach's AMO actually turned positive in July FWIW.
Also, the Atlantic has not behaved like the cool cycle the last three years. Three consecutive above average seasons that were way more active than the 1970-94 average.

USTropics wrote:Even if you were to disregard SSTAs, in a -AMO we should be seeing a very dry Sahel/inactive WAM and cooler boreal summers in Europe, the opposite is occurring.


DioBrando wrote:CyclonicFury wrote:wxman57 wrote:
Note that the Atlantic Multidecadal Oscillation is currently in a cool cycle which began in 2013 (Klotzbach/Gray method).
Klotzbach's AMO actually turned positive in July FWIW.
Also, the Atlantic has not behaved like the cool cycle the last three years. Three consecutive above average seasons that were way more active than the 1970-94 average.
True, in fact I just literally quoted the AMO index in my last post in red.
How many more maps, models and graphs do I have to post to prove that things are changing without resorting to the use of cherry-picking?


I respect your opinion, but weren't you saying literally a week ago that this season would be a bust and didn't you cancel it? Not much has happened in the past week that has made predicted conditions flip.DioBrando wrote:CyclonicFury wrote:wxman57 wrote:
Note that the Atlantic Multidecadal Oscillation is currently in a cool cycle which began in 2013 (Klotzbach/Gray method).
Klotzbach's AMO actually turned positive in July FWIW.
Also, the Atlantic has not behaved like the cool cycle the last three years. Three consecutive above average seasons that were way more active than the 1970-94 average.
True, in fact I just literally quoted the AMO index in my last post in red.
How many more maps, models and graphs do I have to post to prove that things are changing without resorting to the use of cherry-picking?
shiny-pebble wrote:I respect your opinion, but weren't you saying literally a week ago that this season would be a bust and didn't you cancel it? Not much has happened in the past week that has made predicted conditions flip.DioBrando wrote:CyclonicFury wrote:Klotzbach's AMO actually turned positive in July FWIW.
Also, the Atlantic has not behaved like the cool cycle the last three years. Three consecutive above average seasons that were way more active than the 1970-94 average.
True, in fact I just literally quoted the AMO index in my last post in red.
How many more maps, models and graphs do I have to post to prove that things are changing without resorting to the use of cherry-picking?
Sent from my LG-H700 using Tapatalk
wxman57 wrote:crownweather wrote:wxman57 wrote:Our latest analogs from July, which included a projection of a weak El Nino (+0.5 to +0.6) were as follows:
1968 - 8/4/0 45 ACE
1976 - 10/6/2 84 ACE
1979 - 9/5/2 92 ACE
1993 - 8/4/1 39 ACE
1991 - 8/4/2 36 ACE
I'm checking with our long-range guy to see if he's computed the latest analogs based on warm-neutral conditions in the Nino 3.4 area. Note that a weak El Nino typically has little impact on Atlantic activity. It takes a moderate to strong El Nino to hinder development, so there should not be much change in the analogs going to warm-neutral. Note that the analog years may differ from Klotzbach as he uses current conditions while we look at predicted conditions across the tropics.
Interesting that all analog years had at least 1 tropical cyclone threat for the US East Coast. 1976 with Belle, 1979 with David (then Frederic into the Alabama coast), 1993 with Emily and 1991 with Bob. Finally, 1968 had Gladys into west Florida during October.
Yes, and I pointed that out in my outlook presentations this spring. I just got my coworker's new analogs based on warm-neutral in Nino 3.4:
1958 - 12/7/3 109 ACE
1959 - 14/7/2 77 ACE
1960 - 8/4/2 73 ACE
1968 - 8/4/0 45 ACE
1979 - 9/5/2 92 ACE
1980 - 11/9/2 149 ACE
1981 - 12/7/3 100 ACE
1993 - 8/4/1 39 ACE
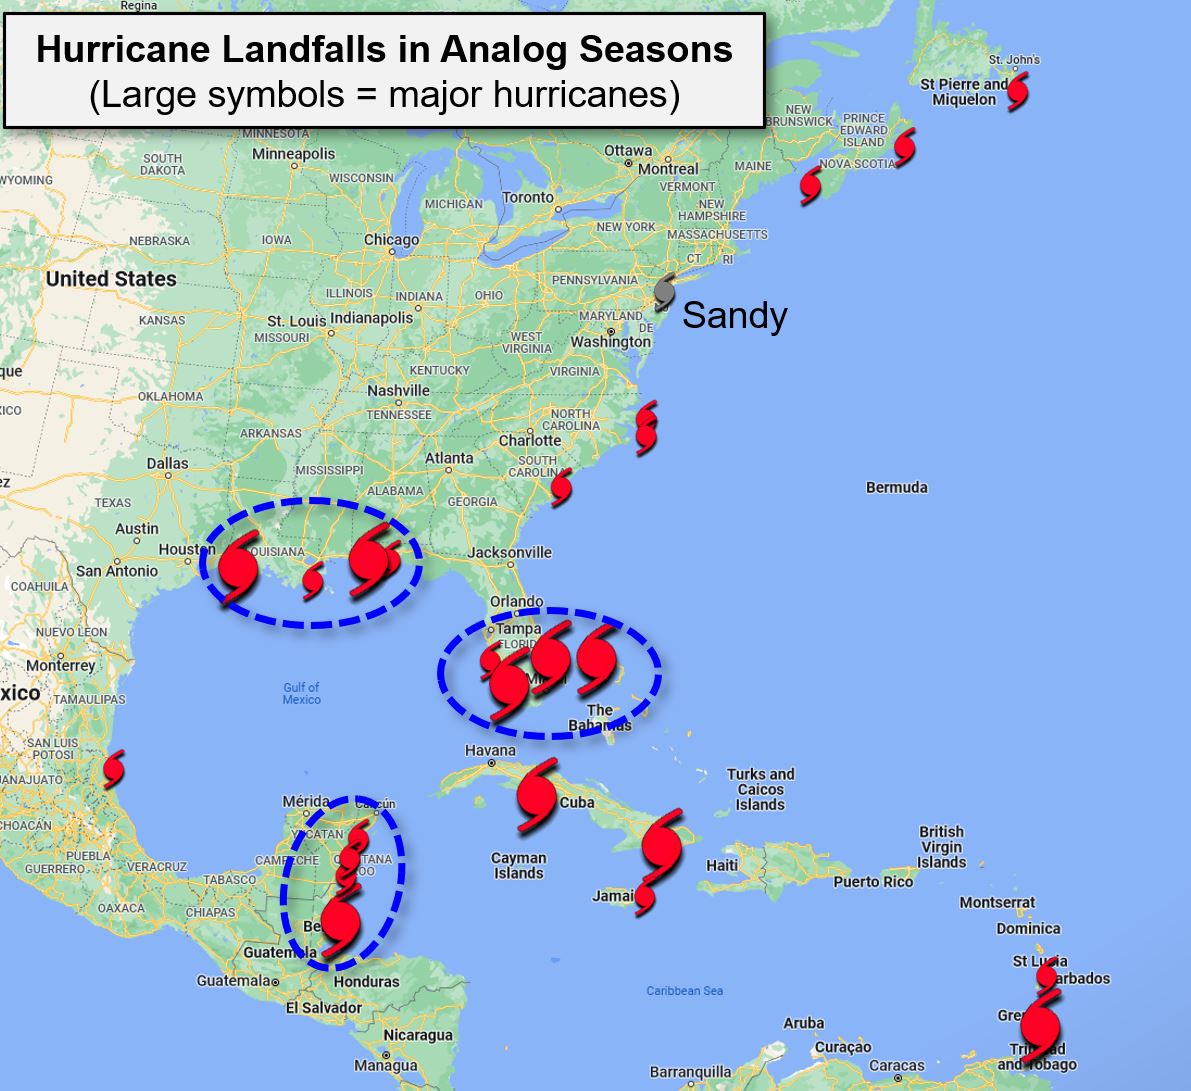
Average is 10/6/2 with 86 ACE for those analogs. I plotted all Caribbean & U.S. hurricane landfalls for these analogs (below). I'm not seeing a pattern that is similar to 1980 out there. Allen was the first hurricane I ever worked. A number of hits along the East U.S. Coast in the analogs, despite the relatively low numbers and ACE for the analogs. Like I said, lower than average numbers doesn't mean a decreased risk of a hurricane landfall, necessarily.
http://wxman57.com/images/analogs.JPG
wxman57 wrote:wxman57 wrote:crownweather wrote:
Interesting that all analog years had at least 1 tropical cyclone threat for the US East Coast. 1976 with Belle, 1979 with David (then Frederic into the Alabama coast), 1993 with Emily and 1991 with Bob. Finally, 1968 had Gladys into west Florida during October.
Yes, and I pointed that out in my outlook presentations this spring. I just got my coworker's new analogs based on warm-neutral in Nino 3.4:
1958 - 12/7/3 109 ACE
1959 - 14/7/2 77 ACE
1960 - 8/4/2 73 ACE
1968 - 8/4/0 45 ACE
1979 - 9/5/2 92 ACE
1980 - 11/9/2 149 ACE
1981 - 12/7/3 100 ACE
1993 - 8/4/1 39 ACE
Average is 10/6/2 with 86 ACE for those analogs. I plotted all Caribbean & U.S. hurricane landfalls for these analogs (below). I'm not seeing a pattern that is similar to 1980 out there. Allen was the first hurricane I ever worked. A number of hits along the East U.S. Coast in the analogs, despite the relatively low numbers and ACE for the analogs. Like I said, lower than average numbers doesn't mean a decreased risk of a hurricane landfall, necessarily.
http://wxman57.com/images/analogs.JPG
Note that my long-range guy for the past 30 years is out of the office today. He tells me that the analogs I posted above are mostly secondary and not primary analogs. He'll be in the office tomorrow to give me the primary analogs for Aug-Nov.


HURRICANELONNY wrote:Now that's fake news. Can't believe they can get away posting that:
https://nypost.com/2019/08/12/us-could- ... perts-say/
HURRICANELONNY wrote:Now that's fake news. Can't believe they can get away posting that:
https://nypost.com/2019/08/12/us-could- ... perts-say/
hurricanehunter69 wrote:Just like a pop corn thunderstorm...The tropics can heat up (flip the switch ) and become very active in quite a hurry! We have a warm-neutral ENSO, below average shear, and above average SST's. The tropics would likely be very active If it weren't for a significant outbreak of mid-level dry air, ( SAL ). I would still bet on a 2/1/0 line in August and 6/4/2 in Sept, 4/3/1 Oct and 1/1/0 the rest of the way. 15/9/3
HURRICANELONNY wrote:Now that's fake news. Can't believe they can get away posting that:
https://nypost.com/2019/08/12/us-could- ... perts-say/
Users browsing this forum: No registered users and 115 guests
