

Moderator: S2k Moderators


Nancy Smar wrote:SALIENT FEATURES:-
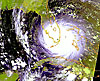
VORTEX (AMPHAN) OVER SE BAY & N/HOOD :-
VORTEX (AMPHAN) OVER CENTRAL PARTS OF SOUTH BAY & N/HOOD HAS
FURTHER INTENSIFIED NOW LAY CENTERED NEAR 11.7N/86.0E (.) A BANDING
EYE IS OBSERVED IN THE VISIBLE IMAGERY. INTENSITY T4.0 RPT T 4.0 (.)
CURVED BAND PATTERN (.) ASSTD BKN LOW/MED CLOUDS WITH EMBDD INT
TO V INT CONVTN OVER BAY BET LAT 7.5N TO 14.0N LONG 81.0E TO 89.0E
(.)
The latest Dvorak analysis from IMD is T4.0 so that Amphan could be classified as a VSCS later today.
Hayabusa wrote:UKMET 17/00z has 899 mb peak
Abdullah wrote:Hayabusa wrote:UKMET 17/00z has 899 mb peak
Where can you find the UKMET for the North Indian Ocean (in graphic preferably)? I've heard they're good with intensity.
Nancy Smar wrote:Abdullah wrote:Hayabusa wrote:UKMET 17/00z has 899 mb peak
Where can you find the UKMET for the North Indian Ocean (in graphic preferably)? I've heard they're good with intensity.
https://tgftp.nws.noaa.gov/data/raw/fx/fxxt04.egrr..txt
Abdullah wrote:The storm is now called "Very Severe Cyclonic Storm Amphan"Nancy Smar wrote:Abdullah wrote:
Where can you find the UKMET for the North Indian Ocean (in graphic preferably)? I've heard they're good with intensity.
https://tgftp.nws.noaa.gov/data/raw/fx/fxxt04.egrr..txt
Anywhere I can convert this to a graphic? I can make do without, but I'd like to see that (I've seen others on this website).


Hayabusa wrote:Abdullah wrote:The storm is now called "Very Severe Cyclonic Storm Amphan"Nancy Smar wrote:https://tgftp.nws.noaa.gov/data/raw/fx/fxxt04.egrr..txt
Anywhere I can convert this to a graphic? I can make do without, but I'd like to see that (I've seen others on this website).
I plot the UKMET into a graphic if you mean the ones I post in this thread.
https://i.imgur.com/DrwpFW3.png
https://i.imgur.com/e0F2Rpq.png

aspen wrote:Hayabusa wrote:Abdullah wrote:The storm is now called "Very Severe Cyclonic Storm Amphan"
Anywhere I can convert this to a graphic? I can make do without, but I'd like to see that (I've seen others on this website).
I plot the UKMET into a graphic if you mean the ones I post in this thread.
https://i.imgur.com/DrwpFW3.png
https://i.imgur.com/e0F2Rpq.png
What’s the pressure at 20N? That looks like it’s sub-900 mbar.


Users browsing this forum: No registered users and 35 guests


