2020 Indicators: SST's / SAL / MSLP / Steering / Shear / Instability / Sat Images
Moderator: S2k Moderators
Forum rules

The posts in this forum are NOT official forecasts and should not be used as such. They are just the opinion of the poster and may or may not be backed by sound meteorological data. They are NOT endorsed by any professional institution or STORM2K. For official information, please refer to products from the National Hurricane Center and National Weather Service.
-
stormlover2013
Re: 2020 Indicators: SST's / SAL / MSLP / Steering / Shear / Instability / Sat Images
June is always quiet, gom will be popping coming late July till late sept
0 likes
-
USTropics
- Professional-Met

- Posts: 2738
- Joined: Sun Aug 12, 2007 3:45 am
- Location: Florida State University
Re: 2020 Indicators: SST's / SAL / MSLP / Steering / Shear / Instability / Sat Images
Visioen wrote:I'm wondering if the exceptional SAL levels will also lower SST's a bit because of less sunshine reaching the surface.
Yes, that will occur. Dust in SAL outbreaks act as mineral rich aerosols, both refracting sunlight as well as absorbing solar radiation (meaning less energy reaching the surface of the ocean to warm it). In some of the strongest/extended SAL outbreaks SST temperatures can decrease anywhere from 0.5-1.0C.
As other have pointed out, AEW clusters are closely linked to SAL outbreaks. An increase in surface winds speeds over a specific region (particularly Chad and the Bodélé Depression, which has the highest concentration of dust in the world) results in a higher dust load. On top of that, there is a large baroclinic system over NW Africa/Spain helping to "pulse" these new huge concentrations of dust load across the Atlantic.
Also SST retrieval algorithms that rely more on satellite derived data (OIST and CDAS) can report lower than normal SSTs due to how they analyze SST skins. You can read more about the specifics in the Harvard article below.
This also can be intricately linked to the AMO cycle as well. Warm AMO means a warmer NATL, which influences the ITCZ location to lift more north, which increases rainfall in the Sahel region. A more moist/tropical atmosphere in the Sahel leads to less dust load in SAL. There will always be SAL outbreaks as long as there are AEWs to influence low-level surface winds, but the effects can be negated by an increase in moisture/vegetation in the Sahel region.
Compare topography of Africa to my previous ITCZ post above:


Sources:
Dust load in Chad - https://agupubs.onlinelibrary.wiley.com/doi/full/10.1029/2006GL025827
SST retrieval algorithms - https://ui.adsabs.harvard.edu/abs/2017AGUFMGC51E0842S/abstract
Variance between surface winds, precipitation, and SAL -https://journals.ametsoc.org/jcli/article/25/15/5404/33591/Multidecadal-Covariability-of-North-Atlantic-Sea
10 likes
-
CYCLONE MIKE
- Category 5

- Posts: 2183
- Joined: Tue Aug 31, 2004 6:04 pm
- Location: Gonzales, LA
Re: 2020 Indicators: SST's / SAL / MSLP / Steering / Shear / Instability / Sat Images
Looks like we will have a real reason to need to be wearing masks down here in south Louisiana soon
1 likes
-
USTropics
- Professional-Met
- Posts: 2738
- Joined: Sun Aug 12, 2007 3:45 am
- Location: Florida State University
Re: 2020 Indicators: SST's / SAL / MSLP / Steering / Shear / Instability / Sat Images
The transportation of SAL is most active from November - March, when the Bodele Low Level Jet is most active( it's actually least active from June–August). First though, a geography lesson. The Bodélé Depression is actually a remnant lake bed (known as Mega-lake Chad before the Holocene glacial retreat). Over the past few thousand years, due to changing atmospheric circulations, Lake Chad has almost completely dried up and decreased to 5% of its original size. This is now a very fertile bed of minerals and...dust. For the geography buffs out there, due to the topography and location of mountains, a wind tunnel has been established that coincidentally goes directly over the remnants of Mega-lake Chad (i.e. Bodele Low Level Jet).

Side tangent - So this wind tunnel drives over the remnants of a previously fertile and still mineral rich lake bed, and then carries this westwards towards the Atlantic. This actually has significant impacts on Africa's neighbor, South America. Some of these fertile deposits eventually end up in the Amazon rainforest, acting as fertilizer. So if it wasn't for these processes transporting 50 million tonnes of dust to South America per year (https://www.atmos-chem-phys.net/10/7533 ... ssion.html), the Amazon rainforest would not exist in its current capacity.
So you may be thinking, if this is most active during the winter and least active during the Summer, why do we still have SAL outbreaks? Research published in Geophysical Research Letters (https://agupubs.onlinelibrary.wiley.com ... 05GL023597) found that winds have to whip across the region at a minimum of 36 km/h (22 mi/h), to kick up a dust storm. What else can cause this besides an active Bodele Low Level Jet? A passing AEW that is intensifying can create enough wind forcing through this tunnel to create the minimum threshold necessary, and since winds have relatively been lax before a passage, a large accumulation of dust load is available.
11 likes
-
Shell Mound
- Category 5
- Posts: 2432
- Age: 33
- Joined: Thu Sep 07, 2017 3:39 pm
- Location: St. Petersburg, FL → Scandinavia
Re: 2020 Indicators: SST's / SAL / MSLP / Steering / Shear / Instability / Sat Images
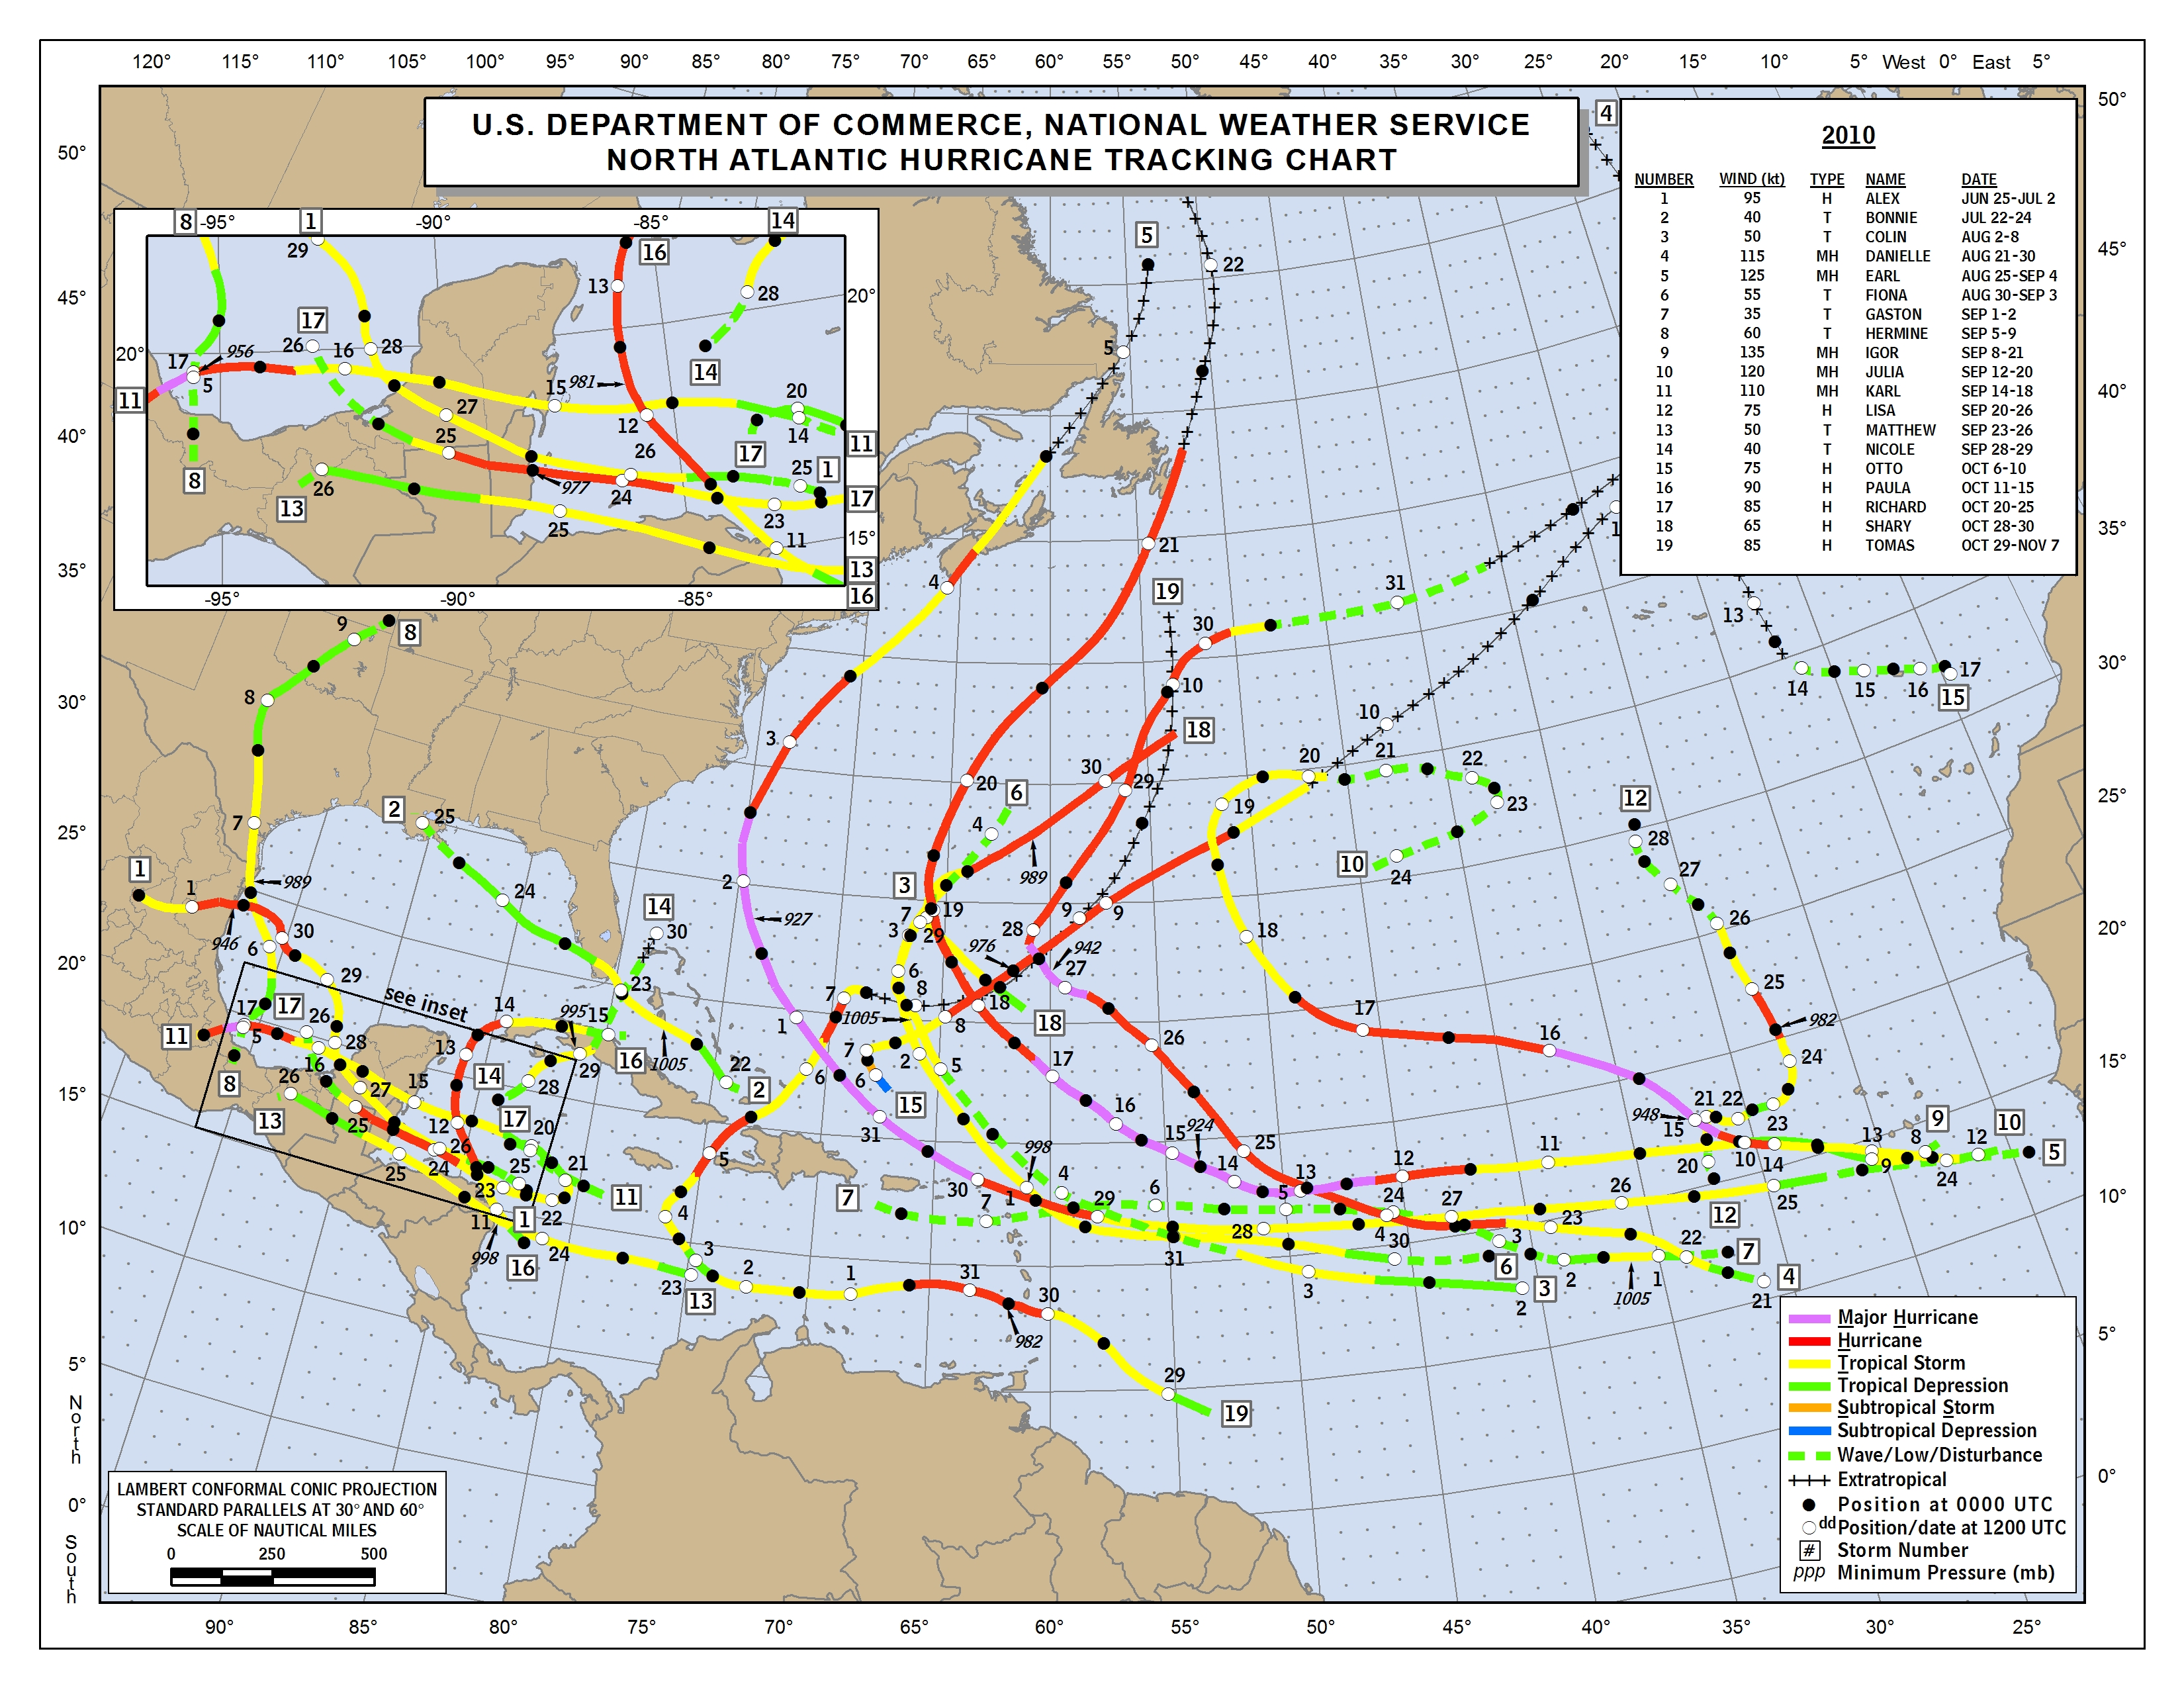
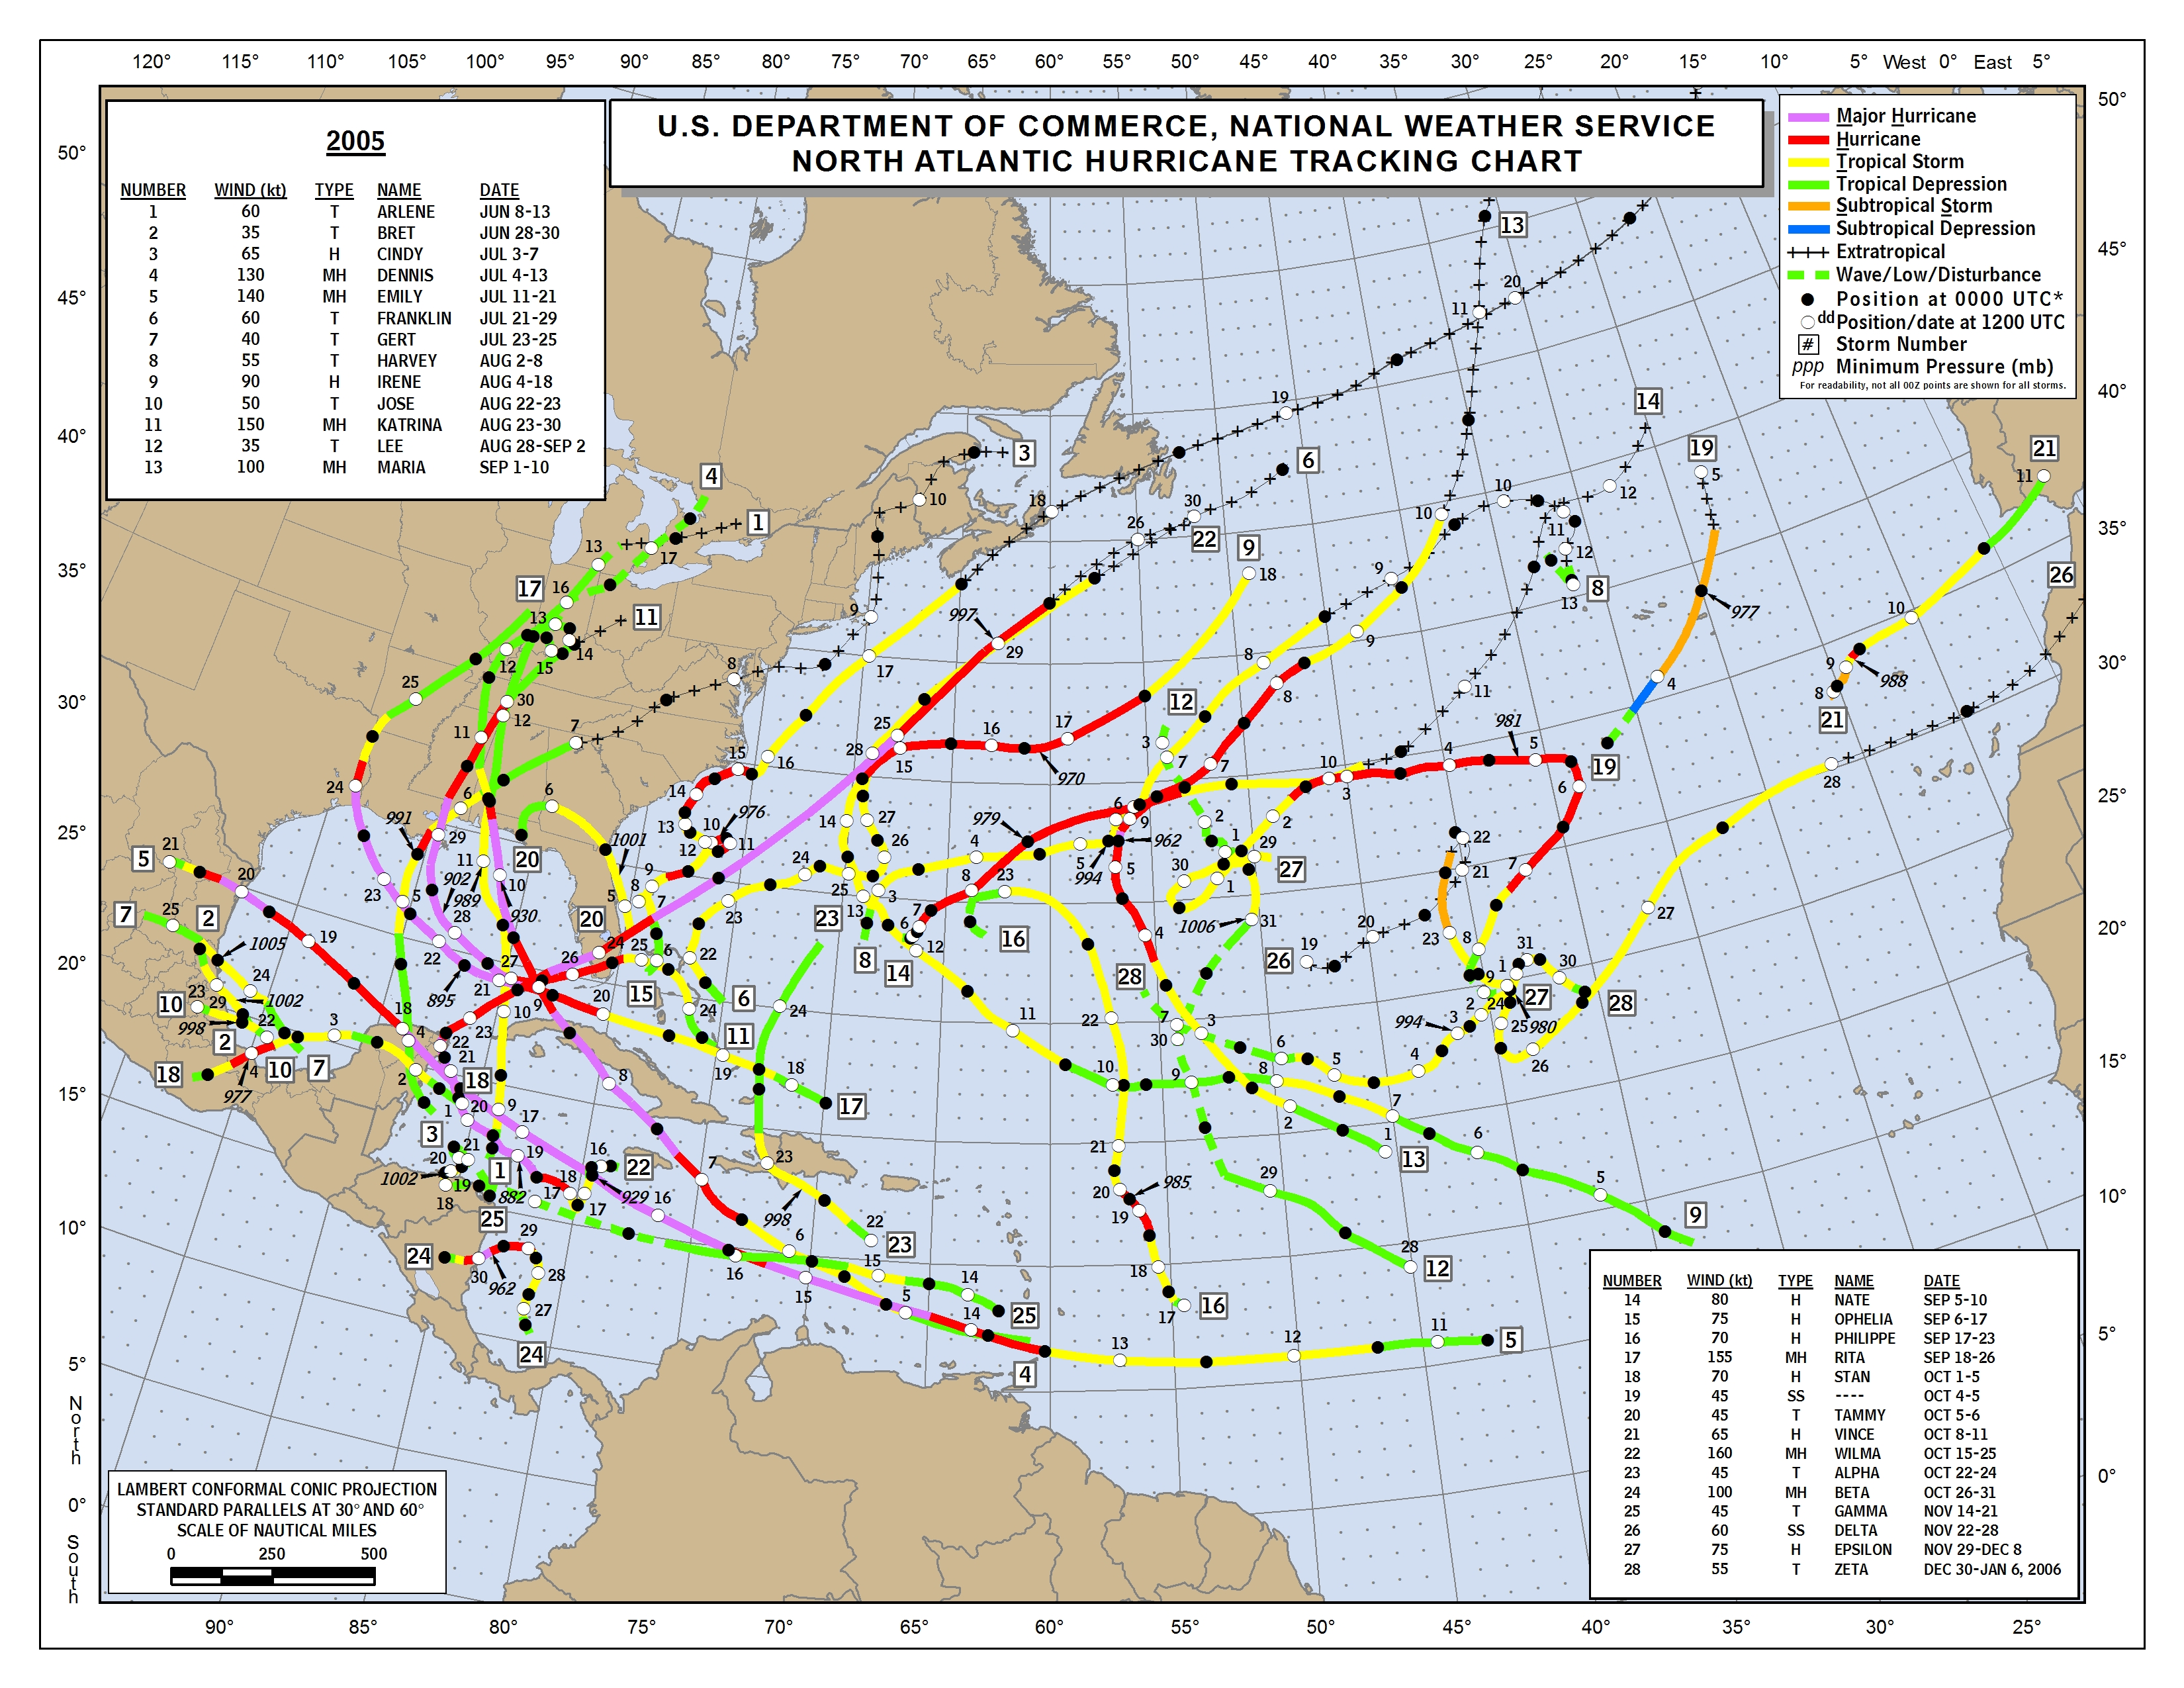
Honestly, the current SST configuration in the Atlantic basin is probably the strongest or most prototypical +AMO we have seen since 2010. It is certainly more of a +AMO than we observed in 2017 and is even more pronounced than at this time in 2005. What is unusual about this year is the fact that we have seen a very strong Bermuda High that has been displaced northeastward of its usual location, allowing stronger easterlies to persist over the northern MDR/subtropics, while low-level westerlies have dominated the equatorial Atlantic. (This pattern also accounts for the above-average rainfall over coastal South Florida, given that the Bermuda High, while strong, was too far to the northeast for South FL to experience visible effects. So the ridge has not been “absent,” merely displaced.)
As the ITCZ has migrated northward over time, the pattern has allowed a very warm MDR/Caribbean to take shape, with warmth gradually migrating from the subtropics and equatorial region(s) to the tropics. This is taking place in earnest as I write, assuming a disturbing resemblance to 2010: warmth extending southward from the Canadian Maritimes, a cool(-ing) subtropics, and a very warm MDR/Caribbean/Gulf. Therefore, owing to these factors, we could see a very pronounced +AMO in conjunction with a very strong Bermuda High by ASO, owing to the position of the synoptic features relative to normal as well as the very wet Sahel (strong WAM/AEJ) combined with cool neutral ENSO/weak La Niña.
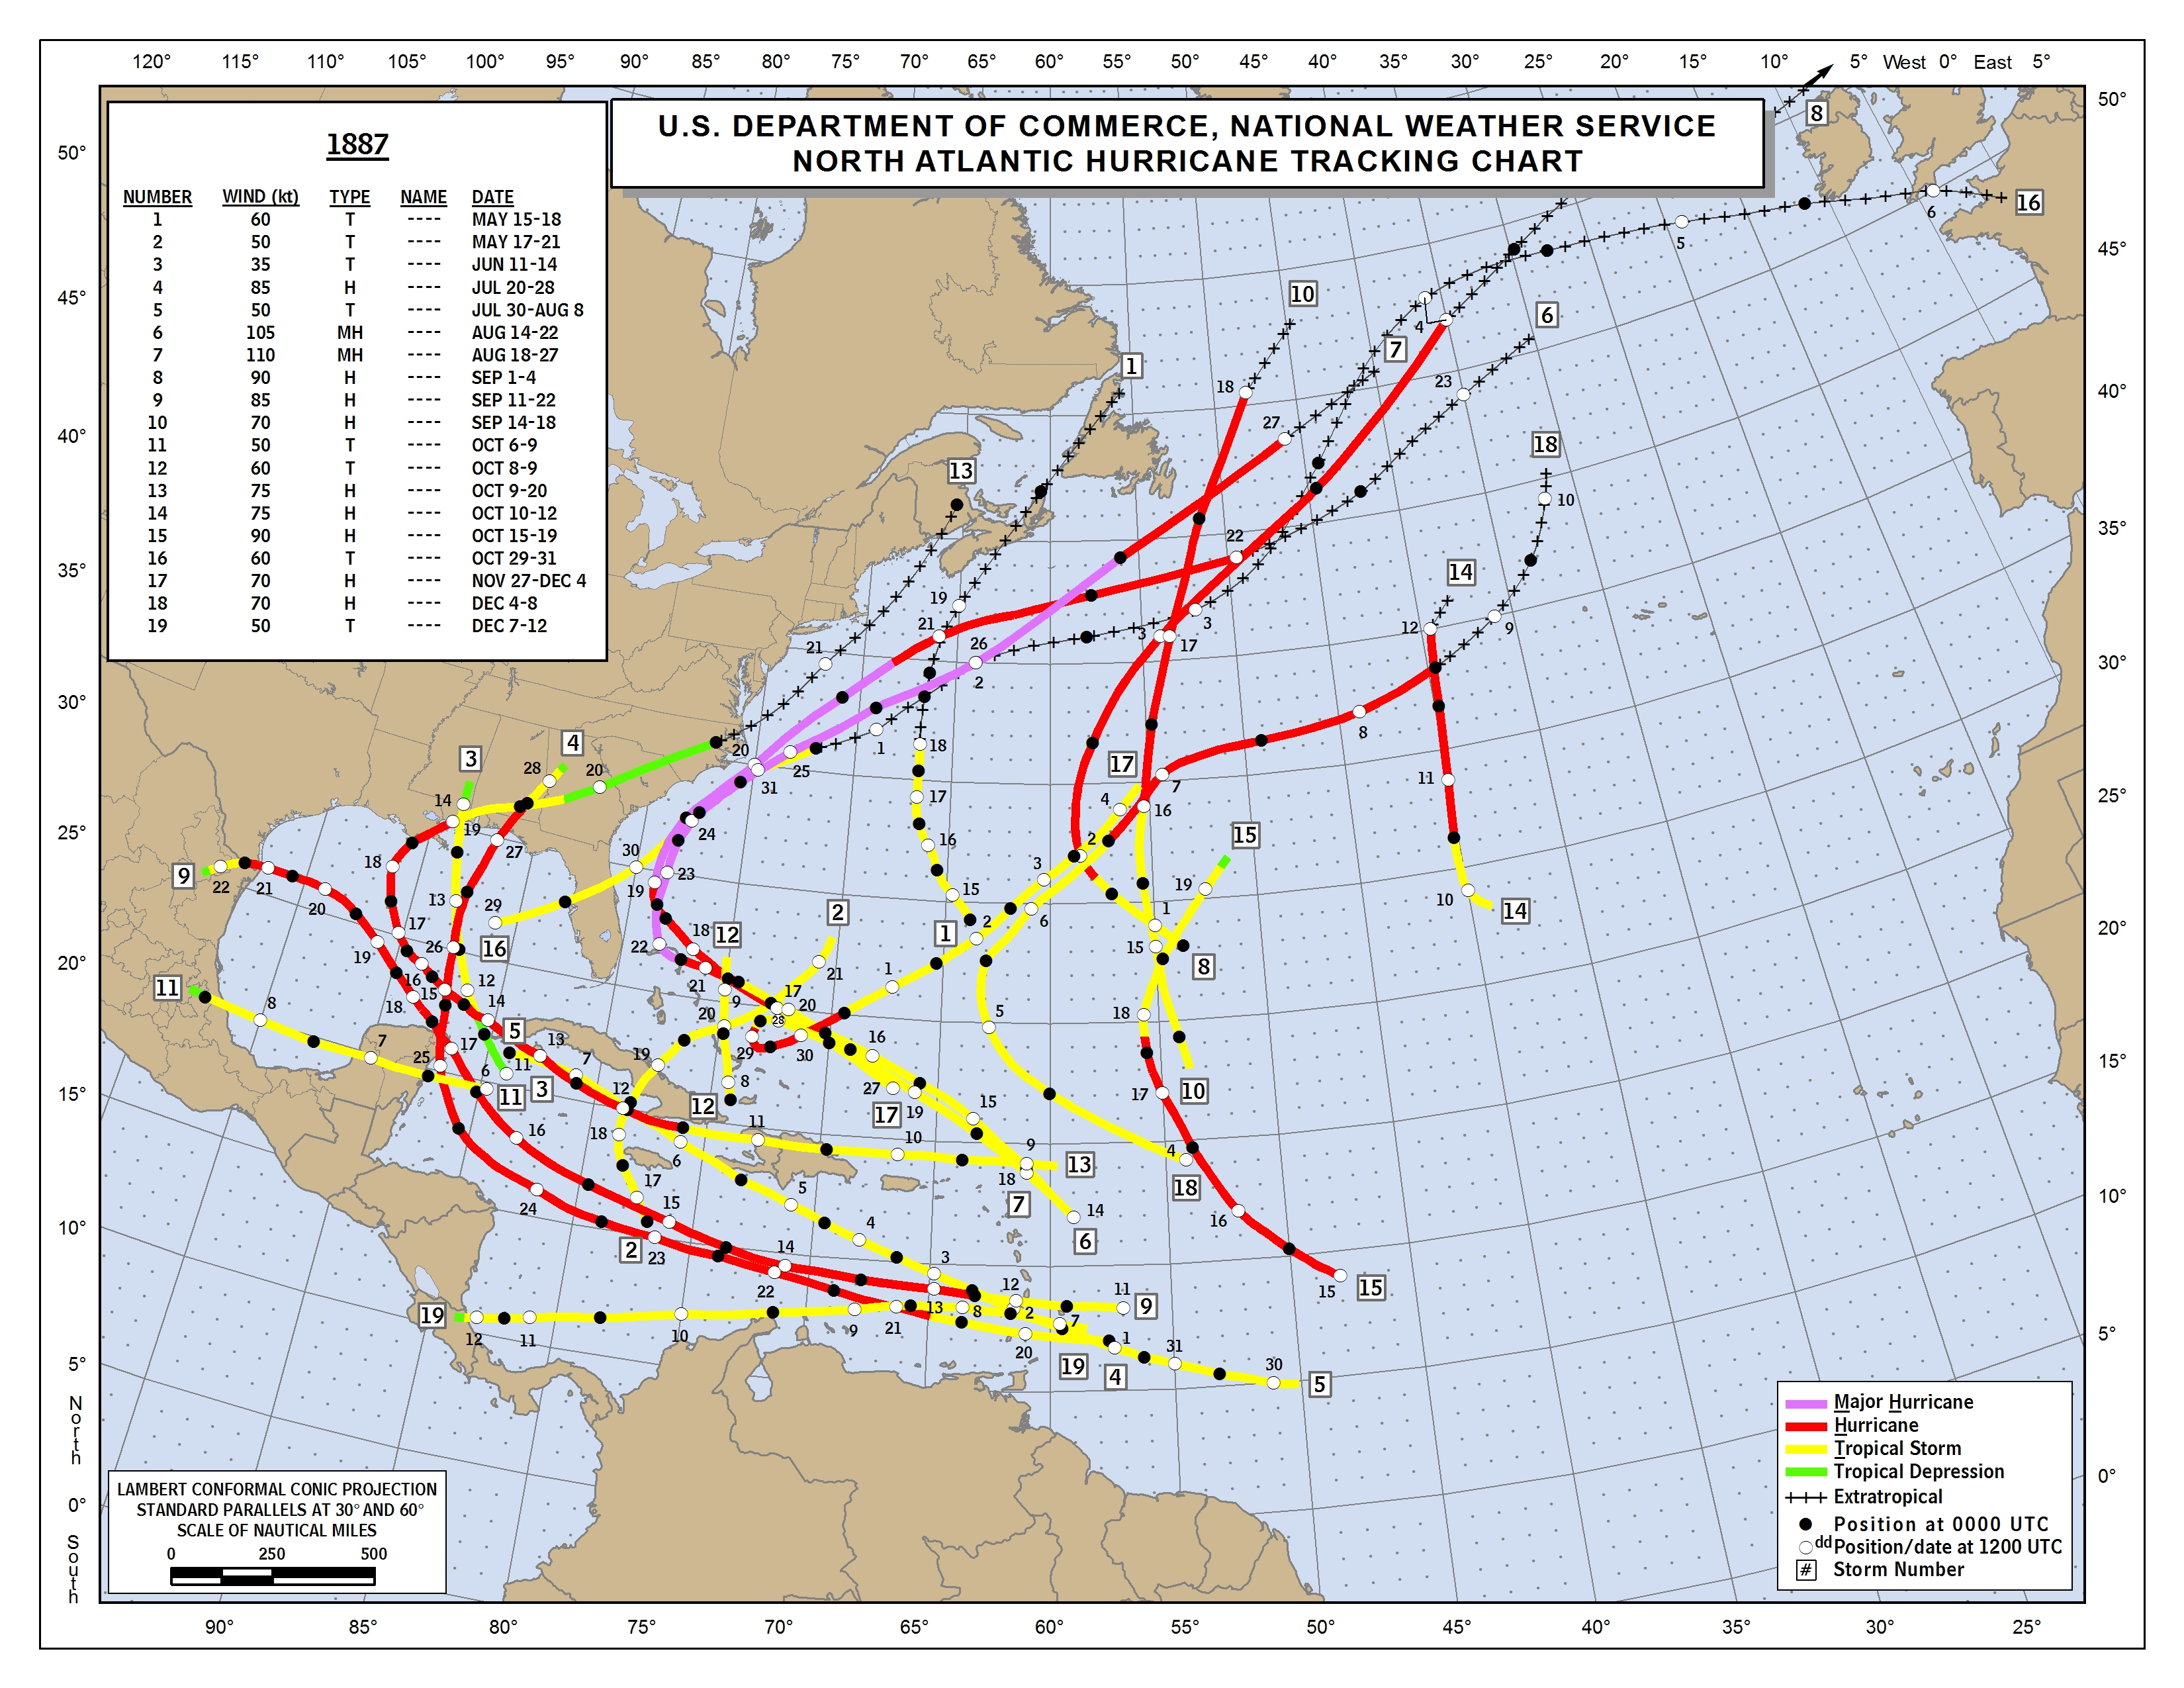
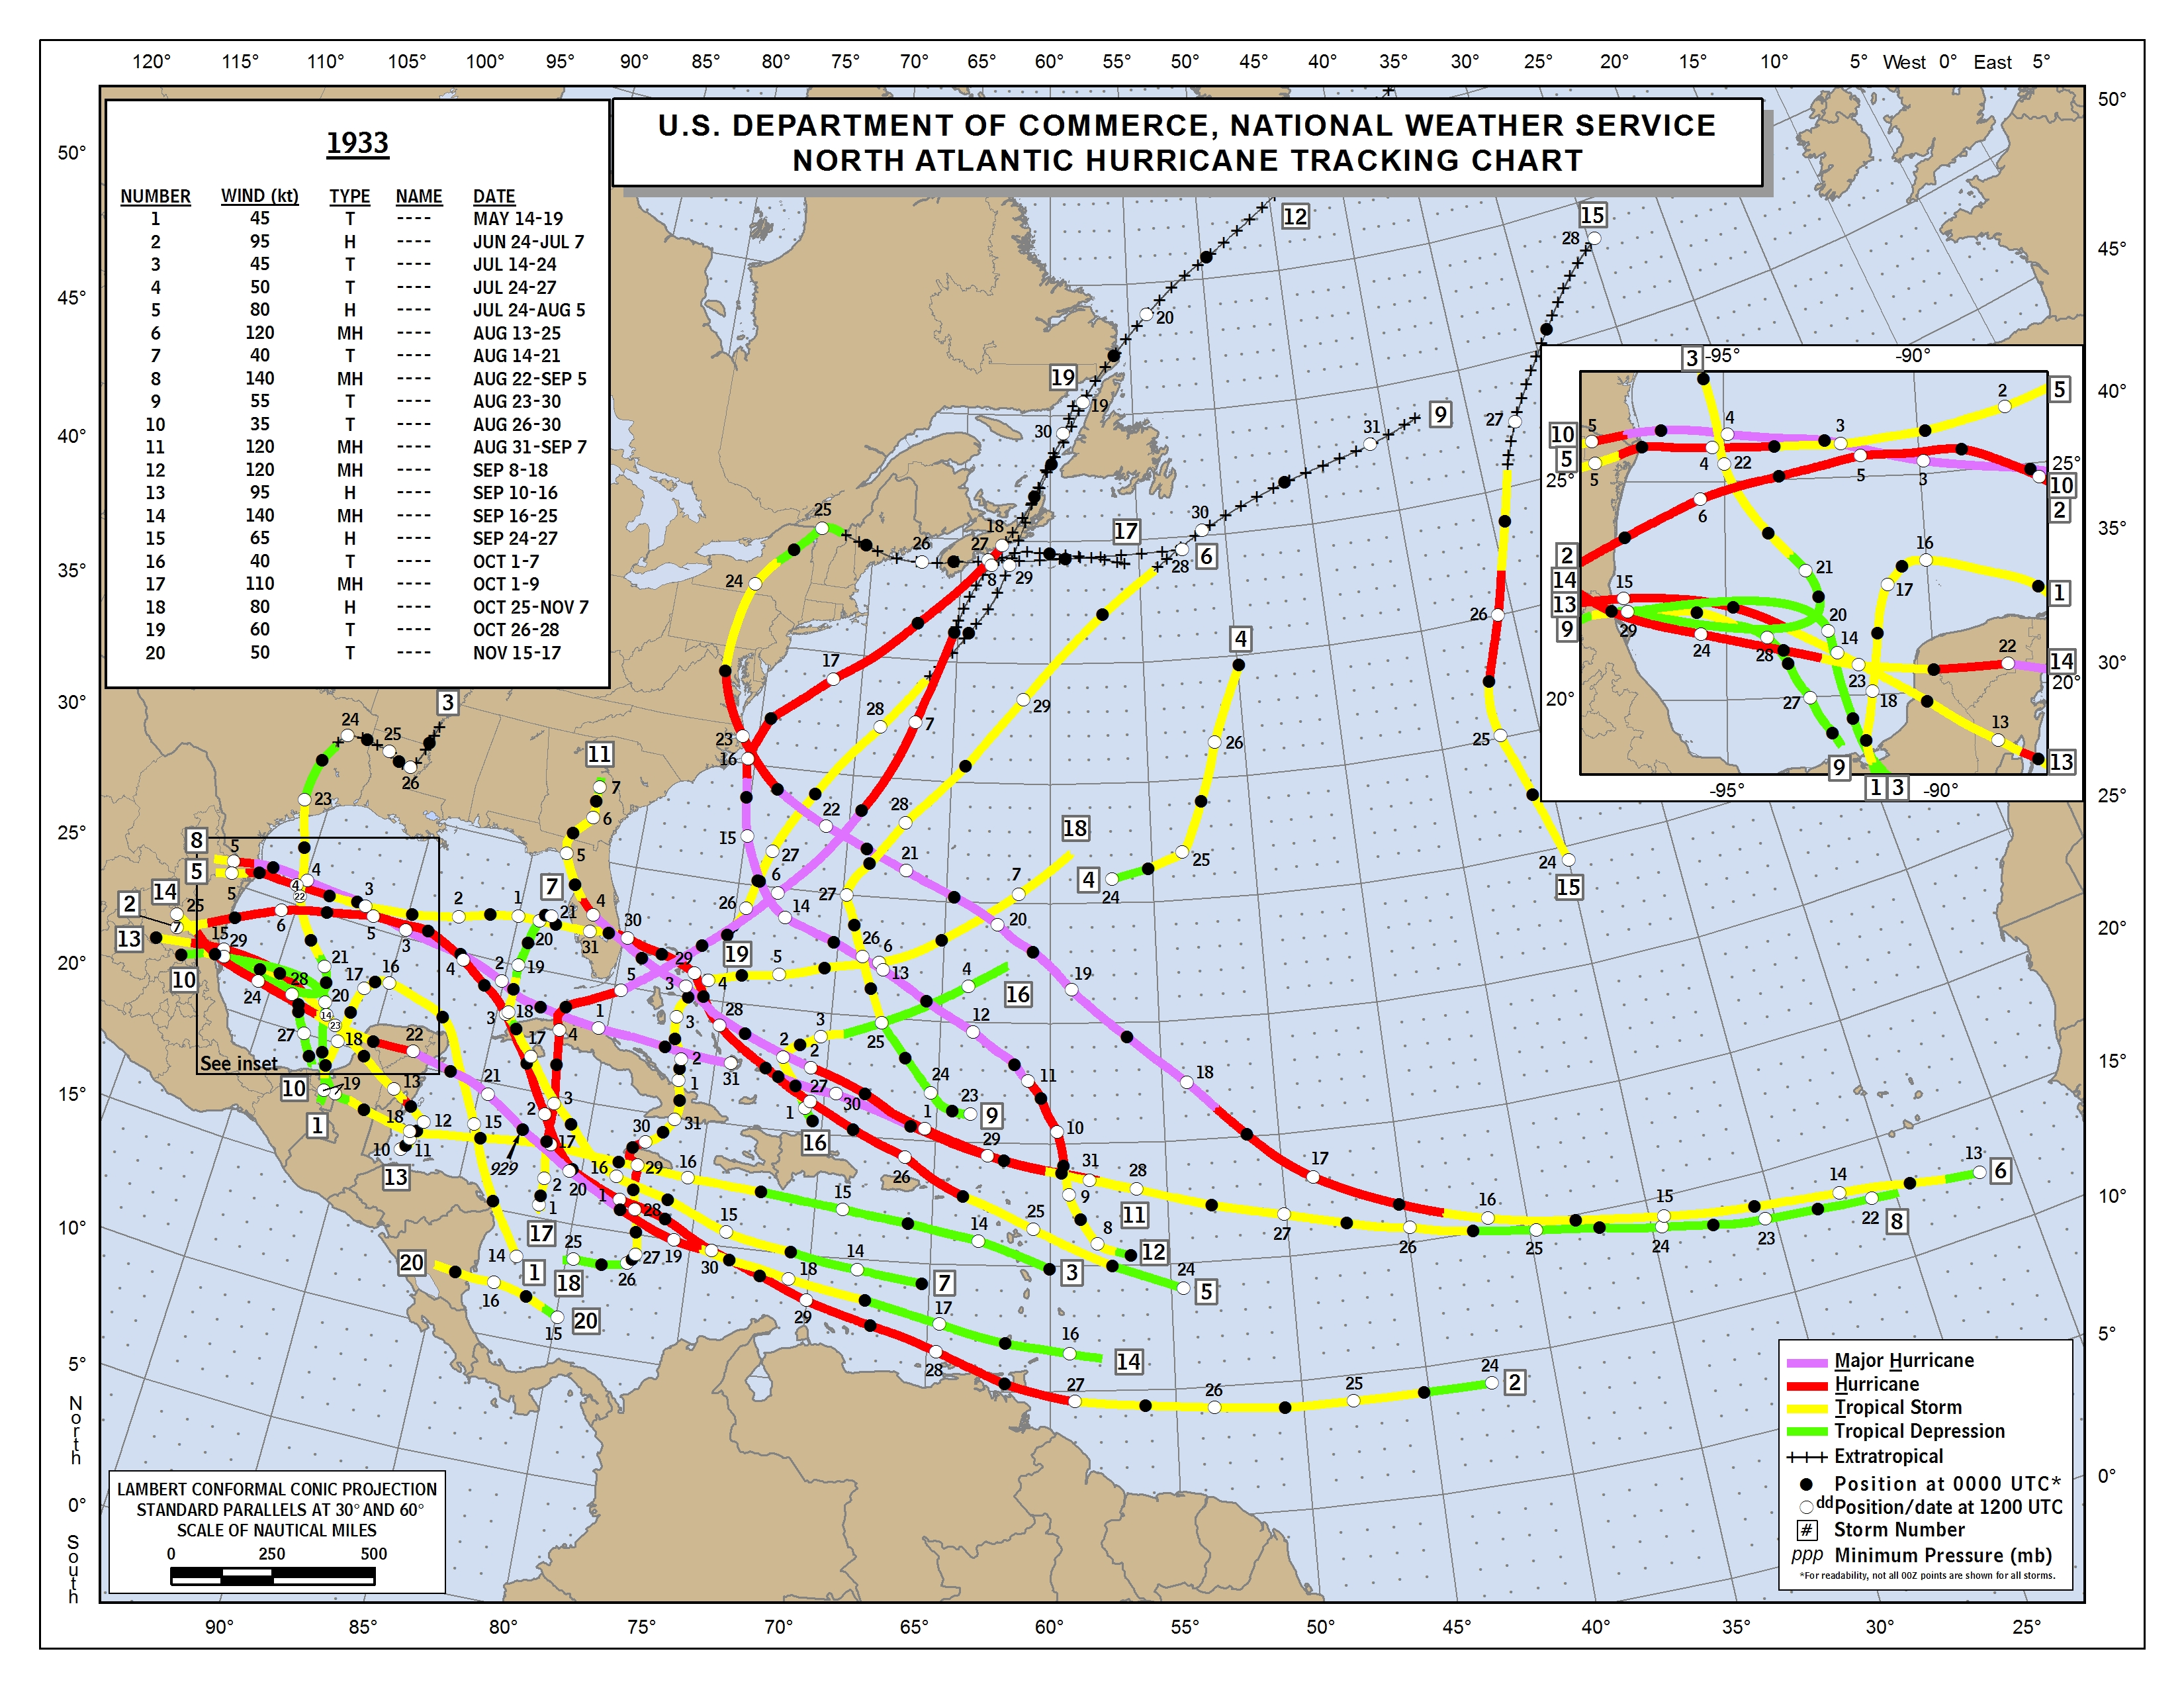
In other words, all the factors may align to produce the maximum possible number of NS, ACE, and landfalls—not as many NS as in 2005, but on par with 1887 or 1933, with near-record ACE and a lot of westward tracks. I’m thinking nineteen to twenty NS, ten to thirteen hurricanes, and six to eight major hurricanes, along with an ACE index of 230-260, with enhanced MH landfall risk in the Yucatán/Tamaulipas, Mississippi River Delta (NOLA), South Florida, the southern Bahamas/TCI, Hispaniola, and the northeastern Caribbean, including Puerto Rico and the USVI. Florida and the northern Gulf Coast look to face quite a season, along with Mexico and the Leeward Islands.
As the ITCZ has migrated northward over time, the pattern has allowed a very warm MDR/Caribbean to take shape, with warmth gradually migrating from the subtropics and equatorial region(s) to the tropics. This is taking place in earnest as I write, assuming a disturbing resemblance to 2010: warmth extending southward from the Canadian Maritimes, a cool(-ing) subtropics, and a very warm MDR/Caribbean/Gulf. Therefore, owing to these factors, we could see a very pronounced +AMO in conjunction with a very strong Bermuda High by ASO, owing to the position of the synoptic features relative to normal as well as the very wet Sahel (strong WAM/AEJ) combined with cool neutral ENSO/weak La Niña.
In other words, all the factors may align to produce the maximum possible number of NS, ACE, and landfalls—not as many NS as in 2005, but on par with 1887 or 1933, with near-record ACE and a lot of westward tracks. I’m thinking nineteen to twenty NS, ten to thirteen hurricanes, and six to eight major hurricanes, along with an ACE index of 230-260, with enhanced MH landfall risk in the Yucatán/Tamaulipas, Mississippi River Delta (NOLA), South Florida, the southern Bahamas/TCI, Hispaniola, and the northeastern Caribbean, including Puerto Rico and the USVI. Florida and the northern Gulf Coast look to face quite a season, along with Mexico and the Leeward Islands.
2 likes
CVW / MiamiensisWx / Shell Mound
The posts in this forum are NOT official forecasts and should not be used as such. They are just the opinion of the poster and may or may not be backed by sound meteorological data. They are NOT endorsed by any professional institution or STORM2K. For official information, please refer to products from the NHC and NWS.
-
SFLcane

- S2K Supporter

- Posts: 10281
- Age: 48
- Joined: Sat Jun 05, 2010 1:44 pm
- Location: Lake Worth Florida
Re: 2020 Indicators: SST's / SAL / MSLP / Steering / Shear / Instability / Sat Images
Like i said enjoy these next 2-3 weeks folks. From our very own wxman57 
https://twitter.com/TropicsWatch/status/1273609059833458692
https://twitter.com/TropicsWatch/status/1273609059833458692
0 likes

Re: 2020 Indicators: SST's / SAL / MSLP / Steering / Shear / Instability / Sat Images
That is indeed one heck of a dust outbreak over on the eastern Atlantic, it will be all over the eastern Caribbean by early next week. I wish this model would go past 5 days, but judging by the size of it I am sure it will get to the western Caribbean and GOM later in the week.


0 likes
-
TheStormExpert
Re: 2020 Indicators: SST's / SAL / MSLP / Steering / Shear / Instability / Sat Images
SFLcane wrote:Like i said enjoy these next 2-3 weeks folks. From our very own wxman57
https://twitter.com/TropicsWatch/status/1273609059833458692
Looks like it has the same error that the other site has.
1 likes
-
NotSparta

- Professional-Met
- Posts: 1677
- Age: 24
- Joined: Fri Aug 18, 2017 8:24 am
- Location: Naples, FL
- Contact:
Re: 2020 Indicators: SST's / SAL / MSLP / Steering / Shear / Instability / Sat Images
SFLcane wrote:Like i said enjoy these next 2-3 weeks folks. From our very own wxman57
https://twitter.com/TropicsWatch/status/1273609059833458692
Majorly bugged map, actual OHC is pretty high but that gradient is impossible. I believe the data source has bad data with the 26°C depth causing erroneous values
4 likes
This post was probably an opinion of mine, and in no way is official. Please refer to http://www.hurricanes.gov for official tropical analysis and advisories.
My website, with lots of tropical wx graphics, including satellite and recon: http://cyclonicwx.com
My website, with lots of tropical wx graphics, including satellite and recon: http://cyclonicwx.com
-
toad strangler

- S2K Supporter
- Posts: 4546
- Joined: Sun Jul 28, 2013 3:09 pm
- Location: Earth
- Contact:
-
toad strangler
- S2K Supporter
- Posts: 4546
- Joined: Sun Jul 28, 2013 3:09 pm
- Location: Earth
- Contact:
Re: 2020 Indicators: SST's / SAL / MSLP / Steering / Shear / Instability / Sat Images
SAL watch ... as 'Tis the season ...next wave after this robust burst modeled to be weaker
http://twitter.com/RyanMaue/status/1273601949859024902
http://twitter.com/RyanMaue/status/1273601949859024902
0 likes
My Weather Station
https://www.wunderground.com/dashboard/pws/KFLPORTS603
https://www.wunderground.com/dashboard/pws/KFLPORTS603
-
toad strangler
- S2K Supporter
- Posts: 4546
- Joined: Sun Jul 28, 2013 3:09 pm
- Location: Earth
- Contact:
-
toad strangler
- S2K Supporter
- Posts: 4546
- Joined: Sun Jul 28, 2013 3:09 pm
- Location: Earth
- Contact:
-
cycloneye

- Admin

- Posts: 149430
- Age: 69
- Joined: Thu Oct 10, 2002 10:54 am
- Location: San Juan, Puerto Rico
Re: 2020 Indicators: SST's / SAL / MSLP / Steering / Shear / Instability / Sat Images
0 likes
Visit the Caribbean-Central America Weather Thread where you can find at first post web cams,radars
and observations from Caribbean basin members Click Here
and observations from Caribbean basin members Click Here
-
gatorcane

- S2K Supporter
- Posts: 23708
- Age: 48
- Joined: Sun Mar 13, 2005 3:54 pm
- Location: Boca Raton, FL
Re: 2020 Indicators: SST's / SAL / MSLP / Steering / Shear / Instability / Sat Images
So no doubt it looks to be shaping up to be an above normal season. But keep in mind we could end up with something like 2010 where we had slot of Cape Verde storms that recurved due to a weak/displaced Bermuda High and weakness over the Central Atlantic.
So far the Bermuda High has been displaced either south or way to the NE in the Atlantic allowing southerly and southwesterly flow across Florida. Even the big SAL surge will likely stay south over the Caribbean. This pattern is quite a bit different than 2015-2018 where SAL impacted Florida in June due to deep-layer easterly windflow.
One has to think that Florida and SE US might need to look to the south this year as this could be a year the Caribbean cranks out some significant hurricanes.
0 likes
-
SFLcane
- S2K Supporter
- Posts: 10281
- Age: 48
- Joined: Sat Jun 05, 2010 1:44 pm
- Location: Lake Worth Florida
Re: 2020 Indicators: SST's / SAL / MSLP / Steering / Shear / Instability / Sat Images
gatorcane wrote:So no doubt it looks to be shaping up to be an above normal season. But keep in mind we could end up with something like 2010 where we had slot of Cape Verde storms that recurved due to a weak/displaced Bermuda High and weakness over the Central Atlantic.
So far the Bermuda High has been displaced either south or way to the NE in the Atlantic allowing southerly and southwesterly flow across Florida. Even the big SAL surge will likely stay south over the Caribbean. This pattern is quite a bit different than 2015-2018 where SAL impacted Florida in June due to deep-layer easterly windflow.
One has to think that Florida and SE US might need to look to the south this year as this could be a year the Caribbean cranks out some significant hurricanes.
Gatorcane, On the contrary I have heard and seen the opposite. Infact i think the Caribbean In particularly is in for a rough season. I also think Florida is in the crosshairs. Euro model is predicting a stronger then normal Bermuda high for ASO. Going to be a longgggg season I would not be surprised to see 1-3 named storms in July maybe even some hurricanes before the lid really comes off in Aug. one key thing i always look at is the background state which is going to be quite favorable and instability is up this season which these storms need to get going. If the mdr can stay warm that alone is a precursor to a possibly busy to hyperactive yr. we shall see
Last edited by SFLcane on Thu Jun 18, 2020 11:24 am, edited 1 time in total.
1 likes
-
toad strangler
- S2K Supporter
- Posts: 4546
- Joined: Sun Jul 28, 2013 3:09 pm
- Location: Earth
- Contact:
Re: 2020 Indicators: SST's / SAL / MSLP / Steering / Shear / Instability / Sat Images
gatorcane wrote:So no doubt it looks to be shaping up to be an above normal season. But keep in mind we could end up with something like 2010 where we had slot of Cape Verde storms that recurved due to a weak/displaced Bermuda High and weakness over the Central Atlantic.
So far the Bermuda High has been displaced either south or way to the NE in the Atlantic allowing southerly and southwesterly flow across Florida. Even the big SAL surge will likely stay south over the Caribbean. This pattern is quite a bit different than 2015-2018 where SAL impacted Florida in June due to deep-layer easterly windflow.
One has to think that Florida and SE US might need to look to the south this year as this could be a year the Caribbean cranks out some significant hurricanes.
Awesome thoughts gator, what are your thoughts on the chances the BH stays in roughly this displaced configuration for another two solid months before real prime time starts in mid August?
0 likes
My Weather Station
https://www.wunderground.com/dashboard/pws/KFLPORTS603
https://www.wunderground.com/dashboard/pws/KFLPORTS603
-
WeatherEmperor
- S2K Supporter
- Posts: 4806
- Age: 42
- Joined: Thu Sep 04, 2003 2:54 pm
- Location: South Florida
Re: 2020 Indicators: SST's / SAL / MSLP / Steering / Shear / Instability / Sat Images
gatorcane wrote:So no doubt it looks to be shaping up to be an above normal season. But keep in mind we could end up with something like 2010 where we had slot of Cape Verde storms that recurved due to a weak/displaced Bermuda High and weakness over the Central Atlantic.
So far the Bermuda High has been displaced either south or way to the NE in the Atlantic allowing southerly and southwesterly flow across Florida. Even the big SAL surge will likely stay south over the Caribbean. This pattern is quite a bit different than 2015-2018 where SAL impacted Florida in June due to deep-layer easterly windflow.
One has to think that Florida and SE US might need to look to the south this year as this could be a year the Caribbean cranks out some significant hurricanes.
Gator, I want to tell you something. In April 2017, I started getting this weird feeling in my stomach. I felt this need to watch Hurricane Andrew videos on Youtube from TWC. I watched John Hope discuss Andrew in legendary fashion. I just couldnt stop watching the videos over and over because I had this weird feeling that months later a Category 5 hurricane would be staring down South Florida and as we all know, Irma threatened South Florida as a Cat 5 and that brought flashbacks to me having this funny feeling 5 months before Irma hit. Luckily, SE Florida dodged a major bullet but my gut was right...something was gonna come for South Florida.
Fast forward to 2020, and I developed another one of those gut feelings. This time, I am constantly drawn to Hurricane Wilma and Hurricane Irene (1999) videos on Youtube. I cant stop watching them. I have this deep feeling in my gut that Florida will get hit this year from a big hurricane coming from the SW Caribbean.
Maybe I am just being silly, but my gut feeling was right in 2017 and I fear it may be right again in 2020. The pattern and atmosphere just seem to be screaming for a FL hit from the Caribbean this year
Sent from my iPhone using Tapatalk
2 likes


Re: 2020 Indicators: SST's / SAL / MSLP / Steering / Shear / Instability / Sat Images
What’s worse (not lending any credence, but) I’ve also been watching those too 0-0. The Western Caribbean seems more primed than ever, and in some of the seasonal modeling showing a much wetter pattern heading over Cuba, the Florida Peninsula, and to an extent the NW Bahamas. We’ll see come November 30.
0 likes
-
storminabox
- Category 1

- Posts: 263
- Joined: Sun Jul 09, 2017 10:50 pm
Re: 2020 Indicators: SST's / SAL / MSLP / Steering / Shear / Instability / Sat Images
gatorcane wrote:So no doubt it looks to be shaping up to be an above normal season. But keep in mind we could end up with something like 2010 where we had slot of Cape Verde storms that recurved due to a weak/displaced Bermuda High and weakness over the Central Atlantic.
So far the Bermuda High has been displaced either south or way to the NE in the Atlantic allowing southerly and southwesterly flow across Florida. Even the big SAL surge will likely stay south over the Caribbean. This pattern is quite a bit different than 2015-2018 where SAL impacted Florida in June due to deep-layer easterly windflow.
One has to think that Florida and SE US might need to look to the south this year as this could be a year the Caribbean cranks out some significant hurricanes.
Its been awhile since we have seen an active season in the Carribean (South of the islands). This year looks like it could break the quiet streak in the Caribbean that has been ongoing since at least the 2015 Super Niño. There is certainly tons of warm water to be taken advantage of.
1 likes
Who is online
Users browsing this forum: No registered users and 63 guests