2020 Indicators: SST's / SAL / MSLP / Steering / Shear / Instability / Sat Images
Moderator: S2k Moderators
Forum rules

The posts in this forum are NOT official forecasts and should not be used as such. They are just the opinion of the poster and may or may not be backed by sound meteorological data. They are NOT endorsed by any professional institution or STORM2K. For official information, please refer to products from the National Hurricane Center and National Weather Service.
-
CyclonicFury

- Category 5

- Posts: 2033
- Age: 27
- Joined: Sun Jul 02, 2017 12:32 pm
- Location: NC
- Contact:
Re: 2020 Indicators: SST's / SAL / MSLP / Steering / Shear / Instability / Sat Images
The absolute no-no of the tropics: call season canceled over a SAL outbreak before August 15.
13 likes
NCSU B.S. in Meteorology Class of 2021. Tropical weather blogger at http://www.cyclonicfury.com. My forecasts and thoughts are NOT official, for official forecasts please consult the National Hurricane Center.
-
toad strangler

- S2K Supporter

- Posts: 4546
- Joined: Sun Jul 28, 2013 3:09 pm
- Location: Earth
- Contact:
Re: 2020 Indicators: SST's / SAL / MSLP / Steering / Shear / Instability / Sat Images
CyclonicFury wrote:I feel like SAL is the most overblown indicator when it comes to predicting Atlantic hurricane activity. Every single year there are several SAL outbreaks from June to August. Around August 20 or so, SAL begins to retreat north and becomes less of a negative factor.
Even when SAL is present, that does not mean tropical cyclogenesis is present. If a system is small enough and shear is very low, it can mix out the dry air intrusions.
It's always something here. Last month it was minor neg SST anomalies in the MDR. This month it's SAL. Which is prevalent every year. Even more recent it's SAL killing SST's
5 likes
My Weather Station
https://www.wunderground.com/dashboard/pws/KFLPORTS603
https://www.wunderground.com/dashboard/pws/KFLPORTS603
-
TheStormExpert
Re: 2020 Indicators: SST's / SAL / MSLP / Steering / Shear / Instability / Sat Images
toad strangler wrote:TheStormExpert wrote:Some good news if it were to persist!
https://twitter.com/andyhazelton/status/1276532280043941890
I don't know about you but I'm not here is see slow years. I'm here to see as many storms spin up as possible because they are fun to track and observe. I just hope they stay away from population.
Same here, just trying to be hopeful in this stressful year if you know what I mean.
1 likes
-
TheStormExpert
Re: 2020 Indicators: SST's / SAL / MSLP / Steering / Shear / Instability / Sat Images
CyclonicFury wrote:The absolute no-no of the tropics: call season canceled over a SAL outbreak before August 15.
Season Cancelled!!
JK!
4 likes
-
Kingarabian

- S2K Supporter
- Posts: 16360
- Joined: Sat Aug 08, 2009 3:06 am
- Location: Honolulu, Hawaii
Re: 2020 Indicators: SST's / SAL / MSLP / Steering / Shear / Instability / Sat Images
Regardless, the fact that the models continue to push out TC's wherever possible in the Atlantic is a cause for concern.
6 likes
RIP Kobe Bryant
-
tarheelprogrammer

- S2K Supporter
- Posts: 1793
- Joined: Mon Mar 28, 2016 9:25 pm
- Location: Raleigh, NC area (Garner, NC)
Re: 2020 Indicators: SST's / SAL / MSLP / Steering / Shear / Instability / Sat Images
One thing to note, years that were hyper active are a mixed bag.
2005 and 1933 for example were early starts to the season
While 2004 and 2017 kind of got going later on
I know quite a bit of comparisons were made to 2005 and 1933 but I believe those comparisons are incorrect. If the season is hyper active it is likely going to look a lot like 2004 or 2017. Just my thoughts on everything. I still like my original numbers of 20/9/5 ACE: 210
At least for now that is
2 likes
My posts are not official forecasts. They are just my opinion and may or may not be backed by sound meteorological data. They are NOT endorsed by any professional institution or storm2k.org. For official information, please refer to the NHC and NWS products.

Re: 2020 Indicators: SST's / SAL / MSLP / Steering / Shear / Instability / Sat Images
AutoPenalti wrote:BYG Jacob wrote:The SAL talk has been obnoxious this year
Record breaking sand plume. No surprises there.
Word. We aren’t being choked by it, but it’s the most SAL influence I’ve ever noticed in New Orleans.
2 likes

Re: 2020 Indicators: SST's / SAL / MSLP / Steering / Shear / Instability / Sat Images
I'm here in Central Florida. It's a bit hazy but, no need to send the Coast Guard or FEMA Government rations. Call me a crack-pot optimist but I think we're gonna find some way to survive it 
4 likes
Andy D
(For official information, please refer to the NHC and NWS products.)
(For official information, please refer to the NHC and NWS products.)
Re: 2020 Indicators: SST's / SAL / MSLP / Steering / Shear / Instability / Sat Images
toad strangler wrote:CyclonicFury wrote:I feel like SAL is the most overblown indicator when it comes to predicting Atlantic hurricane activity. Every single year there are several SAL outbreaks from June to August. Around August 20 or so, SAL begins to retreat north and becomes less of a negative factor.
Even when SAL is present, that does not mean tropical cyclogenesis is present. If a system is small enough and shear is very low, it can mix out the dry air intrusions.
It's always something here. Last month it was minor neg SST anomalies in the MDR. This month it's SAL. Which is prevalent every year. Even more recent it's SAL killing SST'sAlmost evey indication I've seen shows warming going forward. We'll see.
'It's Always something here. This month it's SAL' : Yeah well of course it's always something, what else would we talk about
1 likes
-
toad strangler
- S2K Supporter
- Posts: 4546
- Joined: Sun Jul 28, 2013 3:09 pm
- Location: Earth
- Contact:
Re: 2020 Indicators: SST's / SAL / MSLP / Steering / Shear / Instability / Sat Images
Visioen wrote:toad strangler wrote:CyclonicFury wrote:I feel like SAL is the most overblown indicator when it comes to predicting Atlantic hurricane activity. Every single year there are several SAL outbreaks from June to August. Around August 20 or so, SAL begins to retreat north and becomes less of a negative factor.
Even when SAL is present, that does not mean tropical cyclogenesis is present. If a system is small enough and shear is very low, it can mix out the dry air intrusions.
It's always something here. Last month it was minor neg SST anomalies in the MDR. This month it's SAL. Which is prevalent every year. Even more recent it's SAL killing SST's
'It's Always something here. This month it's SAL' : Yeah well of course it's always something, what else would we talk about
You missed the context by like 18 miles. But all good. What evs
2 likes
My Weather Station
https://www.wunderground.com/dashboard/pws/KFLPORTS603
https://www.wunderground.com/dashboard/pws/KFLPORTS603
Re: 2020 Indicators: SST's / SAL / MSLP / Steering / Shear / Instability / Sat Images
toad strangler wrote:Visioen wrote:toad strangler wrote:
It's always something here. Last month it was minor neg SST anomalies in the MDR. This month it's SAL. Which is prevalent every year. Even more recent it's SAL killing SST's
'It's Always something here. This month it's SAL' : Yeah well of course it's always something, what else would we talk about
You missed the context by like 18 miles. But all good. What evs
Lol it appears I did
0 likes
-
cycloneye

- Admin

- Posts: 149431
- Age: 69
- Joined: Thu Oct 10, 2002 10:54 am
- Location: San Juan, Puerto Rico
Re: 2020 Indicators: SST's / SAL / MSLP / Steering / Shear / Instability / Sat Images
2 likes
Visit the Caribbean-Central America Weather Thread where you can find at first post web cams,radars
and observations from Caribbean basin members Click Here
and observations from Caribbean basin members Click Here

Re: 2020 Indicators: SST's / SAL / MSLP / Steering / Shear / Instability / Sat Images
cycloneye wrote:https://twitter.com/MichaelRLowry/status/1276878881430142977
The only two seasons in the top 10 list that weren’t hyperactive are 1987 (activity suppressed due to an El Niño) and 2013 (when the THC decided to just die). June MDR SSTs this year are also higher than 2016, 2018, and 2019, and are comparable to seasons like 1998 and 2017.
2 likes
Irene '11 Sandy '12 Hermine '16 5/15/2018 Derecho Fay '20 Isaias '20 Elsa '21 Henri '21 Ida '21
I am only a meteorology enthusiast who knows a decent amount about tropical cyclones. Look to the professional mets, the NHC, or your local weather office for the best information.
I am only a meteorology enthusiast who knows a decent amount about tropical cyclones. Look to the professional mets, the NHC, or your local weather office for the best information.
-
Shell Mound
- Category 5
- Posts: 2432
- Age: 33
- Joined: Thu Sep 07, 2017 3:39 pm
- Location: St. Petersburg, FL → Scandinavia
Re: 2020 Indicators: SST's / SAL / MSLP / Steering / Shear / Instability / Sat Images
AutoPenalti wrote:Shell Mound wrote:CyclonicFury wrote:A few days ago it wasn't showing that. Also, shear is below normal in the Caribbean, not quite El Niño like.
Why do you think the most recent runs have shifted toward a much stronger TUTT over the MDR? Regarding tracks, the CFSv2 has been quite consistent, along with the UKMET and ECMWF, in suggesting that the highest precipitation stays just offshore of the Southeastern U.S. during ASO. As I mentioned, the ridge, while quite strong, is consistently forecast by the major global models to be displaced too far to the north, allowing TUTT-related weaknesses underneath that allow prospective storms to curve just east of the Southeastern U.S., so the precipitation bands do not penetrate very far inland from the immediate coastline. The long-range dynamical models have been very consistent about this over the past month or so. What could cause this to change?AutoPenalti wrote:Please don't use CFS for predicting future tracks.
The UKMET and ECMWF have been showing similar precipitation patterns over the past several runs.
Precipitation patterns don't equate to potential tracks from what I understand.
According to this meteorologist (Dr. Richard James of World Climate Service), they do, since he uses the EC precipitation field to hint at tracks:
https://twitter.com/WorldClimateSvc/status/1270344884298416128
NMME has been quite consistent in showing the main TC tracks remaining either to the east or to the south of the mainland United States:


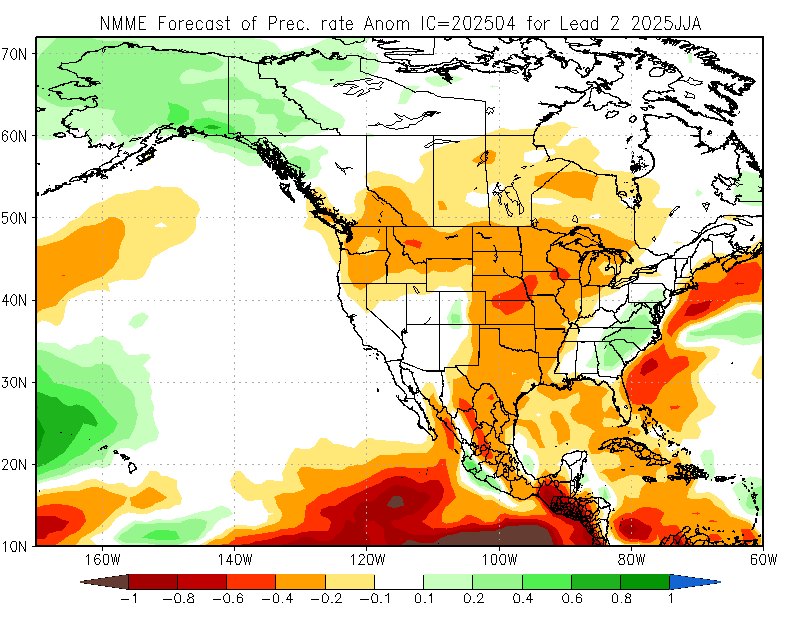
Note that the latest run (last image) shows above-average precipitation barely skirting the U.S. coastline, marking a SE shift from earlier runs. The Gulf Coast is much drier, the heaviest precipitation occurs from the Bahamas northward (in the subtropics), and there isn’t any hint of a westward component to the precipitation shield near the U.S. coastline. This means that the latest NMME forecast for ASO, based on a blend of several models, shows a strong ridge that is yet displaced too far to the north for storms to hit the U.S., so that both CV systems and late-season “homegrown” systems in the Caribbean miss the U.S. to the east and/or south.
0 likes
CVW / MiamiensisWx / Shell Mound
The posts in this forum are NOT official forecasts and should not be used as such. They are just the opinion of the poster and may or may not be backed by sound meteorological data. They are NOT endorsed by any professional institution or STORM2K. For official information, please refer to products from the NHC and NWS.
-
SFLcane

- S2K Supporter
- Posts: 10281
- Age: 48
- Joined: Sat Jun 05, 2010 1:44 pm
- Location: Lake Worth Florida
Re: 2020 Indicators: SST's / SAL / MSLP / Steering / Shear / Instability / Sat Images
Shell Mound wrote:AutoPenalti wrote:Shell Mound wrote:Why do you think the most recent runs have shifted toward a much stronger TUTT over the MDR? Regarding tracks, the CFSv2 has been quite consistent, along with the UKMET and ECMWF, in suggesting that the highest precipitation stays just offshore of the Southeastern U.S. during ASO. As I mentioned, the ridge, while quite strong, is consistently forecast by the major global models to be displaced too far to the north, allowing TUTT-related weaknesses underneath that allow prospective storms to curve just east of the Southeastern U.S., so the precipitation bands do not penetrate very far inland from the immediate coastline. The long-range dynamical models have been very consistent about this over the past month or so. What could cause this to change?
The UKMET and ECMWF have been showing similar precipitation patterns over the past several runs.
Precipitation patterns don't equate to potential tracks from what I understand.
According to this meteorologist (Dr. Richard James of World Climate Service), they do, since he uses the EC precipitation field to hint at tracks:
https://twitter.com/WorldClimateSvc/status/1270344884298416128
NMME has been quite consistent in showing the main TC tracks remaining either to the east or to the south of the mainland United States:
https://www.cpc.ncep.noaa.gov/products/NMME/archive/2020030800/current/images/NMME_ensemble_prate_us_season5.png
https://www.cpc.ncep.noaa.gov/products/NMME/archive/2020040800/current/images/NMME_ensemble_prate_us_season4.png
https://www.cpc.ncep.noaa.gov/products/NMME/archive/2020050800/current/images/NMME_ensemble_prate_us_season3.png
https://www.cpc.ncep.noaa.gov/products/NMME/current/images/NMME_ensemble_prate_us_season2.png
Note that the latest run (last image) shows above-average precipitation barely skirting the U.S. coastline, marking a SE shift from earlier runs. The Gulf Coast is much drier, the heaviest precipitation occurs from the Bahamas northward (in the subtropics), and there isn’t any hint of a westward component to the precipitation shield near the U.S. coastline. This means that the latest NMME forecast for ASO, based on a blend of several models, shows a strong ridge that is yet displaced too far to the north for storms to hit the U.S., so that both CV systems and late-season “homegrown” systems in the Caribbean miss the U.S. to the east and/or south.
I get it we have nothing to be concerned about this season. Trying to forecast seasonal tracks with precipitation is not ideal. 4-6 weeks to go before the REAL season starts.
5 likes
Re: 2020 Indicators: SST's / SAL / MSLP / Steering / Shear / Instability / Sat Images
Peninsular Florida looks wet in all of those depictions. For everyone else...those above normal anomalies are dangerously close and certainly shouldn't provide a sense of security. Beyond that...the Gulf coast and southeast US are normally pretty wet...You could easily squeeze in a hurricane (one that is moving) that drops 5-10" of rain and still have a normal or even somewhat below normal seasonal precip pattern if the rest of the summer yields some precip deficits. These places get lots of precip and the deck can easily be shuffled. If anything there's probably an argument to be made that below normal precip (and the resultant above normal temps and increased solar insolation) actually increases the hurricane danger to the coast by bumping water temps.. especially shelf water temps. That is exactly what happened in September 2018 over Florida and the eastern Gulf...which set the stage for Hurricane Michael..
2 likes
-
TheStormExpert
Re: 2020 Indicators: SST's / SAL / MSLP / Steering / Shear / Instability / Sat Images
Shell Mound wrote:AutoPenalti wrote:Shell Mound wrote:Why do you think the most recent runs have shifted toward a much stronger TUTT over the MDR? Regarding tracks, the CFSv2 has been quite consistent, along with the UKMET and ECMWF, in suggesting that the highest precipitation stays just offshore of the Southeastern U.S. during ASO. As I mentioned, the ridge, while quite strong, is consistently forecast by the major global models to be displaced too far to the north, allowing TUTT-related weaknesses underneath that allow prospective storms to curve just east of the Southeastern U.S., so the precipitation bands do not penetrate very far inland from the immediate coastline. The long-range dynamical models have been very consistent about this over the past month or so. What could cause this to change?
The UKMET and ECMWF have been showing similar precipitation patterns over the past several runs.
Precipitation patterns don't equate to potential tracks from what I understand.
According to this meteorologist (Dr. Richard James of World Climate Service), they do, since he uses the EC precipitation field to hint at tracks:
https://twitter.com/WorldClimateSvc/status/1270344884298416128
NMME has been quite consistent in showing the main TC tracks remaining either to the east or to the south of the mainland United States:
https://www.cpc.ncep.noaa.gov/products/NMME/archive/2020030800/current/images/NMME_ensemble_prate_us_season5.png
https://www.cpc.ncep.noaa.gov/products/NMME/archive/2020040800/current/images/NMME_ensemble_prate_us_season4.png
https://www.cpc.ncep.noaa.gov/products/NMME/archive/2020050800/current/images/NMME_ensemble_prate_us_season3.png
https://www.cpc.ncep.noaa.gov/products/NMME/current/images/NMME_ensemble_prate_us_season2.png
Note that the latest run (last image) shows above-average precipitation barely skirting the U.S. coastline, marking a SE shift from earlier runs. The Gulf Coast is much drier, the heaviest precipitation occurs from the Bahamas northward (in the subtropics), and there isn’t any hint of a westward component to the precipitation shield near the U.S. coastline. This means that the latest NMME forecast for ASO, based on a blend of several models, shows a strong ridge that is yet displaced too far to the north for storms to hit the U.S., so that both CV systems and late-season “homegrown” systems in the Caribbean miss the U.S. to the east and/or south.
Here you go again with this talk! It literally has the whole Florida peninsula covered in green. If anything this is real reason for concern especially after with what we saw last season with Dorian knocking on Florida’s doorstep and turning abruptly north only 100 miles offshore West Palm Beach. Hopefully you’re right because none of us want to deal with anymore than what we already have going on this year. But I rather be safe than sorry and prepare for the worst while hoping for the best.
0 likes

Re: 2020 Indicators: SST's / SAL / MSLP / Steering / Shear / Instability / Sat Images
tarheelprogrammer wrote:One thing to note, years that were hyper active are a mixed bag.
2005 and 1933 for example were early starts to the season
While 2004 and 2017 kind of got going later on
I know quite a bit of comparisons were made to 2005 and 1933 but I believe those comparisons are incorrect. If the season is hyper active it is likely going to look a lot like 2004 or 2017. Just my thoughts on everything. I still like my original numbers of 20/9/5 ACE: 210
At least for now that is
I'm thinking 2020 will be a balance between the two camps. Producing storms consistently with some early low-end canes unlike 2004/17, but not a harsh and intense early start like 2005.
2 likes
Kendall -> SLO -> PBC
Memorable Storms: Katrina (for its Florida landfall...) Wilma Matthew Irma
Memorable Storms: Katrina (for its Florida landfall...) Wilma Matthew Irma
-
jconsor
- Professional-Met

- Posts: 580
- Joined: Mon Jun 30, 2008 9:31 pm
- Location: Jerusalem, Israel
- Contact:
Re: 2020 Indicators: SST's / SAL / MSLP / Steering / Shear / Instability / Sat Images
Important context re: likely short-term SST trends in the Tropical Atlantic and ENSO region.
https://twitter.com/AndyHazelton/status/1276875504071704576
https://twitter.com/AndyHazelton/status/1276875504071704576
1 likes
-
jconsor
- Professional-Met
- Posts: 580
- Joined: Mon Jun 30, 2008 9:31 pm
- Location: Jerusalem, Israel
- Contact:
Re: 2020 Indicators: SST's / SAL / MSLP / Steering / Shear / Instability / Sat Images
Two additional Kelvin waves passing through the Atlantic MDR still showing up rather clearly in EPS velocity potential forecast - one late next week into next weekend, the other around Jul 10:


https://twitter.com/webberweather/status/1276467544619134977
https://twitter.com/webberweather/status/1276467544619134977
2 likes
Who is online
Users browsing this forum: Google Adsense [Bot] and 146 guests