2020 Indicators: SST's / SAL / MSLP / Steering / Shear / Instability / Sat Images

This is the general tropical discussion area. Anyone can take their shot at predicting a storms path.

Moderator: S2k Moderators

Forum rules

The posts in this forum are NOT official forecasts and should not be used as such. They are just the opinion of the poster and may or may not be backed by sound meteorological data. They are NOT endorsed by any professional institution or STORM2K. For official information, please refer to products from the National Hurricane Center and National Weather Service.

Help Support Storm2K
Message
Author
User avatar
NDG
S2K Supporter
S2K Supporter
Posts: 15446
Joined: Sun Jul 09, 2006 10:14 pm
Location: Orlando, FL

Re: 2020 Indicators: SST's / SAL / MSLP / Steering / Shear / Instability / Sat Images

#1941 Postby NDG » Mon Jul 27, 2020 12:03 pm

St0rmTh0r wrote:
NDG wrote:
tolakram wrote:To all who are criticizing the CFS post.

This IS the place to discuss what the longer range models are showing. You don't have to like it, but the proper response would be to discuss how the CFS has done in the past and not criticize a poster for discussing it. Telling us not to believe the long range models in a thread about discussing long range trends and models is a bit awkward, to say the least.


I agree, if we are going to disagree with a forecast and or model lets show our evidence.

Well the fact that 4 going on 5 storms have formed this month when the CFS predicted 1 is all the evidence we need.


Exactly my point, if we are going to say that model is trash, take time to explain why. I am in sales and most times I have to repeat features and benefits of a product like 100 times before people get it.
3 likes   

Shell Mound
Category 5
Category 5
Posts: 2434
Age: 32
Joined: Thu Sep 07, 2017 3:39 pm
Location: St. Petersburg, FL → Scandinavia

Re: 2020 Indicators: SST's / SAL / MSLP / Steering / Shear / Instability / Sat Images

#1942 Postby Shell Mound » Mon Jul 27, 2020 12:10 pm

Hammy wrote:
MarioProtVI wrote:I think we can all agree CFS is a garbage model to hold onto for season predictions especially considering the Atlantic cranked out two systems in a SUPPRESSED phase of the MJO, one of which was almost a Cat 2 and the other a fairly strong MDR TS in July which you don’t see very often and usually indicates a good possibility of a hyperactive season. Let’s revisit this CFS thing on November 30 and see where we stand since 2020 clearly does not want to abide by the rules of climatology :lol:


It's been accurate with trends but I'll agree that 2020 certainly isn't following the rules at all. :D

BYG Jacob wrote:Hugging the CFS is a weird hill to die on.


Once again, I post it here every few days during July/August as part of the discussion on the indicators. It's the same model that's used to predict precipitation and such on monthly basis.

What do the CFSv2 weeklies show in regard to Atlantic SST trends?
0 likes   
CVW / MiamiensisWx / Shell Mound
The posts in this forum are NOT official forecasts and should not be used as such. They are just the opinion of the poster and may or may not be backed by sound meteorological data. They are NOT endorsed by any professional institution or STORM2K. For official information, please refer to products from the NHC and NWS.

User avatar
gatorcane
S2K Supporter
S2K Supporter
Posts: 23691
Age: 47
Joined: Sun Mar 13, 2005 3:54 pm
Location: Boca Raton, FL

Re: 2020 Indicators: SST's / SAL / MSLP / Steering / Shear / Instability / Sat Images

#1943 Postby gatorcane » Mon Jul 27, 2020 1:05 pm

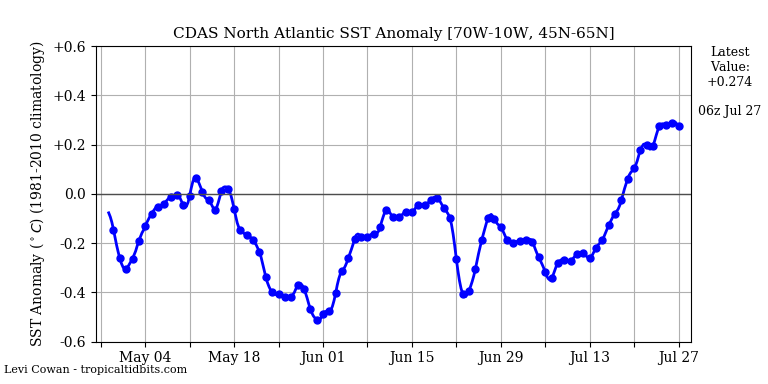
Interesting how the North Atlantic has warmed the past couple of weeks and now we see warmer than normal sst anomalies not just in the deep tropics but in the Northern Atlantic. Not sure if this heat distribution is a signature for a hyperactive rest of season. I would like to see a cooler than normal North subtropical Atlantic and a warmer than normal MDR

Image

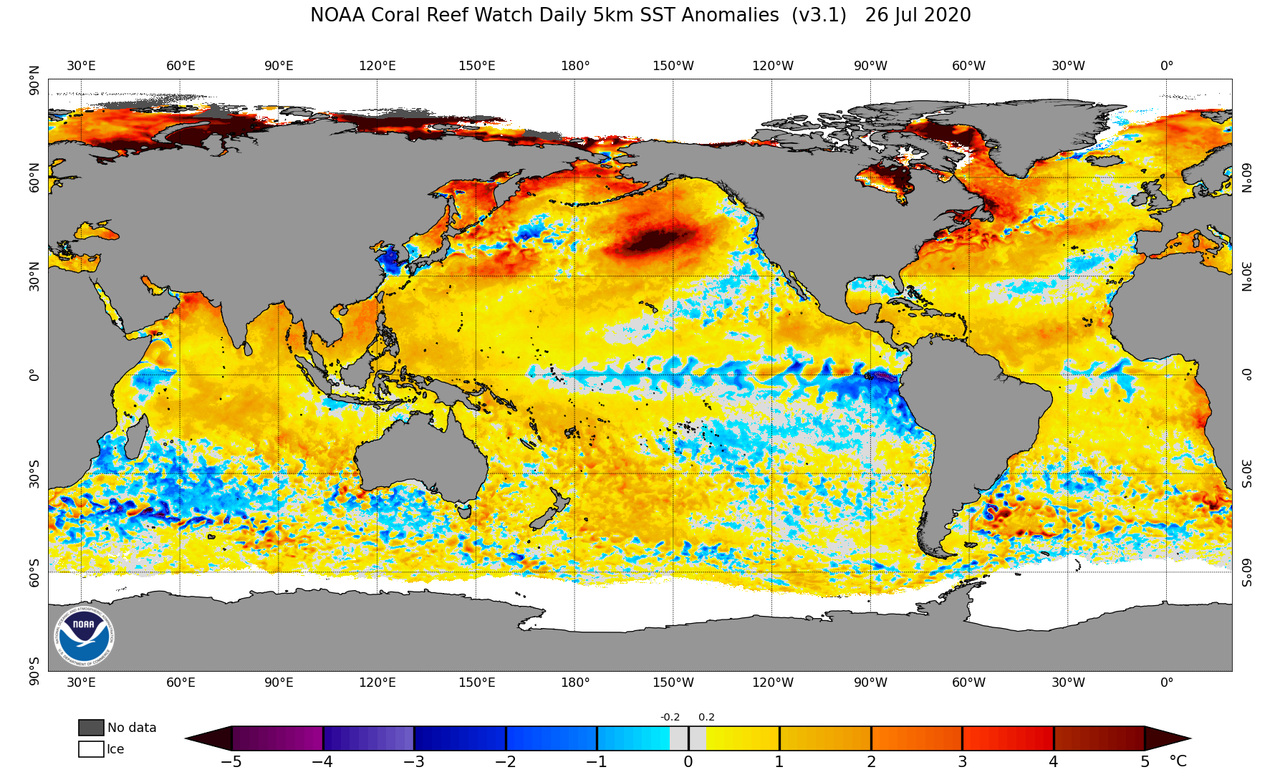
Also watching the area south of Mexico. Looks to be warming and that could induce a bit more shear over the Caribbean than we think if this trend continues.

Image
Last edited by gatorcane on Mon Jul 27, 2020 1:06 pm, edited 2 times in total.
3 likes   

BYG Jacob

Re: 2020 Indicators: SST's / SAL / MSLP / Steering / Shear / Instability / Sat Images

#1944 Postby BYG Jacob » Mon Jul 27, 2020 1:05 pm

The CFS completely whiffed on 2018 and 2019 by significantly undercounting the storm count. It also missed Dorian and Michael, and this year its MJO forecast has been terrible. It isn't a very good model.
4 likes   

User avatar
CyclonicFury
Category 5
Category 5
Posts: 2025
Age: 26
Joined: Sun Jul 02, 2017 12:32 pm
Location: NC
Contact:

Re: 2020 Indicators: SST's / SAL / MSLP / Steering / Shear / Instability / Sat Images

#1945 Postby CyclonicFury » Mon Jul 27, 2020 1:07 pm

The MDR is the third warmest on record (only cooler than 2005 and 2010), and we had a July hurricane of tropical origin and a July tropical storm in the MDR. Regardless of 92L's fate, the indicators still suggest a very active season is likely.
11 likes   
NCSU B.S. in Meteorology Class of 2021. Tropical weather blogger at http://www.cyclonicfury.com. My forecasts and thoughts are NOT official, for official forecasts please consult the National Hurricane Center.

Shell Mound
Category 5
Category 5
Posts: 2434
Age: 32
Joined: Thu Sep 07, 2017 3:39 pm
Location: St. Petersburg, FL → Scandinavia

Re: 2020 Indicators: SST's / SAL / MSLP / Steering / Shear / Instability / Sat Images

#1946 Postby Shell Mound » Mon Jul 27, 2020 1:36 pm

gatorcane wrote:Interesting how the North Atlantic has warmed the past couple of weeks and now we see warmer than normal sst anomalies not just in the deep tropics but in the Northern Atlantic. Not sure if this heat distribution is a signature for a hyperactive rest of season. I would like to see a cooler than normal North subtropical Atlantic and a warmer than normal MDR

https://i.postimg.cc/d19H9fPq/natlssta.png

Also watching the area south of Mexico. Looks to be warming and that could induce a bit more shear over the Caribbean than we think if this trend continues.

https://i.postimg.cc/4xb863DD/ssta-daily-current.png

The past several runs of the CFSv2 have consistently shown a very strong TUTT over the MDR/Caribbean during August, owing to the warmer subtropical North Atlantic, which leads to AWB and El Niño-like stability/shear over the tropical Atlantic. This isn’t especially new, given that several recent seasons featured a largely tranquil August, sometimes owing in part to similar warmth in the subtropical Atlantic, along with the general +PMM inducing some warmth over the eastern tropical Pacific adjourning the equatorial zone. The most recent seven-day trends aren’t especially favourable for an active August and could result in another “back-loaded” season with little additional activity before early September. Currently the strength of the TUTT over the next few weeks looks more typical of weak El Niño vs. borderline La Niña conditions.

 https://twitter.com/AndyHazelton/status/1287734040959815682


1 likes   
CVW / MiamiensisWx / Shell Mound
The posts in this forum are NOT official forecasts and should not be used as such. They are just the opinion of the poster and may or may not be backed by sound meteorological data. They are NOT endorsed by any professional institution or STORM2K. For official information, please refer to products from the NHC and NWS.

BYG Jacob

Re: 2020 Indicators: SST's / SAL / MSLP / Steering / Shear / Instability / Sat Images

#1947 Postby BYG Jacob » Mon Jul 27, 2020 1:53 pm

I feel like its ground hog day in here. We have storms consistently form in a SAL, subsidence infested basin and just recently had a hurricane form in the face of a suppressed Kelvin wave. We also literally got an MDR storm in JULY. bUt AlL thOSe sToRMs WeRE WeaK aNd ThIS MoDEl ruN HAs leSs FaVoRabLE cOnDITioNs!!!
Last edited by BYG Jacob on Mon Jul 27, 2020 2:06 pm, edited 1 time in total.
6 likes   

User avatar
CyclonicFury
Category 5
Category 5
Posts: 2025
Age: 26
Joined: Sun Jul 02, 2017 12:32 pm
Location: NC
Contact:

Re: 2020 Indicators: SST's / SAL / MSLP / Steering / Shear / Instability / Sat Images

#1948 Postby CyclonicFury » Mon Jul 27, 2020 1:59 pm

BYG Jacob wrote:I feel like its ground hog day in here. We have storms consistently form in a SAL, subsidence infested basin and just recently had a hurricane form in the face o a downwelling Kelvin wave. We also literally got an MDR storm in JULY. bUt AlL thOSe sToRMs WeRE WeaK aNd ThIS MoDEl ruN HAs leSs FaVoRabLE cOnDITioNs!!!

A downwelling Kelvin Wave is an oceanic Kelvin Wave, not an atmospheric Kelvin Wave.

As for Hanna, a Convectively Coupled Kelvin Wave was moving through the western Atlantic when it formed.
1 likes   
NCSU B.S. in Meteorology Class of 2021. Tropical weather blogger at http://www.cyclonicfury.com. My forecasts and thoughts are NOT official, for official forecasts please consult the National Hurricane Center.

BYG Jacob

Re: 2020 Indicators: SST's / SAL / MSLP / Steering / Shear / Instability / Sat Images

#1949 Postby BYG Jacob » Mon Jul 27, 2020 2:04 pm

CyclonicFury wrote:
BYG Jacob wrote:I feel like its ground hog day in here. We have storms consistently form in a SAL, subsidence infested basin and just recently had a hurricane form in the face o a downwelling Kelvin wave. We also literally got an MDR storm in JULY. bUt AlL thOSe sToRMs WeRE WeaK aNd ThIS MoDEl ruN HAs leSs FaVoRabLE cOnDITioNs!!!

A downwelling Kelvin Wave is an oceanic Kelvin Wave, not an atmospheric Kelvin Wave.

As for Hanna, a Convectively Coupled Kelvin Wave was moving through the western Atlantic when it formed.

This is what I was referencing
https://twitter.com/MJVentrice/status/1 ... 8871890945

edited to be less of a knob
0 likes   

MarioProtVI
Category 4
Category 4
Posts: 935
Age: 24
Joined: Sun Sep 29, 2019 7:33 pm
Location: New Jersey

Re: 2020 Indicators: SST's / SAL / MSLP / Steering / Shear / Instability / Sat Images

#1950 Postby MarioProtVI » Mon Jul 27, 2020 3:51 pm

gatorcane wrote:Interesting how the North Atlantic has warmed the past couple of weeks and now we see warmer than normal sst anomalies not just in the deep tropics but in the Northern Atlantic. Not sure if this heat distribution is a signature for a hyperactive rest of season. I would like to see a cooler than normal North subtropical Atlantic and a warmer than normal MDR

https://i.postimg.cc/d19H9fPq/natlssta.png

Also watching the area south of Mexico. Looks to be warming and that could induce a bit more shear over the Caribbean than we think if this trend continues.

https://i.postimg.cc/4xb863DD/ssta-daily-current.png

2010 had an identical if not exact same pattern at this time and look what happened after mid-August - went nuclear.
5 likes   

St0rmTh0r
Category 1
Category 1
Posts: 369
Joined: Tue Jul 14, 2020 8:04 pm

Re: 2020 Indicators: SST's / SAL / MSLP / Steering / Shear / Instability / Sat Images

#1951 Postby St0rmTh0r » Mon Jul 27, 2020 4:20 pm

BYG Jacob wrote:I feel like its ground hog day in here. We have storms consistently form in a SAL, subsidence infested basin and just recently had a hurricane form in the face of a suppressed Kelvin wave. We also literally got an MDR storm in JULY. bUt AlL thOSe sToRMs WeRE WeaK aNd ThIS MoDEl ruN HAs leSs FaVoRabLE cOnDITioNs!!!

Yea man I'm with you I feel LOOPED! Wheres the time stone when you need it!
Everything this year has defied nature and common sense. It would seem that this season is being compared to 2005 and anything less than a cat 5 in july is season canceled!
4 likes   

User avatar
Hammy
Category 5
Category 5
Posts: 5849
Age: 41
Joined: Fri May 25, 2012 5:25 pm
Contact:

Re: 2020 Indicators: SST's / SAL / MSLP / Steering / Shear / Instability / Sat Images

#1952 Postby Hammy » Mon Jul 27, 2020 4:22 pm

St0rmTh0r wrote:
NDG wrote:
tolakram wrote:To all who are criticizing the CFS post.

This IS the place to discuss what the longer range models are showing. You don't have to like it, but the proper response would be to discuss how the CFS has done in the past and not criticize a poster for discussing it. Telling us not to believe the long range models in a thread about discussing long range trends and models is a bit awkward, to say the least.


I agree, if we are going to disagree with a forecast and or model lets show our evidence.

Well the fact that 4 going on 5 storms have formed this month when the CFS predicted 1 is all the evidence we need.


Not sure where you got that, I'm not talking about the 16-day GFS (which is utterly useless) but the climate model--the CFS predicted generally in the range of 2-4 storms during July over the last several months of runs including Gulf activity--the problem with using the model for total seasonal activity is the resolution on the site is so poor that it's useless north of 35 as you can't tell if things are tropical or not, hence generally focusing on lower latitudes when discussing.


Shell Mound wrote:
Hammy wrote:
MarioProtVI wrote:I think we can all agree CFS is a garbage model to hold onto for season predictions especially considering the Atlantic cranked out two systems in a SUPPRESSED phase of the MJO, one of which was almost a Cat 2 and the other a fairly strong MDR TS in July which you don’t see very often and usually indicates a good possibility of a hyperactive season. Let’s revisit this CFS thing on November 30 and see where we stand since 2020 clearly does not want to abide by the rules of climatology :lol:


It's been accurate with trends but I'll agree that 2020 certainly isn't following the rules at all. :D

BYG Jacob wrote:Hugging the CFS is a weird hill to die on.


Once again, I post it here every few days during July/August as part of the discussion on the indicators. It's the same model that's used to predict precipitation and such on monthly basis.

What do the CFSv2 weeklies show in regard to Atlantic SST trends?


Weekly SSTs don't seem to be available but the trend for August is towards a large warm pool in the subtropics which tends to increase shear and reduce instability, and seemingly more specifically focusing that warm pool on later August rather than early September because it's weakening in September trends at the same time that it's growing in August which might indicate a back-loaded season (as if we haven't been getting a fair amount of storms as it is)

St0rmTh0r wrote:
BYG Jacob wrote:I feel like its ground hog day in here. We have storms consistently form in a SAL, subsidence infested basin and just recently had a hurricane form in the face of a suppressed Kelvin wave. We also literally got an MDR storm in JULY. bUt AlL thOSe sToRMs WeRE WeaK aNd ThIS MoDEl ruN HAs leSs FaVoRabLE cOnDITioNs!!!

Yea man I'm with you I feel LOOPED! Wheres the time stone when you need it!
Everything this year has defied nature and common sense. It would seem that this season is being compared to 2005 and anything less than a cat 5 in july is season canceled!


Do you understand that this is a forum for open discussion of what the models are doing, and the indicators? I do not understand this sudden hostility towards any post that doesn't give every wave a 100% chance of developing, or any discussion that hints that the season might be so much as 0.1% less favorable than you've set your expectations to and seems if anything people here are attacking anything that doesn't compare this to 2005. This is a weather forum, stop treating it like some sort of political echo chamber.
Last edited by Hammy on Mon Jul 27, 2020 4:31 pm, edited 2 times in total.
6 likes   
The above post is not official and should not be used as such. It is the opinion of the poster and may or may not be backed by sound meteorological data. It is not endorsed by any professional institution or storm2k.org. For official information, please refer to the NHC and NWS products.

St0rmTh0r
Category 1
Category 1
Posts: 369
Joined: Tue Jul 14, 2020 8:04 pm

Re: 2020 Indicators: SST's / SAL / MSLP / Steering / Shear / Instability / Sat Images

#1953 Postby St0rmTh0r » Mon Jul 27, 2020 4:23 pm

MarioProtVI wrote:
gatorcane wrote:Interesting how the North Atlantic has warmed the past couple of weeks and now we see warmer than normal sst anomalies not just in the deep tropics but in the Northern Atlantic. Not sure if this heat distribution is a signature for a hyperactive rest of season. I would like to see a cooler than normal North subtropical Atlantic and a warmer than normal MDR

https://i.postimg.cc/d19H9fPq/natlssta.png

Also watching the area south of Mexico. Looks to be warming and that could induce a bit more shear over the Caribbean than we think if this trend continues.

https://i.postimg.cc/4xb863DD/ssta-daily-current.png

2010 had an identical if not exact same pattern at this time and look what happened after mid-August - went nuclear.

If there hasn't been enough signs to throw the models out the window then people are going be in for a big suprise
1 likes   

User avatar
CyclonicFury
Category 5
Category 5
Posts: 2025
Age: 26
Joined: Sun Jul 02, 2017 12:32 pm
Location: NC
Contact:

Re: 2020 Indicators: SST's / SAL / MSLP / Steering / Shear / Instability / Sat Images

#1954 Postby CyclonicFury » Mon Jul 27, 2020 4:27 pm

The first half of August is occasionally as quiet as July. Not sure if that will be the case this year, but normally the "lid" doesn't "come off" until around August 20-25, though it varies depending on the year. SAL can continue to be a problem into August, and in recent years, even 2017, the MDR has been practically dead during early-mid August.

I expect about 4 storms for August, with maybe 1 in the first half and 3 in the second half. Knowing 2020 though, I wouldn't bet on a long lull. We've already had one hurricane and ACE so far is equivalent to the average for August 16.
2 likes   
NCSU B.S. in Meteorology Class of 2021. Tropical weather blogger at http://www.cyclonicfury.com. My forecasts and thoughts are NOT official, for official forecasts please consult the National Hurricane Center.

User avatar
Hammy
Category 5
Category 5
Posts: 5849
Age: 41
Joined: Fri May 25, 2012 5:25 pm
Contact:

Re: 2020 Indicators: SST's / SAL / MSLP / Steering / Shear / Instability / Sat Images

#1955 Postby Hammy » Mon Jul 27, 2020 4:45 pm

I do wonder if roughly mid-August to mid-September could be a good analog for August 2020 with the TUTT setting up and would be consistent with both CFS activity and rainfall patterns.
After Alberto got going, there were 7 storms that followed over the next month--one in the Gulf (which this year was Hanna, almost double Beryl's intensity), Chris/Debby/Ernesto (which met their demise in the TUTT) followed by a gradual ramp-up--Florence and Gordon wrapped up that 30 or so day period.

This was followed by four storms (all but one a hurricane and two were majors) at the end of September and activity continuing into mid-October--except this year that peak would be arriving much earlier, and have more time to produce further activity.
0 likes   
The above post is not official and should not be used as such. It is the opinion of the poster and may or may not be backed by sound meteorological data. It is not endorsed by any professional institution or storm2k.org. For official information, please refer to the NHC and NWS products.

St0rmTh0r
Category 1
Category 1
Posts: 369
Joined: Tue Jul 14, 2020 8:04 pm

Re: 2020 Indicators: SST's / SAL / MSLP / Steering / Shear / Instability / Sat Images

#1956 Postby St0rmTh0r » Mon Jul 27, 2020 4:49 pm

Hammy wrote:
St0rmTh0r wrote:
NDG wrote:
I agree, if we are going to disagree with a forecast and or model lets show our evidence.

Well the fact that 4 going on 5 storms have formed this month when the CFS predicted 1 is all the evidence we need.


Not sure where you got that, I'm not talking about the 16-day GFS (which is utterly useless) but the climate model--the CFS predicted generally in the range of 2-4 storms during July over the last several months of runs including Gulf activity--the problem with using the model for total seasonal activity is the resolution on the site is so poor that it's useless north of 35 as you can't tell if things are tropical or not, hence generally focusing on lower latitudes when discussing.


Shell Mound wrote:
Hammy wrote:
It's been accurate with trends but I'll agree that 2020 certainly isn't following the rules at all. :D


Once again, I post it here every few days during July/August as part of the discussion on the indicators. It's the same model that's used to predict precipitation and such on monthly basis.

What do the CFSv2 weeklies show in regard to Atlantic SST trends?


Weekly SSTs don't seem to be available but the trend for August is towards a large warm pool in the subtropics which tends to increase shear and reduce instability, and seemingly more specifically focusing that warm pool on later August rather than early September because it's weakening in September trends at the same time that it's growing in August which might indicate a back-loaded season (as if we haven't been getting a fair amount of storms as it is)

St0rmTh0r wrote:
BYG Jacob wrote:I feel like its ground hog day in here. We have storms consistently form in a SAL, subsidence infested basin and just recently had a hurricane form in the face of a suppressed Kelvin wave. We also literally got an MDR storm in JULY. bUt AlL thOSe sToRMs WeRE WeaK aNd ThIS MoDEl ruN HAs leSs FaVoRabLE cOnDITioNs!!!

Yea man I'm with you I feel LOOPED! Wheres the time stone when you need it!
Everything this year has defied nature and common sense. It would seem that this season is being compared to 2005 and anything less than a cat 5 in july is season canceled!


Do you understand that this is a forum for open discussion of what the models are doing, and the indicators? I do not understand this sudden hostility towards any post that doesn't give every wave a 100% chance of developing, or any discussion that hints that the season might be so much as 0.1% less favorable than you've set your expectations to and seems if anything people here are attacking anything that doesn't compare this to 2005. This is a weather forum, stop treating it like some sort of political echo chamber.

I got that from supercane4867 who informed me that the monthly CFS predicted on june 26th there would only be 1 storm in July.
2 likes   

User avatar
Hammy
Category 5
Category 5
Posts: 5849
Age: 41
Joined: Fri May 25, 2012 5:25 pm
Contact:

Re: 2020 Indicators: SST's / SAL / MSLP / Steering / Shear / Instability / Sat Images

#1957 Postby Hammy » Mon Jul 27, 2020 5:01 pm

St0rmTh0r wrote:I got that from supercane4867 who informed me that the monthly CFS predicted on june 26th there would only be 1 storm in July.


Going by raw pressure doesn't work because of the low resolution , I usually loop the model start to finish and have to interpret what I see (doing this gives a more accurate result)

https://www.weatheronline.co.uk/cgi-bin/expertcharts?LANG=en&MENU=0000000000&CONT=noat&MODELL=cfs&MODELLTYP=1&BASE=-&VAR=pslv&HH=12&ZOOM=0&WMO=&ARCHIV=0&LOOP=1&RES=0

A lot of it is extrapolation mind you, and have to use four different maps--Atlantic wide view, and for a bit higher res, Caribbean/Gulf/East Coast. I don't post these daily because it's fairly time consuming to get to a single run's conclusion. Some examples for the maps, for anyone else who might be interested in how this works (I don't use the numerical output as it's essentially useless)

Image
A "tropical storm" off the east coast
Image
Going by size and pressure, this is more than likely a major hurricane, not a tropical storm as it shows up

Image
A couple of weak lows or open waves?
Image
More than likely a tropical storm as well as a second one behind it (though with some smaller recurving storms being at hurricane intensity can't be ruled out--I don't have a zoom for the central Atlantic or MDR)

Image
Gulf gets tricky--this is the CFS run for 92L, pretty sure a standard resolution or wind map would have this at a tropical storm but there's also a persistent low pressure that contrasts to the higher pressure over Mexico.
Image
It gets lost in the lowered pressures in the Gulf, difficult to say if it's still there or not, and Gulf storms (especially weaker ones) are often under-counted for this reason

These are not very high quality images or anything but it's the best that exists for getting wider trends beyond rainfall (which doesnt tell you if there are storms or just strong waves with shear) and often gives a good idea when and where the activity will be, and how much, albeit not an exact or correct number. Smaller storms are likely undercounted as it's difficult to tell if they're storms or waves on this, and I don't count anything north of 35 (hence mainly focusing on MDR activity) because unless it originates further south, theres no way to tell if it's tropical or not without a wind profile (which is not available here)
2 likes   
The above post is not official and should not be used as such. It is the opinion of the poster and may or may not be backed by sound meteorological data. It is not endorsed by any professional institution or storm2k.org. For official information, please refer to the NHC and NWS products.

St0rmTh0r
Category 1
Category 1
Posts: 369
Joined: Tue Jul 14, 2020 8:04 pm

Re: 2020 Indicators: SST's / SAL / MSLP / Steering / Shear / Instability / Sat Images

#1958 Postby St0rmTh0r » Mon Jul 27, 2020 5:11 pm

Hammy wrote:
St0rmTh0r wrote:I got that from supercane4867 who informed me that the monthly CFS predicted on june 26th there would only be 1 storm in July.


Going by raw pressure doesn't work because of the low resolution , I usually loop the model start to finish and have to interpret what I see (doing this gives a more accurate result)

https://www.weatheronline.co.uk/cgi-bin/expertcharts?LANG=en&MENU=0000000000&CONT=noat&MODELL=cfs&MODELLTYP=1&BASE=-&VAR=pslv&HH=12&ZOOM=0&WMO=&ARCHIV=0&LOOP=1&RES=0

A lot of it is extrapolation mind you, and have to use four different maps--Atlantic wide view, and for a bit higher res, Caribbean/Gulf/East Coast. I don't post these daily because it's fairly time consuming to get to a single run's conclusion. Some examples for the maps, for anyone else who might be interested in how this works (I don't use the numerical output as it's essentially useless)

https://i.imgur.com/jzUkROt.png
A "tropical storm" off the east coast
https://i.imgur.com/3lEuV9V.png
Going by size and pressure, this is more than likely a major hurricane, not a tropical storm as it shows up

https://i.imgur.com/eY8sJsS.png
A couple of weak lows or open waves?
https://i.imgur.com/w0rMexd.png
More than likely a tropical storm as well as a second one behind it (though with some smaller recurving storms being at hurricane intensity can't be ruled out--I don't have a zoom for the central Atlantic or MDR)

https://i.imgur.com/UoAfKCU.png
Gulf gets tricky--this is the CFS run for 92L, pretty sure a standard resolution or wind map would have this at a tropical storm but there's also a persistent low pressure that contrasts to the higher pressure over Mexico.
https://i.imgur.com/ZiOHaYK.png
It gets lost in the lowered pressures in the Gulf, difficult to say if it's still there or not, and Gulf storms (especially weaker ones) are often under-counted for this reason

These are not very high quality images or anything but it's the best that exists for getting wider trends beyond rainfall (which doesnt tell you if there are storms or just strong waves with shear) and often gives a good idea when and where the activity will be, and how much, albeit not an exact or correct number. Smaller storms are likely undercounted as it's difficult to tell if they're storms or waves on this, and I don't count anything north of 35 (hence mainly focusing on MDR activity) because unless it originates further south, theres no way to tell if it's tropical or not without a wind profile (which is not available here)

I see your point bud how would this compare to other active years like 2017 and 2010? Dont know if this model was being used then but it would be interesting to compare and see if forecasts verified.
0 likes   

supercane4867
Category 5
Category 5
Posts: 4966
Joined: Wed Nov 14, 2012 10:43 am

Re: 2020 Indicators: SST's / SAL / MSLP / Steering / Shear / Instability / Sat Images

#1959 Postby supercane4867 » Mon Jul 27, 2020 5:44 pm

I'm tired of seeing this CFS debate so I just want to point out one most important fact: The CFS is a climate model and it is not meant to be used for predicting individual tropical cyclone genesis. That's the reason why it have a such low resolution.

Official description from the NOAA website:

The Climate Forecast System (CFS) is a model representing the global interaction between Earth's oceans, land, and atmosphere. Produced by several dozen scientists under guidance from the National Centers for Environmental Prediction (NCEP), this model offers hourly data with a horizontal resolution down to one-half of a degree (approximately 56 km) around Earth for many variables. CFS uses the latest scientific approaches for taking in, or assimilating, observations from data sources including surface observations, upper air balloon observations, aircraft observations, and satellite observations.


To put above text into context, here is a section from a research paper regarding the approach of using climate models for seasonal TC forecast:

Because of its coarse resolution, direct application of the CFS products to regional
climate forecasts however appear to be difficult for practical purposes. As such,
dynamical or statistical downscaling of the CFS products with a regional climate model is
needed to enhance the regional representation. This is especially essential for TC forecast
because TC intensity and development tend to be strongly influenced by the model
resolution (Yeung and Chan 2011). As a result, direct use of CFS could provide a wrong
count of the number of TC
.


Link: https://www.researchgate.net/publicatio ... 012_Season

While I don't oppose sharing CFS outputs under the discussion thread of seasonal indicators, but I also think there's nothing wrong to be critical of the practice of using CFS for predicting how many storms will form in the next month or two. It's like using NAM for intensity forecast. Just because sometime it ends up to be correct doesn't change the fact that it's a bad practice. Now let's move on.

I got the previous CFS numbers from here: ftp://ftp.cpc.ncep.noaa.gov/llong/main.html
0 likes   

tolakram
Admin
Admin
Posts: 20009
Age: 62
Joined: Sun Aug 27, 2006 8:23 pm
Location: Florence, KY (name is Mark)

Re: 2020 Indicators: SST's / SAL / MSLP / Steering / Shear / Instability / Sat Images

#1960 Postby tolakram » Mon Jul 27, 2020 6:02 pm

Except what you just said is not true. It's not bad practice to use the NAM is some instances, you just have to understand how it works and in what circumstances it may be more accurate than a dynamic model.

No one can say for sure if the CFS has any accuracy for rough tropical predictions unless we look and compare the results. It's an interesting exercise.
0 likes   
M a r k
- - - - -
Join us in chat: Storm2K Chatroom Invite. Android and IOS apps also available.

The posts in this forum are NOT official forecasts and should not be used as such. Posts are NOT endorsed by any professional institution or STORM2K.org. For official information and forecasts, please refer to NHC and NWS products.


Return to “Talkin' Tropics”

Who is online

Users browsing this forum: No registered users and 38 guests