2020 Indicators: SST's / SAL / MSLP / Steering / Shear / Instability / Sat Images

This is the general tropical discussion area. Anyone can take their shot at predicting a storms path.

Moderator: S2k Moderators

Forum rules

The posts in this forum are NOT official forecasts and should not be used as such. They are just the opinion of the poster and may or may not be backed by sound meteorological data. They are NOT endorsed by any professional institution or STORM2K. For official information, please refer to products from the National Hurricane Center and National Weather Service.

Help Support Storm2K
Message
Author
User avatar
Hammy
Category 5
Category 5
Posts: 5849
Age: 41
Joined: Fri May 25, 2012 5:25 pm
Contact:

Re: 2020 Indicators: SST's / SAL / MSLP / Steering / Shear / Instability / Sat Images

#1961 Postby Hammy » Mon Jul 27, 2020 6:08 pm

St0rmTh0r wrote:
Hammy wrote:
St0rmTh0r wrote:I got that from supercane4867 who informed me that the monthly CFS predicted on june 26th there would only be 1 storm in July.


Going by raw pressure doesn't work because of the low resolution , I usually loop the model start to finish and have to interpret what I see (doing this gives a more accurate result)

https://www.weatheronline.co.uk/cgi-bin/expertcharts?LANG=en&MENU=0000000000&CONT=noat&MODELL=cfs&MODELLTYP=1&BASE=-&VAR=pslv&HH=12&ZOOM=0&WMO=&ARCHIV=0&LOOP=1&RES=0

A lot of it is extrapolation mind you, and have to use four different maps--Atlantic wide view, and for a bit higher res, Caribbean/Gulf/East Coast. I don't post these daily because it's fairly time consuming to get to a single run's conclusion. Some examples for the maps, for anyone else who might be interested in how this works (I don't use the numerical output as it's essentially useless)

https://i.imgur.com/jzUkROt.png
A "tropical storm" off the east coast
https://i.imgur.com/3lEuV9V.png
Going by size and pressure, this is more than likely a major hurricane, not a tropical storm as it shows up

https://i.imgur.com/eY8sJsS.png
A couple of weak lows or open waves?
https://i.imgur.com/w0rMexd.png
More than likely a tropical storm as well as a second one behind it (though with some smaller recurving storms being at hurricane intensity can't be ruled out--I don't have a zoom for the central Atlantic or MDR)

https://i.imgur.com/UoAfKCU.png
Gulf gets tricky--this is the CFS run for 92L, pretty sure a standard resolution or wind map would have this at a tropical storm but there's also a persistent low pressure that contrasts to the higher pressure over Mexico.
https://i.imgur.com/ZiOHaYK.png
It gets lost in the lowered pressures in the Gulf, difficult to say if it's still there or not, and Gulf storms (especially weaker ones) are often under-counted for this reason

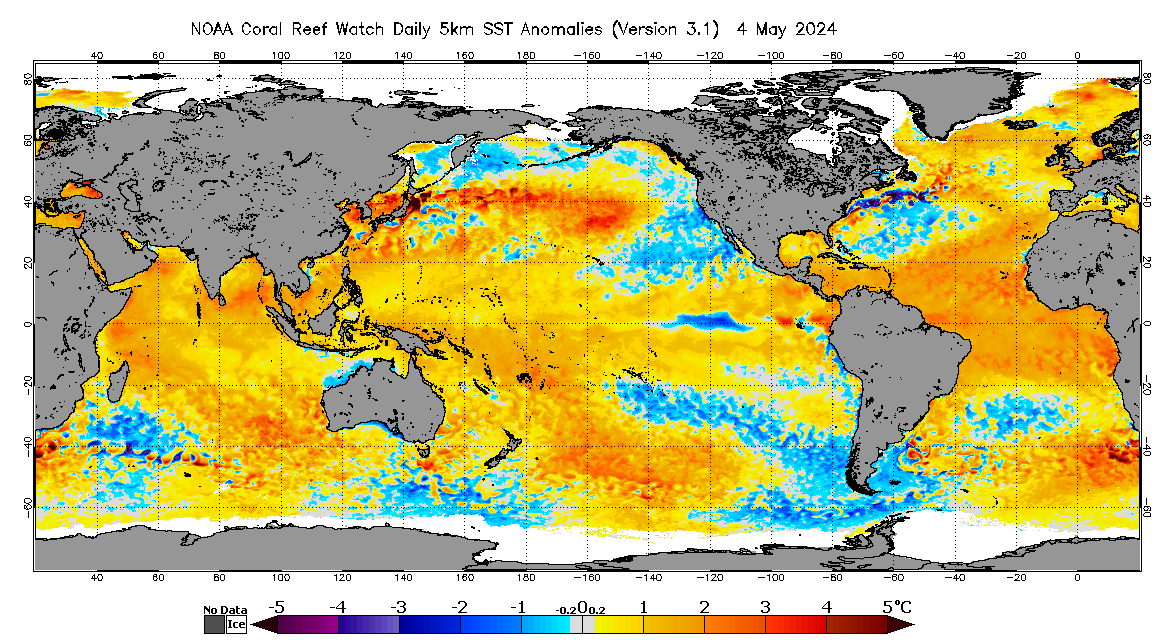
These are not very high quality images or anything but it's the best that exists for getting wider trends beyond rainfall (which doesnt tell you if there are storms or just strong waves with shear) and often gives a good idea when and where the activity will be, and how much, albeit not an exact or correct number. Smaller storms are likely undercounted as it's difficult to tell if they're storms or waves on this, and I don't count anything north of 35 (hence mainly focusing on MDR activity) because unless it originates further south, theres no way to tell if it's tropical or not without a wind profile (which is not available here)

I see your point bud how would this compare to other active years like 2017 and 2010? Dont know if this model was being used then but it would be interesting to compare and see if forecasts verified.


I do remember it for a time showing a quiet and busy Atlantic in 2017 (it sort of windshield wipes the more months out you go, as the shorter range models do at the several day mark) but once getting to within a few months did show a lot of storms going through the Caribbean. I can't say anything about 2010 as 2014 was the first season I really paid attention to it, and really only a few times during the 14-15 seasons as I was unsure exactly what the model was.

I do remember Michael being forecast within a week's accuracy about two months out in 2018 which really gave the model credibility for me.
2 likes   
The above post is not official and should not be used as such. It is the opinion of the poster and may or may not be backed by sound meteorological data. It is not endorsed by any professional institution or storm2k.org. For official information, please refer to the NHC and NWS products.

supercane4867
Category 5
Category 5
Posts: 4966
Joined: Wed Nov 14, 2012 10:43 am

Re: 2020 Indicators: SST's / SAL / MSLP / Steering / Shear / Instability / Sat Images

#1962 Postby supercane4867 » Mon Jul 27, 2020 6:23 pm

tolakram wrote:Except what you just said is not true. It's not bad practice to use the NAM is some instances, you just have to understand how it works and in what circumstances it may be more accurate than a dynamic model.

No one can say for sure if the CFS has any accuracy for rough tropical predictions unless we look and compare the results. It's an interesting exercise.

I was referring to the direct usage(i.e. taking the output results for granted). NAM have been consistently showing unrealistic pressure readings for tropical cyclones. I remember it had sub-900mb readings for Hurricane Chris in 2018 and many other cases. If I post such outputs in the model thread nobody would take those raw number seriously so I don't understand why some on both sides make a big deal out of CFS.
2 likes   

TROPICALCYCLONEALERT
Tropical Low
Tropical Low
Posts: 31
Joined: Thu Feb 20, 2020 9:28 pm

Re: 2020 Indicators: SST's / SAL / MSLP / Steering / Shear / Instability / Sat Images

#1963 Postby TROPICALCYCLONEALERT » Mon Jul 27, 2020 6:26 pm

I wouldn't really rely on the CFS here - it has been persistently showing a breakdown of both atmospheric standing waves for no apparent reason. That hasn't happened yet, and probably won't happen for a while.

I always think of the CFS as the GFS ran out to an obscenely long time period...
0 likes   

User avatar
Hammy
Category 5
Category 5
Posts: 5849
Age: 41
Joined: Fri May 25, 2012 5:25 pm
Contact:

Re: 2020 Indicators: SST's / SAL / MSLP / Steering / Shear / Instability / Sat Images

#1964 Postby Hammy » Mon Jul 27, 2020 6:40 pm

TROPICALCYCLONEALERT wrote:I wouldn't really rely on the CFS here - it has been persistently showing a breakdown of both atmospheric standing waves for no apparent reason. That hasn't happened yet, and probably won't happen for a while.

I always think of the CFS as the GFS ran out to an obscenely long time period...


It's the same model most of the rainfall and pressure forecasts are based off of, and still part of the discussion regarding trends. The monthlies don't seem to break down the standing wave either, not until October at least--though the weeklies are a completely different matter.
0 likes   
The above post is not official and should not be used as such. It is the opinion of the poster and may or may not be backed by sound meteorological data. It is not endorsed by any professional institution or storm2k.org. For official information, please refer to the NHC and NWS products.

supercane4867
Category 5
Category 5
Posts: 4966
Joined: Wed Nov 14, 2012 10:43 am

Re: 2020 Indicators: SST's / SAL / MSLP / Steering / Shear / Instability / Sat Images

#1965 Postby supercane4867 » Mon Jul 27, 2020 7:05 pm

If we were to use the CFS, it's best to look for atmospheric patterns such as precipitation, geopotential heights and temperature anomalies -- which is what the CFS model designed for. I don't think counting the number of potential storms by extrapolating low resolution closed isobars is the appropriate method of interpretation. Just as I posted there's already research being done to back this claim.
0 likes   

User avatar
Hammy
Category 5
Category 5
Posts: 5849
Age: 41
Joined: Fri May 25, 2012 5:25 pm
Contact:

Re: 2020 Indicators: SST's / SAL / MSLP / Steering / Shear / Instability / Sat Images

#1966 Postby Hammy » Mon Jul 27, 2020 7:09 pm

supercane4867 wrote:If we were to use the CFS, it's best to look for atmospheric patterns such as precipitation, geopotential heights and temperature anomalies -- which is what the CFS model designed for. I don't think counting the number of potential storms by extrapolating closed isobars is the appropriate method of interpretation. Just as I posted there's already research being done to back this claim.


Again, there's no reason to completely exclude data that's out there just because you don't like it, it's part of the datasets that are used and trend-wise a decent indicator when everything else is taken in.
0 likes   
The above post is not official and should not be used as such. It is the opinion of the poster and may or may not be backed by sound meteorological data. It is not endorsed by any professional institution or storm2k.org. For official information, please refer to the NHC and NWS products.

User avatar
TheProfessor
Professional-Met
Professional-Met
Posts: 3506
Age: 28
Joined: Tue Dec 03, 2013 10:56 am
Location: Wichita, Kansas

Re: 2020 Indicators: SST's / SAL / MSLP / Steering / Shear / Instability / Sat Images

#1967 Postby TheProfessor » Mon Jul 27, 2020 7:54 pm

Hammy wrote:
supercane4867 wrote:If we were to use the CFS, it's best to look for atmospheric patterns such as precipitation, geopotential heights and temperature anomalies -- which is what the CFS model designed for. I don't think counting the number of potential storms by extrapolating closed isobars is the appropriate method of interpretation. Just as I posted there's already research being done to back this claim.


Again, there's no reason to completely exclude data that's out there just because you don't like it, it's part of the datasets that are used and trend-wise a decent indicator when everything else is taken in.


It's perfectly reasonable to exclude erroneous data or outliers. That's why you'll often see WPC use a blend of models and discard a model or two when it doesn't make sense to use it(like if a model is over progressive in a -AO period and there's a blocking high favoring an amplifying trough or vice versa.). It's okay to use the CFS's anomaly charts because it can pick up on precipitation patterns that show what tracks it might be favoring and where storms may be occurring. The CFS really shouldn't be used for any type of cyclogenesis, it's simply not made to detect a cyclone a month or two out. The model could show positive precipitation anomalies somewhere, but no tropical cyclones yet in real time a tropical storm ad hurricane could pass through that location and the model would have missed it. In my opinion, trying to look and see how many storms it spins up(or any climate model for that matter) isn't a good way to detect how the season will go. As I stated before it's better to look at precipitation anomalies and the background state of the atmosphere on the model.
6 likes   
An alumnus of The Ohio State University.

Your local National Weather Service office is your best source for weather information.

User avatar
Hammy
Category 5
Category 5
Posts: 5849
Age: 41
Joined: Fri May 25, 2012 5:25 pm
Contact:

Re: 2020 Indicators: SST's / SAL / MSLP / Steering / Shear / Instability / Sat Images

#1968 Postby Hammy » Mon Jul 27, 2020 8:08 pm

TheProfessor wrote:
Hammy wrote:
supercane4867 wrote:If we were to use the CFS, it's best to look for atmospheric patterns such as precipitation, geopotential heights and temperature anomalies -- which is what the CFS model designed for. I don't think counting the number of potential storms by extrapolating closed isobars is the appropriate method of interpretation. Just as I posted there's already research being done to back this claim.


Again, there's no reason to completely exclude data that's out there just because you don't like it, it's part of the datasets that are used and trend-wise a decent indicator when everything else is taken in.


It's perfectly reasonable to exclude erroneous data or outliers. That's why you'll often see WPC use a blend of models and discard a model or two when it doesn't make sense to use it(like if a model is over progressive in a -AO period and there's a blocking high favoring an amplifying trough or vice versa.). It's okay to use the CFS's anomaly charts because it can pick up on precipitation patterns that show what tracks it might be favoring and where storms may be occurring. The CFS really shouldn't be used for any type of cyclogenesis, it's simply not made to detect a cyclone a month or two out. The model could show positive precipitation anomalies somewhere, but no tropical cyclones yet in real time a tropical storm ad hurricane could pass through that location and the model would have missed it. In my opinion, trying to look and see how many storms it spins up(or any climate model for that matter) isn't a good way to detect how the season will go. As I stated before it's better to look at precipitation anomalies and the background state of the atmosphere on the model.


For me the primary reason to count out the storms (aside from a matter of interest) is to get an idea of the trends, is it showing less or more (something that's not easily made out just watching it run), where the storms are going, etc rather than looking at it to predict a storm will be here or there or there will be this many at this moment--it gives a general idea the trends in activity (something rainfall doesn't quite do) and I'm not quite sure why it's become such a controversy suddenly as I've been posting summaries semi-routinely for the last seven hurricane seasons during quieter periods.

My earlier post regarding the maps was more to point out that using the numerical output from the model doesn't tell the whole story, if it tells any to start with.
3 likes   
The above post is not official and should not be used as such. It is the opinion of the poster and may or may not be backed by sound meteorological data. It is not endorsed by any professional institution or storm2k.org. For official information, please refer to the NHC and NWS products.


User avatar
TheProfessor
Professional-Met
Professional-Met
Posts: 3506
Age: 28
Joined: Tue Dec 03, 2013 10:56 am
Location: Wichita, Kansas

Re: 2020 Indicators: SST's / SAL / MSLP / Steering / Shear / Instability / Sat Images

#1970 Postby TheProfessor » Mon Jul 27, 2020 8:35 pm

Hammy wrote:
TheProfessor wrote:
Hammy wrote:
Again, there's no reason to completely exclude data that's out there just because you don't like it, it's part of the datasets that are used and trend-wise a decent indicator when everything else is taken in.


It's perfectly reasonable to exclude erroneous data or outliers. That's why you'll often see WPC use a blend of models and discard a model or two when it doesn't make sense to use it(like if a model is over progressive in a -AO period and there's a blocking high favoring an amplifying trough or vice versa.). It's okay to use the CFS's anomaly charts because it can pick up on precipitation patterns that show what tracks it might be favoring and where storms may be occurring. The CFS really shouldn't be used for any type of cyclogenesis, it's simply not made to detect a cyclone a month or two out. The model could show positive precipitation anomalies somewhere, but no tropical cyclones yet in real time a tropical storm ad hurricane could pass through that location and the model would have missed it. In my opinion, trying to look and see how many storms it spins up(or any climate model for that matter) isn't a good way to detect how the season will go. As I stated before it's better to look at precipitation anomalies and the background state of the atmosphere on the model.


For me the primary reason to count out the storms (aside from a matter of interest) is to get an idea of the trends, is it showing less or more (something that's not easily made out just watching it run), where the storms are going, etc rather than looking at it to predict a storm will be here or there or there will be this many at this moment--it gives a general idea the trends in activity (something rainfall doesn't quite do) and I'm not quite sure why it's become such a controversy suddenly as I've been posting summaries semi-routinely for the last seven hurricane seasons during quieter periods.

My earlier post regarding the maps was more to point out that using the numerical output from the model doesn't tell the whole story, if it tells any to start with.


The only problem I see with that is that using daily CFS can result in high variance and you may not get a strong correlation with any trend you see. It'd be better to use something like the CFS Weekly for trends.
5 likes   
An alumnus of The Ohio State University.

Your local National Weather Service office is your best source for weather information.

USTropics
Professional-Met
Professional-Met
Posts: 2651
Joined: Sun Aug 12, 2007 3:45 am
Location: Florida State University

Re: 2020 Indicators: SST's / SAL / MSLP / Steering / Shear / Instability / Sat Images

#1971 Postby USTropics » Mon Jul 27, 2020 8:46 pm

The CFS is just another tool. While its forecasting of individual storms has low skill, there are very limited models that do this past 240 hours. If you understand its limitations, it can still be useful. Looking for signals/consistency is its primary use (I wouldn't be making decisions based on its forecasts). I think posting its forecasts, and then seeing how they verify, is completely acceptable (with the understanding it has low skill). Which is exactly what Hammy has done this season and in seasons past.
7 likes   

User avatar
Steve
S2K Supporter
S2K Supporter
Posts: 9621
Joined: Sat Apr 05, 2003 11:41 pm
Location: Not a state-caster

Re: 2020 Indicators: SST's / SAL / MSLP / Steering / Shear / Instability / Sat Images

#1972 Postby Steve » Tue Jul 28, 2020 12:30 am

I'm going to have to go ahead and say that this season's indicators are indicating that it's busy season.
7 likes   

Shell Mound
Category 5
Category 5
Posts: 2434
Age: 32
Joined: Thu Sep 07, 2017 3:39 pm
Location: St. Petersburg, FL → Scandinavia

Re: 2020 Indicators: SST's / SAL / MSLP / Steering / Shear / Instability / Sat Images

#1973 Postby Shell Mound » Tue Jul 28, 2020 1:41 am

Personally, I’m starting to think that the subtropical North Atlantic is too warm for an active peak season (August through early September). The emergence of the warm pool, combined with a lingering +PMM, implies a stronger TUTT and also weaker instability over the MDR/Caribbean during the aforementioned timeframe. A “back-loaded” season (from mid-September on) is less likely to be hyperactive, given that late September and October would have to perform as the de facto “peak,” that is, feature record-breaking activity/ACE by a large margin. I think the most bullish forecasts are going to bust. I know, I’ve changed my earlier views, but the recent warming of the subtropics over the past few weeks is dramatic. Note that the subtropical Atlantic is now substantially warmer than the MDR/Caribbean:

Image
Image
0 likes   
CVW / MiamiensisWx / Shell Mound
The posts in this forum are NOT official forecasts and should not be used as such. They are just the opinion of the poster and may or may not be backed by sound meteorological data. They are NOT endorsed by any professional institution or STORM2K. For official information, please refer to products from the NHC and NWS.

SconnieCane
Category 4
Category 4
Posts: 998
Joined: Thu Aug 02, 2018 5:29 pm
Location: Madison, WI

Re: 2020 Indicators: SST's / SAL / MSLP / Steering / Shear / Instability / Sat Images

#1974 Postby SconnieCane » Tue Jul 28, 2020 7:43 am

Shell Mound wrote:Personally, I’m starting to think that the subtropical North Atlantic is too warm for an active peak season (August through early September). The emergence of the warm pool, combined with a lingering +PMM, implies a stronger TUTT and also weaker instability over the MDR/Caribbean during the aforementioned timeframe. A “back-loaded” season (from mid-September on) is less likely to be hyperactive, given that late September and October would have to perform as the de facto “peak,” that is, feature record-breaking activity/ACE by a large margin. I think the most bullish forecasts are going to bust. I know, I’ve changed my earlier views, but the recent warming of the subtropics over the past few weeks is dramatic. Note that the subtropical Atlantic is now substantially warmer than the MDR/Caribbean:

https://coralreefwatch.noaa.gov/data/5km/v3.1/current/daily/gif/cur_coraltemp5km_ssta_large.gif
https://coralreefwatch.noaa.gov/data/5km/v3.1/current/daily/gif/cur_coraltemp5km_ssttrend_007d_large.gif


Warmer in terms of anomalies or warmer in absolute terms? Gotta imagine "normal" is cooler in the subtropics and there are still positive anomalies in the MDR.
0 likes   

Shell Mound
Category 5
Category 5
Posts: 2434
Age: 32
Joined: Thu Sep 07, 2017 3:39 pm
Location: St. Petersburg, FL → Scandinavia

Re: 2020 Indicators: SST's / SAL / MSLP / Steering / Shear / Instability / Sat Images

#1975 Postby Shell Mound » Tue Jul 28, 2020 7:43 am

SconnieCane wrote:
Shell Mound wrote:Personally, I’m starting to think that the subtropical North Atlantic is too warm for an active peak season (August through early September). The emergence of the warm pool, combined with a lingering +PMM, implies a stronger TUTT and also weaker instability over the MDR/Caribbean during the aforementioned timeframe. A “back-loaded” season (from mid-September on) is less likely to be hyperactive, given that late September and October would have to perform as the de facto “peak,” that is, feature record-breaking activity/ACE by a large margin. I think the most bullish forecasts are going to bust. I know, I’ve changed my earlier views, but the recent warming of the subtropics over the past few weeks is dramatic. Note that the subtropical Atlantic is now substantially warmer than the MDR/Caribbean:

https://coralreefwatch.noaa.gov/data/5km/v3.1/current/daily/gif/cur_coraltemp5km_ssta_large.gif
https://coralreefwatch.noaa.gov/data/5km/v3.1/current/daily/gif/cur_coraltemp5km_ssttrend_007d_large.gif


Warmer in terms of anomalies or warmer in absolute terms? Gotta imagine "normal" is cooler in the subtropics and there are still positive anomalies in the MDR.

Anomalies
0 likes   
CVW / MiamiensisWx / Shell Mound
The posts in this forum are NOT official forecasts and should not be used as such. They are just the opinion of the poster and may or may not be backed by sound meteorological data. They are NOT endorsed by any professional institution or STORM2K. For official information, please refer to products from the NHC and NWS.

MarioProtVI
Category 4
Category 4
Posts: 935
Age: 24
Joined: Sun Sep 29, 2019 7:33 pm
Location: New Jersey

Re: 2020 Indicators: SST's / SAL / MSLP / Steering / Shear / Instability / Sat Images

#1976 Postby MarioProtVI » Tue Jul 28, 2020 7:55 am

Shell Mound wrote:Personally, I’m starting to think that the subtropical North Atlantic is too warm for an active peak season (August through early September). The emergence of the warm pool, combined with a lingering +PMM, implies a stronger TUTT and also weaker instability over the MDR/Caribbean during the aforementioned timeframe. A “back-loaded” season (from mid-September on) is less likely to be hyperactive, given that late September and October would have to perform as the de facto “peak,” that is, feature record-breaking activity/ACE by a large margin. I think the most bullish forecasts are going to bust. I know, I’ve changed my earlier views, but the recent warming of the subtropics over the past few weeks is dramatic. Note that the subtropical Atlantic is now substantially warmer than the MDR/Caribbean:

https://coralreefwatch.noaa.gov/data/5km/v3.1/current/daily/gif/cur_coraltemp5km_ssta_large.gif
https://coralreefwatch.noaa.gov/data/5km/v3.1/current/daily/gif/cur_coraltemp5km_ssttrend_007d_large.gif

Let’s not forget where 2010 was at this time:
Image

Other then a rapidly intensifying strong La Niña, the Atlantic SST profiles are almost identical (even identical hot blobs in the Northern Pacific which is a sign of a -PDO). We all know what happens after August 15, so this should not be used to write off the odds of a hyperactive season. In fact, the North Atlantic was substantially warmer then the MDR in late August/early September of 2010 and we had several hurricanes and majors plow through the open Atlantic.
8 likes   

TheStormExpert

Re: 2020 Indicators: SST's / SAL / MSLP / Steering / Shear / Instability / Sat Images

#1977 Postby TheStormExpert » Tue Jul 28, 2020 11:47 am

Just checked the SST Anomalies and man did the warm SST’s surrounding South Florida take a hit! What happened? I know there was Hanna but would that seriously have been enough to put a dent in the anomalies even with the TCHP?

Image

Image
0 likes   

USTropics
Professional-Met
Professional-Met
Posts: 2651
Joined: Sun Aug 12, 2007 3:45 am
Location: Florida State University

Re: 2020 Indicators: SST's / SAL / MSLP / Steering / Shear / Instability / Sat Images

#1978 Postby USTropics » Tue Jul 28, 2020 12:03 pm

Due to the topography of the area (i.e. shallower waters), it's susceptible to large swings given localized weather patterns. In this instance, a passage of a tropical wave (the invest before Hanna) followed by the inverted trough that eventually spawned Hanna.

Image
6 likes   

User avatar
FireRat
Category 5
Category 5
Posts: 1246
Age: 38
Joined: Sun Sep 26, 2010 11:38 pm
Location: North Carolina

Re: 2020 Indicators: SST's / SAL / MSLP / Steering / Shear / Instability / Sat Images

#1979 Postby FireRat » Tue Jul 28, 2020 2:16 pm

Current Sea Surface Temperatures (Celcius). Plenty of Hurricane fuel out there, no matter the anomalies...

Image

Notice how warm it's off the Carolinas and south of Cuba. No bueno is any storms pass over these waters, and FL is plenty warm too, about 84 degrees F.
7 likes   
Georges '98, Irene '99, Frances '04, Jeanne '04, Katrina '05, Wilma '05, Gustav '08, Isaac '12, Matthew '16, Florence '18, Michael '18, Ian '22

User avatar
aspen
Category 5
Category 5
Posts: 8818
Joined: Sat Oct 12, 2019 7:10 pm
Location: Connecticut, USA

Re: 2020 Indicators: SST's / SAL / MSLP / Steering / Shear / Instability / Sat Images

#1980 Postby aspen » Tue Jul 28, 2020 8:18 pm

2020 has entered a couple of special lists of seasons due to its exceptional July activity. With 4 named storms, 2 AEW-based systems, and 1 AEW-based hurricane, it’s had one of the most active Julys on record in the Atlantic. It is one of 14 seasons since 1980 with >=2 July systems, 15 seasons with >=1 AEW July system, and 7 seasons with >=2 AEW July systems and >=1 AEW July hurricane. All lists include some of the most active seasons in recent years, and the mean season numbers for all three lists are above-average to near hyperactive.

SEASONAL AVERAGE (any AEW July system)
—1985, 1989, 1990, 1995, 1996, 1998, 2003, 2004, 2005, 2008, 2010, 2011, 2013, 2017, 2018
—16.1 named storms
—8.7 hurricanes
—3.9 majors
—158.66 ACE

SEASONAL AVERAGE (at least 2 July systems)
—1985, 1989, 1990, 1995, 1996, 1997, 2003, 2005, 2006, 2008, 2011, 2013, 2017, 2018
—15.1 named storms
—7.6 hurricanes
—3.4 majors
—137.52 ACE

SEASONAL AVERAGE (at least 2 AEW July systems and at least 1 July AEW hurricane)
—1989, 1990, 1996, 2003, 2005, 2008, 2018
—16.1 named storms
—8.9 hurricanes
—3.7 majors
—157.62 ACE

For comparison, the average of seasons with non-AEW July systems and those with only one July storm are significantly lower, even if some of the hyperactive seasons do overlap into these lists.

SEASONAL AVERAGE (any non-AEW July system)
—1985, 1989, 1990, 1991, 1995, 1997, 2002, 2004, 2006, 2007, 2008, 2011, 2014, 2015, 2017, 2018, 2019
—13.4 named storms
—6.6 hurricanes
—2.9 majors
—115.40 ACE

SEASONAL AVERAGE (only 1 July system of any type)
—1991, 1998, 2002, 2004, 2007, 2010, 2014, 2015, 2019
—13.3 named storms
—6.8 hurricanes
—3.0 majors
—112.57 ACE

If you were to exclude the record-breaking pace of this season and just focus on July activity, 2020 is highly likely to be a significantly above average or hyperactive season. The average ACE of the seasons that had comparable July activity is 140-160, while those with less July activity are around 110-115 ACE. And that’s not even taking into account all of the other signals for an extremely active season.
9 likes   
Irene '11 Sandy '12 Hermine '16 5/15/2018 Derecho Fay '20 Isaias '20 Elsa '21 Henri '21 Ida '21

I am only a meteorology enthusiast who knows a decent amount about tropical cyclones. Look to the professional mets, the NHC, or your local weather office for the best information.


Return to “Talkin' Tropics”

Who is online

Users browsing this forum: abajan, IsabelaWeather, riapal, TampaWxLurker and 54 guests