2020 Indicators: SST's / SAL / MSLP / Steering / Shear / Instability / Sat Images
Moderator: S2k Moderators
Forum rules

The posts in this forum are NOT official forecasts and should not be used as such. They are just the opinion of the poster and may or may not be backed by sound meteorological data. They are NOT endorsed by any professional institution or STORM2K. For official information, please refer to products from the National Hurricane Center and National Weather Service.
-
TheStormExpert
Re: 2020 Indicators: SST's / SAL / MSLP / Steering / Shear / Instability / Sat Images
If a TUTT does indeed setup ship in the Central Atlantic you can forget seeing any long-tracking big ACE producing Cape Verde hurricanes unless something we’re to head due west at a low latitude and track through the Caribbean into CA, Mexico, or the Gulf of Mexico. Conditions may be more favorable there.
1 likes

Re: 2020 Indicators: SST's / SAL / MSLP / Steering / Shear / Instability / Sat Images
TheStormExpert wrote:If a TUTT does indeed setup ship in the Central Atlantic you can forget seeing any long-tracking big ACE producing Cape Verde hurricanes unless something we’re to head due west at a low latitude and track through the Caribbean into CA, Mexico, or the Gulf of Mexico. Conditions may be more favorable there.
Yeah, i realize that. Only other possibility would be for something to cross underneath the nose of the trough and resume on the west side (or bust through it ala TD #10 2005 and emerge on the other side as a new entity TD #12/Katrina). So if I understand you better, you're saying the clock is ticking on the Cape Verde Season. I agree with that as it usually runs between 3-5 weeks (though waves come off way before and after obviously).
I guess I didn't put the 2 and 2 together that your comment was based on ACE and long-tracker(s) contribution thereto. I'm on record posing the question of whether or not ACE will be a meaningful indicator for 2020. It may not tell a complete picture or could miss the proverbial forest for the trees if we continue getting short-lived storms (or initial low-ACE systems) that intensify very close to landfall as many have thus far.
I'm just an observer and have no agenda on this.
2 likes
-
toad strangler

- S2K Supporter

- Posts: 4546
- Joined: Sun Jul 28, 2013 3:09 pm
- Location: Earth
- Contact:
Re: 2020 Indicators: SST's / SAL / MSLP / Steering / Shear / Instability / Sat Images
Steve wrote:TheStormExpert wrote:If a TUTT does indeed setup ship in the Central Atlantic you can forget seeing any long-tracking big ACE producing Cape Verde hurricanes unless something we’re to head due west at a low latitude and track through the Caribbean into CA, Mexico, or the Gulf of Mexico. Conditions may be more favorable there.
Yeah, i realize that. Only other possibility would be for something to cross underneath the nose of the trough and resume on the west side (or bust through it ala TD #10 2005 and emerge on the other side as a new entity TD #12/Katrina). So if I understand you better, you're saying the clock is ticking on the Cape Verde Season. I agree with that as it usually runs between 3-5 weeks (though waves come off way before and after obviously).
I guess I didn't put the 2 and 2 together that your comment was based on ACE and long-tracker(s) contribution thereto. I'm on record posing the question of whether or not ACE will be a meaningful indicator for 2020. It may not tell a complete picture or could miss the proverbial forest for the trees if we continue getting short-lived storms (or initial low-ACE systems) that intensify very close to landfall as many have thus far.
I'm just an observer and have no agenda on this.
I mentioned yesterday that personally, ACE means nothing to me. We've already had three hurricane strikes on the CONUS. That's a full year PLUS in itself. I am very wary at what mid Sept to late October may bring. Another landfall will make 2020 epic regardless of ACE.
2 likes
My Weather Station
https://www.wunderground.com/dashboard/pws/KFLPORTS603
https://www.wunderground.com/dashboard/pws/KFLPORTS603
-
TheStormExpert
Re: 2020 Indicators: SST's / SAL / MSLP / Steering / Shear / Instability / Sat Images
toad strangler wrote:Steve wrote:TheStormExpert wrote:If a TUTT does indeed setup ship in the Central Atlantic you can forget seeing any long-tracking big ACE producing Cape Verde hurricanes unless something we’re to head due west at a low latitude and track through the Caribbean into CA, Mexico, or the Gulf of Mexico. Conditions may be more favorable there.
Yeah, i realize that. Only other possibility would be for something to cross underneath the nose of the trough and resume on the west side (or bust through it ala TD #10 2005 and emerge on the other side as a new entity TD #12/Katrina). So if I understand you better, you're saying the clock is ticking on the Cape Verde Season. I agree with that as it usually runs between 3-5 weeks (though waves come off way before and after obviously).
I guess I didn't put the 2 and 2 together that your comment was based on ACE and long-tracker(s) contribution thereto. I'm on record posing the question of whether or not ACE will be a meaningful indicator for 2020. It may not tell a complete picture or could miss the proverbial forest for the trees if we continue getting short-lived storms (or initial low-ACE systems) that intensify very close to landfall as many have thus far.
I'm just an observer and have no agenda on this.
I mentioned yesterday that personally, ACE means nothing to me. We've already had three hurricane strikes on the CONUS. That's a full year PLUS in itself. I am very wary at what mid Sept to late October may bring. Another landfall will make 2020 epic regardless of ACE.
Yep. We may only see an ACE unit 120-140 for example but could see more in-close development like Hanna, Isaias, and Laura and still have an epic season. Same goes for numbers. The long-trackers that either recurve and remain”Fish Storms” or affect land at some point are what produce all the ACE. I think Joe B. uses San impact scale more as opposed to ACE I heard? Then again as many have stated he is also highlighting 80% of coastal land areas in the Atlantic so he’s more likely to be correct than not!
0 likes
Re: 2020 Indicators: SST's / SAL / MSLP / Steering / Shear / Instability / Sat Images
toad strangler wrote:Steve wrote:TheStormExpert wrote:If a TUTT does indeed setup ship in the Central Atlantic you can forget seeing any long-tracking big ACE producing Cape Verde hurricanes unless something we’re to head due west at a low latitude and track through the Caribbean into CA, Mexico, or the Gulf of Mexico. Conditions may be more favorable there.
Yeah, i realize that. Only other possibility would be for something to cross underneath the nose of the trough and resume on the west side (or bust through it ala TD #10 2005 and emerge on the other side as a new entity TD #12/Katrina). So if I understand you better, you're saying the clock is ticking on the Cape Verde Season. I agree with that as it usually runs between 3-5 weeks (though waves come off way before and after obviously).
I guess I didn't put the 2 and 2 together that your comment was based on ACE and long-tracker(s) contribution thereto. I'm on record posing the question of whether or not ACE will be a meaningful indicator for 2020. It may not tell a complete picture or could miss the proverbial forest for the trees if we continue getting short-lived storms (or initial low-ACE systems) that intensify very close to landfall as many have thus far.
I'm just an observer and have no agenda on this.
I mentioned yesterday that personally, ACE means nothing to me. We've already had three hurricane strikes on the CONUS. That's a full year PLUS in itself. I am very wary at what mid Sept to late October may bring. Another landfall will make 2020 epic regardless of ACE.
I read that post and knew what you were saying. For me, ACE is a legit measure of cyclone energy though it requires a lot of caveats. The number is important in longer term data and for future analysis. But as you said (and I had questioned a couple days before that), does it matter for 2020? All I can come up with is I'm not sure and I don't think it will tell the full story if the seasonal numbers hit extreme levels with an ACE far below hyperactivity. It could all be a moot point with a 40+ ACE long tracking system (be it Cape Verde or central Atlantic). Or we could have 5/6 US hurricane landfalls and a 130 or so.
I'm certainly curious to see how it all plays out between now and November.
0 likes
-
Monsoonjr99
- Tropical Storm

- Posts: 210
- Age: 26
- Joined: Fri Sep 21, 2018 11:22 pm
- Location: Inland Empire, SoCal
Re: 2020 Indicators: SST's / SAL / MSLP / Steering / Shear / Instability / Sat Images
Perhaps it is still too early to cancel Cape Verde season thanks to the record strong West African Monsoon. As we saw the past couple years, August in the MDR was anemic with a northward-displaced ITCZ and waves exiting too far north, but in September CV season lit up (hurricanes Florence, Helene, Isaac, Jerry, and Lorenzo). MDR activity then continued into October both years with Nadine and TD 15 thanks to the strong northward-displaced waves.
It seems to me that a strong WAM delays CV season, suppressing August activity but enhancing October activity in the MDR. With this year's WAM off the charts, I wonder if this delay could be even more pronounced. So far, waves have been very broad and struggled to organize in the MDR (some still developed in the western Atlantic i.e. Isaias, Laura) and the ITCZ has been displaced unusually far north. This might also explain the current late SAL outbreak. Activity should pick up sometime in September as the ITCZ retreats south. As for October, there may be another Nadine or 15L, or maybe even something stronger if CV season is heavily delayed. Could we see a hurricane in the MDR in OCTOBER?
It seems to me that a strong WAM delays CV season, suppressing August activity but enhancing October activity in the MDR. With this year's WAM off the charts, I wonder if this delay could be even more pronounced. So far, waves have been very broad and struggled to organize in the MDR (some still developed in the western Atlantic i.e. Isaias, Laura) and the ITCZ has been displaced unusually far north. This might also explain the current late SAL outbreak. Activity should pick up sometime in September as the ITCZ retreats south. As for October, there may be another Nadine or 15L, or maybe even something stronger if CV season is heavily delayed. Could we see a hurricane in the MDR in OCTOBER?
5 likes
The posts in this forum are NOT official forecasts and should not be used as such. They are just the opinion of the poster and may or may not be backed by sound meteorological data. They are NOT endorsed by any professional institution or STORM2K. For official information, please refer to products from the NHC and NWS.
Some Californian who codes things and tracks weather.
Kay '22, Hilary '23
Re: 2020 Indicators: SST's / SAL / MSLP / Steering / Shear / Instability / Sat Images
TheStormExpert wrote:toad strangler wrote:Steve wrote:
Yeah, i realize that. Only other possibility would be for something to cross underneath the nose of the trough and resume on the west side (or bust through it ala TD #10 2005 and emerge on the other side as a new entity TD #12/Katrina). So if I understand you better, you're saying the clock is ticking on the Cape Verde Season. I agree with that as it usually runs between 3-5 weeks (though waves come off way before and after obviously).
I guess I didn't put the 2 and 2 together that your comment was based on ACE and long-tracker(s) contribution thereto. I'm on record posing the question of whether or not ACE will be a meaningful indicator for 2020. It may not tell a complete picture or could miss the proverbial forest for the trees if we continue getting short-lived storms (or initial low-ACE systems) that intensify very close to landfall as many have thus far.
I'm just an observer and have no agenda on this.
I mentioned yesterday that personally, ACE means nothing to me. We've already had three hurricane strikes on the CONUS. That's a full year PLUS in itself. I am very wary at what mid Sept to late October may bring. Another landfall will make 2020 epic regardless of ACE.
Yep. We may only see an ACE unit 120-140 for example but could see more in-close development like Hanna, Isaias, and Laura and still have an epic season. Same goes for numbers. The long-trackers that either recurve and remain”Fish Storms” or affect land at some point are what produce all the ACE. I think Joe B. uses San impact scale more as opposed to ACE I heard? Then again as many have stated he is also highlighting 80% of coastal land areas in the Atlantic so he’s more likely to be correct than not!
That's a point that I should have brought up a couple pages back when it was a topic among some other posters. Someone said they had a problem with the map from the get-go because it shows the majority of the US Coast at risk (except Big Bend, FL, Coasts of Maine and New Hampshire, and GA Atlantic coast). But the map isn't saying "look for landfall anywhere on the coast, I'm right!" What it says is that he believes the majority of ACE (I think 50% is within the gold/brown shading) and the red specifically is highest risk for impacts and covers the northern islands, GA's, Bahamas and most of the US Coastline. He doesn't define it more than "highest risk for impacts."
Last edited by Steve on Mon Aug 31, 2020 2:25 pm, edited 1 time in total.
0 likes
-
MarioProtVI
- Category 5

- Posts: 1034
- Age: 24
- Joined: Sun Sep 29, 2019 7:33 pm
- Location: New Jersey
Re: 2020 Indicators: SST's / SAL / MSLP / Steering / Shear / Instability / Sat Images
Man I feel like we stepped back to August 20 instead of September 1 with all these “Cape Verde season is canceled” “ACE will bust” etc. posts  This is climatologically the most active part of the season and I still strongly believe Laura was the first of many strong storms to come, regardless if they’re in the Caribbean or MDR. Some of the models like the Euro, CMC and GFS-para and it’s ensembles are detecting some MDR activity in the future so I think we’re going to be going in high gear very soon. It’s just different this year because most of the models (sans CMC and the GFS-para at times) have been garbage especially the MDR genesis so we’re basically walking into September blind but we know the conditions are there. I still think we will see two to three MDR long-trackers (one of them a major probably) which should add a good chunk of ACE. Maybe the big burst comes a bit later towards the 11th–15th. 1998 was such an example that really got going in September after mid-month. I think the immense activity and high expectations we’ve seen so far has made people squirm and scream “season cancel!!!11!1!” the minute something looks off on the models or the conditions being slightly offset.
For the models I’ll refer back to something Hammy said, in which perhaps they are struggling to detect some unknown favourable factor and is thus refusing to spin anything up — the opposite of 2013. Another factor possibly is that they are flopping because of the lack of air data because of COVID (yes there is still planes flying but it’s significantly less then usual, and there is studies that prove data from those help with models so with a reduction in such could also be why they are failing to develop anything) As for the TUTT subject, we still don’t know how much this will affect the PV pattern and TUTT, so model projections of that should be taken with a grain of salt.
Maybe we don’t hit 200 ACE as predicted but I still think 160–185 ACE is still likely or plausible as we have September October and November to go, and October could also be trouble too given the Caribbean has been much more favourable this year then others. Just have patience people the strong storms will come!
Last edited by MarioProtVI on Mon Aug 31, 2020 1:44 pm, edited 1 time in total.
5 likes
-
MarioProtVI
- Category 5
- Posts: 1034
- Age: 24
- Joined: Sun Sep 29, 2019 7:33 pm
- Location: New Jersey
Re: 2020 Indicators: SST's / SAL / MSLP / Steering / Shear / Instability / Sat Images
Monsoonjr99 wrote:Perhaps it is still too early to cancel Cape Verde season thanks to the record strong West African Monsoon. As we saw the past couple years, August in the MDR was anemic with a northward-displaced ITCZ and waves exiting too far north, but in September CV season lit up (hurricanes Florence, Helene, Isaac, Jerry, and Lorenzo). MDR activity then continued into October both years with Nadine and TD 15 thanks to the strong northward-displaced waves.
It seems to me that a strong WAM delays CV season, suppressing August activity but enhancing October activity in the MDR. With this year's WAM off the charts, I wonder if this delay could be even more pronounced. So far, waves have been very broad and struggled to organize in the MDR (some still developed in the western Atlantic i.e. Isaias, Laura) and the ITCZ has been displaced unusually far north. This might also explain the current late SAL outbreak. Activity should pick up sometime in September as the ITCZ retreats south. As for October, there may be another Nadine or 15L, or maybe even something stronger if CV season is heavily delayed. Could we see a hurricane in the MDR in OCTOBER?
My points exactly.
0 likes
-
cheezyWXguy
- Category 5
- Posts: 6282
- Joined: Mon Feb 13, 2006 12:29 am
- Location: Dallas, TX
Re: 2020 Indicators: SST's / SAL / MSLP / Steering / Shear / Instability / Sat Images
Steve wrote:TheStormExpert wrote:toad strangler wrote:
I mentioned yesterday that personally, ACE means nothing to me. We've already had three hurricane strikes on the CONUS. That's a full year PLUS in itself. I am very wary at what mid Sept to late October may bring. Another landfall will make 2020 epic regardless of ACE.
Yep. We may only see an ACE unit 120-140 for example but could see more in-close development like Hanna, Isaias, and Laura and still have an epic season. Same goes for numbers. The long-trackers that either recurve and remain”Fish Storms” or affect land at some point are what produce all the ACE. I think Joe B. uses San impact scale more as opposed to ACE I heard? Then again as many have stated he is also highlighting 80% of coastal land areas in the Atlantic so he’s more likely to be correct than not!
That's a point that I should have brought up a couple pages back when it was a topic among some other posters. Someone said they had a problem with the map from the get-go because it shows the majority of the US Coast at risk (except Big Bend, FL, Coasts of Maine and New Hampshire, and GA Atlantic coast). But the map isn't saying "look for landfall anywhere on the coast, I'm right!" What it says is that he believes the majority of ACE (I think 50% is within the gold/brown shading) and the red specifically is highest risk for impacts and covers the northern islands, GA's, Bahamas and most of the US Coastline. He doesn't define it more than "highest risk for impacts."
That was me, haha, or at least I was one of them. In my opinion, if the message he is trying to convey was related to ace as well as impacts, he should be outlining ocean areas as well as coastal areas and say, “these are the areas where I expect >50% of total ace to occur.” It would make much more of a statement to highlight the northern Caribbean, Gulf of Mexico, and east of Florida with risk areas while excluding the rest of the Atlantic, since it would be a more definitive deviation from climatology and more specific to this season.
1 likes
-
Aric Dunn
- Category 5
- Posts: 21238
- Age: 43
- Joined: Sun Sep 19, 2004 9:58 pm
- Location: Ready for the Chase.
- Contact:
Re: 2020 Indicators: SST's / SAL / MSLP / Steering / Shear / Instability / Sat Images
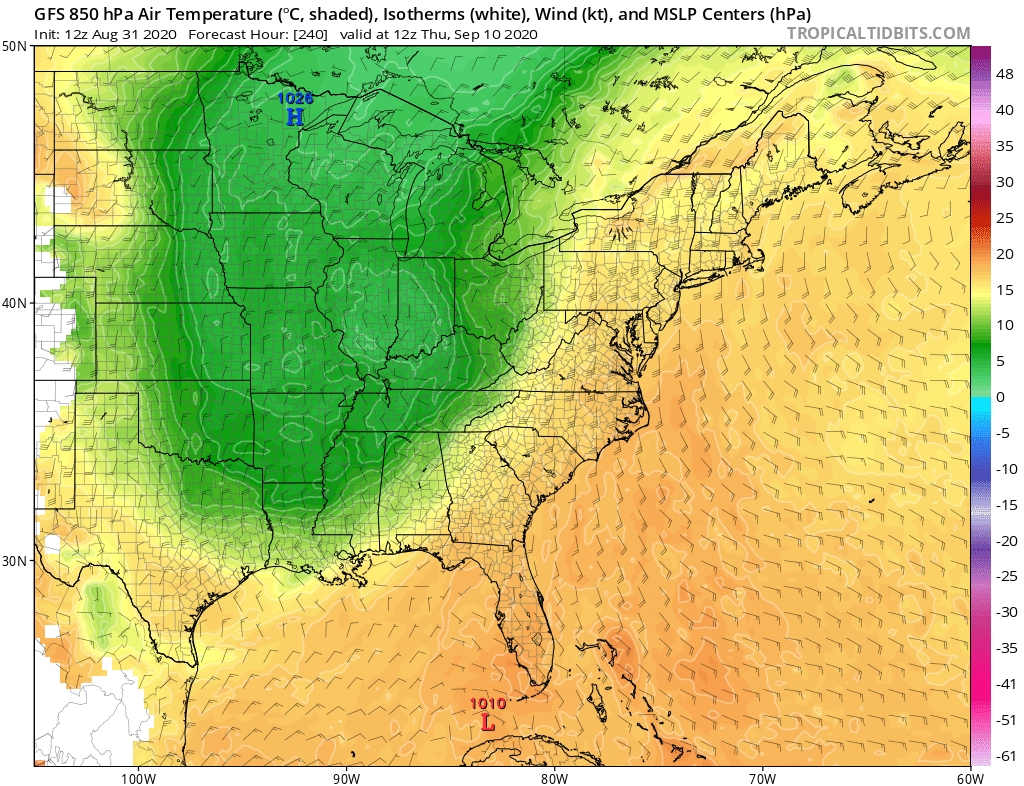
How is this indicator for you.. lol
euro..
40s and 50 into the gulf of mexico in earlt September. lol
rigghttt..
lol season canceled now right ?

euro..
40s and 50 into the gulf of mexico in earlt September. lol
rigghttt..
lol season canceled now right ?
1 likes
Note: If I make a post that is brief. Please refer back to previous posts for the analysis or reasoning. I do not re-write/qoute what my initial post said each time.
If there is nothing before... then just ask
Space & Atmospheric Physicist, Embry-Riddle Aeronautical University,
I believe the sky is falling...
If there is nothing before... then just ask
Space & Atmospheric Physicist, Embry-Riddle Aeronautical University,
I believe the sky is falling...
-
gatorcane

- S2K Supporter
- Posts: 23708
- Age: 48
- Joined: Sun Mar 13, 2005 3:54 pm
- Location: Boca Raton, FL
Re: 2020 Indicators: SST's / SAL / MSLP / Steering / Shear / Instability / Sat Images
Aric Dunn wrote:How is this indicator for you.. lol
euro..
40s and 50 into the gulf of mexico in earlt September. lol
rigghttt..
lol season canceled now right ?
https://www.tropicaltidbits.com/analysis/models/ecmwf/2020083112/ecmwf_T850_eus_11.png
Surprisingly the GFS isn’t much different. Recurving typhoons to blame?
1 likes

Re: 2020 Indicators: SST's / SAL / MSLP / Steering / Shear / Instability / Sat Images
gatorcane wrote:Aric Dunn wrote:How is this indicator for you.. lol
euro..
40s and 50 into the gulf of mexico in earlt September. lol
rigghttt..
lol season canceled now right ?
https://www.tropicaltidbits.com/analysis/models/ecmwf/2020083112/ecmwf_T850_eus_11.png
Surprisingly the GFS isn’t much different. Recurving typhoons to blame?
https://i.postimg.cc/9MBfqf27/gfs-T850-eus-41.png
This is probably going to depend on how strong 11W gets. The GFS and Euro, as well as the UKMET, are showing it bombing out to 900-925 mbar, but if Maysak is any indication, this too could struggle and fail to reach such a crazy intensity.
0 likes
Irene '11 Sandy '12 Hermine '16 5/15/2018 Derecho Fay '20 Isaias '20 Elsa '21 Henri '21 Ida '21
I am only a meteorology enthusiast who knows a decent amount about tropical cyclones. Look to the professional mets, the NHC, or your local weather office for the best information.
I am only a meteorology enthusiast who knows a decent amount about tropical cyclones. Look to the professional mets, the NHC, or your local weather office for the best information.
-
SFLcane

- S2K Supporter
- Posts: 10281
- Age: 48
- Joined: Sat Jun 05, 2010 1:44 pm
- Location: Lake Worth Florida
Re: 2020 Indicators: SST's / SAL / MSLP / Steering / Shear / Instability / Sat Images
gatorcane wrote:Aric Dunn wrote:How is this indicator for you.. lol
euro..
40s and 50 into the gulf of mexico in earlt September. lol
rigghttt..
lol season canceled now right ?
https://www.tropicaltidbits.com/analysis/models/ecmwf/2020083112/ecmwf_T850_eus_11.png
Surprisingly the GFS isn’t much different. Recurving typhoons to blame?
https://i.postimg.cc/9MBfqf27/gfs-T850-eus-41.png
Yes typhoons can do that. Quite the front.
0 likes

Re: 2020 Indicators: SST's / SAL / MSLP / Steering / Shear / Instability / Sat Images
toad strangler wrote:Steve wrote:TheStormExpert wrote:If a TUTT does indeed setup ship in the Central Atlantic you can forget seeing any long-tracking big ACE producing Cape Verde hurricanes unless something we’re to head due west at a low latitude and track through the Caribbean into CA, Mexico, or the Gulf of Mexico. Conditions may be more favorable there.
Yeah, i realize that. Only other possibility would be for something to cross underneath the nose of the trough and resume on the west side (or bust through it ala TD #10 2005 and emerge on the other side as a new entity TD #12/Katrina). So if I understand you better, you're saying the clock is ticking on the Cape Verde Season. I agree with that as it usually runs between 3-5 weeks (though waves come off way before and after obviously).
I guess I didn't put the 2 and 2 together that your comment was based on ACE and long-tracker(s) contribution thereto. I'm on record posing the question of whether or not ACE will be a meaningful indicator for 2020. It may not tell a complete picture or could miss the proverbial forest for the trees if we continue getting short-lived storms (or initial low-ACE systems) that intensify very close to landfall as many have thus far.
I'm just an observer and have no agenda on this.
I mentioned yesterday that personally, ACE means nothing to me. We've already had three hurricane strikes on the CONUS. That's a full year PLUS in itself. I am very wary at what mid Sept to late October may bring. Another landfall will make 2020 epic regardless of ACE.
Yea theres already been a season's worth of activity with the peak incoming. Conditions have not reached peak favorability yet and that is troubling. Models lighting up with storm after storm showing the most signals they've had all year. All the major forecasts seem to be verifying and when it's all said and done they may have under forecast activity. It would appear that the overall background conditions are so favorable that only hurricane models can pick up on them which is why theyve been the best at genesis this year. In the prediction thread I said there would be 15 storms in September. Obviously that's on the really high side but I wouldnt be surprised if it's closer than not.This is just my opinion though so take it for what it is I have no scientific data to back it up.
1 likes
-
CyclonicFury

- Category 5
- Posts: 2033
- Age: 27
- Joined: Sun Jul 02, 2017 12:32 pm
- Location: NC
- Contact:
Re: 2020 Indicators: SST's / SAL / MSLP / Steering / Shear / Instability / Sat Images
St0rmTh0r wrote:toad strangler wrote:Steve wrote:
Yeah, i realize that. Only other possibility would be for something to cross underneath the nose of the trough and resume on the west side (or bust through it ala TD #10 2005 and emerge on the other side as a new entity TD #12/Katrina). So if I understand you better, you're saying the clock is ticking on the Cape Verde Season. I agree with that as it usually runs between 3-5 weeks (though waves come off way before and after obviously).
I guess I didn't put the 2 and 2 together that your comment was based on ACE and long-tracker(s) contribution thereto. I'm on record posing the question of whether or not ACE will be a meaningful indicator for 2020. It may not tell a complete picture or could miss the proverbial forest for the trees if we continue getting short-lived storms (or initial low-ACE systems) that intensify very close to landfall as many have thus far.
I'm just an observer and have no agenda on this.
I mentioned yesterday that personally, ACE means nothing to me. We've already had three hurricane strikes on the CONUS. That's a full year PLUS in itself. I am very wary at what mid Sept to late October may bring. Another landfall will make 2020 epic regardless of ACE.
Yea theres already been a season's worth of activity with the peak incoming. Conditions have not reached peak favorability yet and that is troubling. Models lighting up with storm after storm showing the most signals they've had all year. All the major forecasts seem to be verifying and when it's all said and done they may have under forecast activity. It would appear that the overall background conditions are so favorable that only hurricane models can pick up on them which is why theyve been the best at genesis this year. In the prediction thread I said there would be 15 storms in September. Obviously that's on the really high side but I wouldnt be surprised if it's closer than not.This is just my opinion though so take it for what it is I have no scientific data to back it up.
There's not going to be 15 storms in September. The all-time record is 8, that would be 7 more than the record. For their to be 15 named storms in September we'd need a storm to form every other day. I'm not convinced that is meteorologically possible.
6 likes
NCSU B.S. in Meteorology Class of 2021. Tropical weather blogger at http://www.cyclonicfury.com. My forecasts and thoughts are NOT official, for official forecasts please consult the National Hurricane Center.

Re: 2020 Indicators: SST's / SAL / MSLP / Steering / Shear / Instability / Sat Images
CyclonicFury wrote:St0rmTh0r wrote:toad strangler wrote:
I mentioned yesterday that personally, ACE means nothing to me. We've already had three hurricane strikes on the CONUS. That's a full year PLUS in itself. I am very wary at what mid Sept to late October may bring. Another landfall will make 2020 epic regardless of ACE.
Yea theres already been a season's worth of activity with the peak incoming. Conditions have not reached peak favorability yet and that is troubling. Models lighting up with storm after storm showing the most signals they've had all year. All the major forecasts seem to be verifying and when it's all said and done they may have under forecast activity. It would appear that the overall background conditions are so favorable that only hurricane models can pick up on them which is why theyve been the best at genesis this year. In the prediction thread I said there would be 15 storms in September. Obviously that's on the really high side but I wouldnt be surprised if it's closer than not.This is just my opinion though so take it for what it is I have no scientific data to back it up.
There's not going to be 15 storms in September. The all-time record is 8, that would be 7 more than the record. For their to be 15 named storms in September we'd need a storm to form every other day. I'm not convinced that is meteorologically possible.
I could easily see 14-15 more occurring the remainder of the season though, as that's the number that occurred after this point last year.
2 likes
The above post is not official and should not be used as such. It is the opinion of the poster and may or may not be backed by sound meteorological data. It is not endorsed by any professional institution or storm2k.org. For official information, please refer to the NHC and NWS products.
Re: 2020 Indicators: SST's / SAL / MSLP / Steering / Shear / Instability / Sat Images
cheezyWXguy wrote:Steve wrote:TheStormExpert wrote:Yep. We may only see an ACE unit 120-140 for example but could see more in-close development like Hanna, Isaias, and Laura and still have an epic season. Same goes for numbers. The long-trackers that either recurve and remain”Fish Storms” or affect land at some point are what produce all the ACE. I think Joe B. uses San impact scale more as opposed to ACE I heard? Then again as many have stated he is also highlighting 80% of coastal land areas in the Atlantic so he’s more likely to be correct than not!
That's a point that I should have brought up a couple pages back when it was a topic among some other posters. Someone said they had a problem with the map from the get-go because it shows the majority of the US Coast at risk (except Big Bend, FL, Coasts of Maine and New Hampshire, and GA Atlantic coast). But the map isn't saying "look for landfall anywhere on the coast, I'm right!" What it says is that he believes the majority of ACE (I think 50% is within the gold/brown shading) and the red specifically is highest risk for impacts and covers the northern islands, GA's, Bahamas and most of the US Coastline. He doesn't define it more than "highest risk for impacts."
That was me, haha, or at least I was one of them. In my opinion, if the message he is trying to convey was related to ace as well as impacts, he should be outlining ocean areas as well as coastal areas and say, “these are the areas where I expect >50% of total ace to occur.” It would make much more of a statement to highlight the northern Caribbean, Gulf of Mexico, and east of Florida with risk areas while excluding the rest of the Atlantic, since it would be a more definitive deviation from climatology and more specific to this season.
I think that's what it says? He says (> 50% of total activity). I guess that's technically ambiguous and /= "ACE" necessarily. So I see that point now. https://www.weatherbell.com/may-2020-hu ... son-update
0 likes
-
cheezyWXguy
- Category 5
- Posts: 6282
- Joined: Mon Feb 13, 2006 12:29 am
- Location: Dallas, TX
Re: 2020 Indicators: SST's / SAL / MSLP / Steering / Shear / Instability / Sat Images
Steve wrote:cheezyWXguy wrote:Steve wrote:
That's a point that I should have brought up a couple pages back when it was a topic among some other posters. Someone said they had a problem with the map from the get-go because it shows the majority of the US Coast at risk (except Big Bend, FL, Coasts of Maine and New Hampshire, and GA Atlantic coast). But the map isn't saying "look for landfall anywhere on the coast, I'm right!" What it says is that he believes the majority of ACE (I think 50% is within the gold/brown shading) and the red specifically is highest risk for impacts and covers the northern islands, GA's, Bahamas and most of the US Coastline. He doesn't define it more than "highest risk for impacts."
That was me, haha, or at least I was one of them. In my opinion, if the message he is trying to convey was related to ace as well as impacts, he should be outlining ocean areas as well as coastal areas and say, “these are the areas where I expect >50% of total ace to occur.” It would make much more of a statement to highlight the northern Caribbean, Gulf of Mexico, and east of Florida with risk areas while excluding the rest of the Atlantic, since it would be a more definitive deviation from climatology and more specific to this season.
I think that's what it says? He says (> 50% of total activity). I guess that's technically ambiguous and /= "ACE" necessarily. So I see that point now. https://www.weatherbell.com/may-2020-hu ... son-update
Oof. That’s what I get for making a claim without going back and checking the diagram first. I retract my statement. My false memory was that only the areas in red were highlighted at all. I would update my criticism to say he’s still quite generous with the red, but it’s not as bad as I remember.
1 likes
Who is online
Users browsing this forum: No registered users and 117 guests