Even the ASCAT may underestimete the cyclone, I don't think it is (was) stronger than 55 kt.

Moderator: S2k Moderators


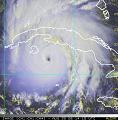
Vince_and_Grace_fan wrote:Based on the latest data, it looks that it didn't reached the hurricane intensty despite the very nice structure. ASCAT-C at 19:11 UTC passed through the entire circulation but measured maximum winds only around 45 kt, and a partial ASCAT-B pass at 19:58 UTC showed 40 kt winds on the eastern side. In addition, the center is very near to Zakynthos but the pressure is only 998,3 hPa there currently.
Even the ASCAT may underestimete the cyclone, I don't think it is (was) stronger than 55 kt.
https://i.imgur.com/ka7rTVk.png


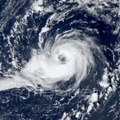
TheAustinMan wrote:As promised, here's that 22:31 UTC high-resolution microwave image of Ianos as it begins to bear down on the islands of Kelafonia and Zakynthos, revealing a banding eye with a nearly complete eyewall and confirming the internal structure that could be inferred from infrared and visibles from the afternoon. Based on satellite imagery they should be within the storm's radius of maximum wind as the center of the eye slips between the two.
643 KB. Source: EOSDIS Worldview
https://i.imgur.com/gNKZEai.png


cheezyWXguy wrote:I've never seen a tropical storm with a convective structure that well organized. Even if cloud tops are warm by Atlantic standards, I doubt this is below 60kt.


cheezyWXguy wrote:TheAustinMan wrote:As promised, here's that 22:31 UTC high-resolution microwave image of Ianos as it begins to bear down on the islands of Kelafonia and Zakynthos, revealing a banding eye with a nearly complete eyewall and confirming the internal structure that could be inferred from infrared and visibles from the afternoon. Based on satellite imagery they should be within the storm's radius of maximum wind as the center of the eye slips between the two.
643 KB. Source: EOSDIS Worldview
https://i.imgur.com/gNKZEai.png
I've never seen a tropical storm with a convective structure that well organized. Even if cloud tops are warm by Atlantic standards, I doubt this is below 60kt.
kevin wrote:Does anyone know what the highest sustained winds are that have been measured so far?


Imran_doomhaMwx wrote:There were a couple of SMAP passes over the storm on Sept 16. The morning pass is incomplete, but you can see some pixels equivalent to about 25m/s (50kts) there. The second pass appears to have captured max wind speeds between 30-35m/s (60-70kts). Looking back on this thread, this was the day when the system was sheared but quickly organized and featured a curved band pattern on satellite.
Maybe someone here is able to access/process high-res SMAP data so we could have a closer look. If this system was included in the ATCF, we could probably see SMAP data automatically processed for it.
https://i.imgur.com/kdgDZoE.png
https://i.imgur.com/oquyMVo.png
SMAP had another pass today but the system's center is already over land.
https://i.imgur.com/PFku5iR.png
Also, here are WindSat passes within the last few days. I don't know how reliable WindSat is, but it seems to me that the winds depicted below are overcooked.
https://i.imgur.com/zcb0962.png
https://i.imgur.com/Vi4QVgg.png
https://i.imgur.com/APU1n7N.png
Vince_and_Grace_fan wrote:Beside the ASCAT I looked the SCATSAT data too in the last days, but I don't know how accurate this instrument is. The 45 kt on Tuesday morning and the 50 kt at Wednesday morning seemed too high, but the 50 kt in the evening hours was lot more realistic (however, the convection already started to weaken by this time after the organized curved band formed in afternoon). It also indicated the slight weakening of the cyclone by yesterday morning, and the evening hours again showed a lot of 50 kt barbs with one or two 55-60 kt which seems better estimate than the ASCAT's 45-50 kt.
https://i.imgur.com/iuKhLSu.png
Users browsing this forum: No registered users and 146 guests

