I am sure hoping that the NMME ASO precipitation model is correct. I see no danger to the east or gulf coast. Interestingly enough I also don’t see any tropical track indicators. The dry Mississippi valley would be welcome after this springs deluge.
But I am skeptical about any long-range models this year. Not one model picked up the record cold in the east in May. The Euro was horrid, it had a warm May.
Will there be another 2013 bust. Maybe, it would be welcome.
2021 Indicators: SST's / SAL / MSLP / Shear / Steering / Instability / Sat Images
Moderator: S2k Moderators
Forum rules

The posts in this forum are NOT official forecasts and should not be used as such. They are just the opinion of the poster and may or may not be backed by sound meteorological data. They are NOT endorsed by any professional institution or STORM2K. For official information, please refer to products from the National Hurricane Center and National Weather Service.
-
OuterBanker
- S2K Supporter

- Posts: 1761
- Joined: Wed Feb 26, 2003 10:53 am
- Location: Nags Head, NC
- Contact:
-
USTropics
- Professional-Met

- Posts: 2739
- Joined: Sun Aug 12, 2007 3:45 am
- Location: Florida State University
Re: 2021 Indicators: SST's / SAL / MSLP / Shear / Steering / Instability / Sat Images
This has been ongoing for decades now, and there is a lot of debate within the meteorology community regarding the impacts a slowdown of the AMOC has on the Atlantic hurricane season. We saw a significant slowdown in 2009 and 2010 that brought unusually cooler anomalous temperatures to Europe (and created a significant hurricane season in 2010). This also occurred in 2004 and 2005. We typically see a peak slowdown in the months of January - March, and then a release before summer.
I strongly recommend listening to this podcast released last week with climate scientist Samantha Hallam if you want more details (her interview starts around 14 minutes in) -https://open.spotify.com/episode/73Lgx26XS0jxGilSEzZDgA?si=Hg1P8TqVQzeowiNTdQmFKw&dl_branch=1
I strongly recommend listening to this podcast released last week with climate scientist Samantha Hallam if you want more details (her interview starts around 14 minutes in) -https://open.spotify.com/episode/73Lgx26XS0jxGilSEzZDgA?si=Hg1P8TqVQzeowiNTdQmFKw&dl_branch=1
7 likes
-
captainbarbossa19

- Professional-Met
- Posts: 1094
- Age: 27
- Joined: Wed Aug 21, 2019 11:09 pm
- Location: Beaumont, TX
Re: 2021 Indicators: SST's / SAL / MSLP / Shear / Steering / Instability / Sat Images
Category5Kaiju wrote:https://twitter.com/Francesco170402/status/1402701229034246147
Wow. We aren't even to July and there is talk of a below-average season. We shall see if this holds when we are in September. Somehow, this season is starting to remind me of 2018 with the cooler tropical Atlantic early on.
3 likes
-
CyclonicFury

- Category 5

- Posts: 2035
- Age: 27
- Joined: Sun Jul 02, 2017 12:32 pm
- Location: NC
- Contact:
Re: 2021 Indicators: SST's / SAL / MSLP / Shear / Steering / Instability / Sat Images
As usual, I think the season cancelling is very premature. It's June 10th, the active part of the season is more than two months away. It's very possible we don't get a hurricane for about two months. I'm not expecting this season to be nearly as active as last year quantity wise, but most indicators still support an above-average season. El Niño development looks very unlikely. The MDR is not particularly warm, but it is substantially warmer than 2018, which was an above average year despite a much warmer ENSO and much colder MDR than this year will likely have.
10 likes
NCSU B.S. in Meteorology Class of 2021. Tropical weather blogger at http://www.cyclonicfury.com. My forecasts and thoughts are NOT official, for official forecasts please consult the National Hurricane Center.
Re: 2021 Indicators: SST's / SAL / MSLP / Shear / Steering / Instability / Sat Images
At least the preseason poll is closed otherwise everyone would be amending their forecasts for like the 12th time contributing to a category 5 case of carpal tunnel for cycloneye...so there's that. We've got some conflicting signals but it's early and that's common. We may get a pass on the early season slop storm this year for change after which we're headed for the moat known as SAL season. We've got a solid 2 months before we really need to sit at attention during which lots of changes will take place. Digging into the moment..while tempting in an absence of activity, is not likely to yield much long term. But I'd still keep an open mind to all of the possibilities including a somewhat slower season. Nevertheless, we're gonna be doing some tracking in aboot 60-80 days or so for sure.
4 likes
-
Category5Kaiju

- Category 5
- Posts: 4334
- Joined: Thu Dec 24, 2020 12:45 pm
- Location: Seattle and Phoenix
Re: 2021 Indicators: SST's / SAL / MSLP / Shear / Steering / Instability / Sat Images
USTropics wrote:This has been ongoing for decades now, and there is a lot of debate within the meteorology community regarding the impacts a slowdown of the AMOC has on the Atlantic hurricane season. We saw a significant slowdown in 2009 and 2010 that brought unusually cooler anomalous temperatures to Europe (and created a significant hurricane season in 2010). This also occurred in 2004 and 2005. We typically see a peak slowdown in the months of January - March, and then a release before summer.
I strongly recommend listening to this podcast released last week with climate scientist Samantha Hallam if you want more details (her interview starts around 14 minutes in) -https://open.spotify.com/episode/73Lgx26XS0jxGilSEzZDgA?si=Hg1P8TqVQzeowiNTdQmFKw&dl_branch=1
Ok, then if something like this happened in those years like 2010 and 2004/2005 (all of which were very intense and active seasons) then why are there some individuals jumping to the conclusion that another 2013 could occur? I personally am not following the lines of thinking here, just curious.
0 likes
Unless explicitly stated, all info in my posts is based on my own opinions and observations. Tropical storms and hurricanes can be extremely dangerous. Refer to an accredited weather research agency or meteorologist if you need to make serious decisions regarding an approaching storm.
-
AutoPenalti
- Category 5
- Posts: 4091
- Age: 29
- Joined: Mon Aug 17, 2015 4:16 pm
- Location: Ft. Lauderdale, Florida
Re: 2021 Indicators: SST's / SAL / MSLP / Shear / Steering / Instability / Sat Images
Category5Kaiju wrote:USTropics wrote:This has been ongoing for decades now, and there is a lot of debate within the meteorology community regarding the impacts a slowdown of the AMOC has on the Atlantic hurricane season. We saw a significant slowdown in 2009 and 2010 that brought unusually cooler anomalous temperatures to Europe (and created a significant hurricane season in 2010). This also occurred in 2004 and 2005. We typically see a peak slowdown in the months of January - March, and then a release before summer.
I strongly recommend listening to this podcast released last week with climate scientist Samantha Hallam if you want more details (her interview starts around 14 minutes in) -https://open.spotify.com/episode/73Lgx26XS0jxGilSEzZDgA?si=Hg1P8TqVQzeowiNTdQmFKw&dl_branch=1
Ok, then if something like this happened in those years like 2010 and 2004/2005 (all of which were very intense and active seasons) then why are there some individuals jumping to the conclusion that another 2013 could occur? I personally am not following the lines of thinking here, just curious.
It happens every year.
4 likes
The posts in this forum are NOT official forecasts and should not be used as such. They are just the opinion of the poster and may or may not be backed by sound meteorological data. They are NOT endorsed by any professional institution or STORM2K. For official information, please refer to products from the NHC and NWS.
Model Runs Cheat Sheet:
GFS (5:30 AM/PM, 11:30 AM/PM)
HWRF, GFDL, UKMET, NAVGEM (6:30-8:00 AM/PM, 12:30-2:00 AM/PM)
ECMWF (1:45 AM/PM)
TCVN is a weighted averaged
-
Category5Kaiju
- Category 5
- Posts: 4334
- Joined: Thu Dec 24, 2020 12:45 pm
- Location: Seattle and Phoenix
Re: 2021 Indicators: SST's / SAL / MSLP / Shear / Steering / Instability / Sat Images
I also love the example of 2007. Very cool MDR, during a La Nina, two Category 5 storms. 2013 had a warm MDR at around this time if I am not mistaken.
0 likes
Unless explicitly stated, all info in my posts is based on my own opinions and observations. Tropical storms and hurricanes can be extremely dangerous. Refer to an accredited weather research agency or meteorologist if you need to make serious decisions regarding an approaching storm.
-
NotSparta

- Professional-Met
- Posts: 1677
- Age: 24
- Joined: Fri Aug 18, 2017 8:24 am
- Location: Naples, FL
- Contact:
Re: 2021 Indicators: SST's / SAL / MSLP / Shear / Steering / Instability / Sat Images
There's a good paper here by Dr. Gray and Philip Klotzbach about what happened in 2013. One thing that signaled a major change was the SLPA pattern. During the winter it was similar to years with a strong THC, with very low pressure in the subtropics. Then, in spring, the pressure pattern totally flipped, suggesting a major THC weakening. This seemed to be the reason 2013 was so inactive.
Paper here: http://tropical.atmos.colostate.edu/Inc ... _short.pdf
Let's first look at 2013 data. For the springtime I have omitted June data for better comparison with 2021.
2013 January-March:
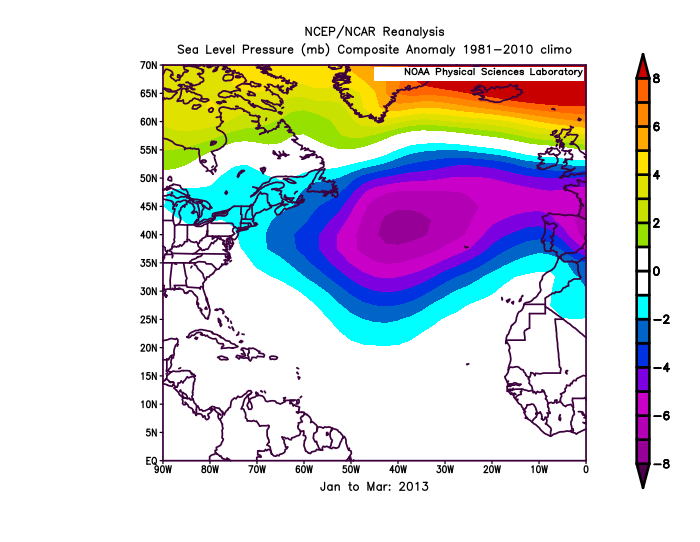
2013 April-May:
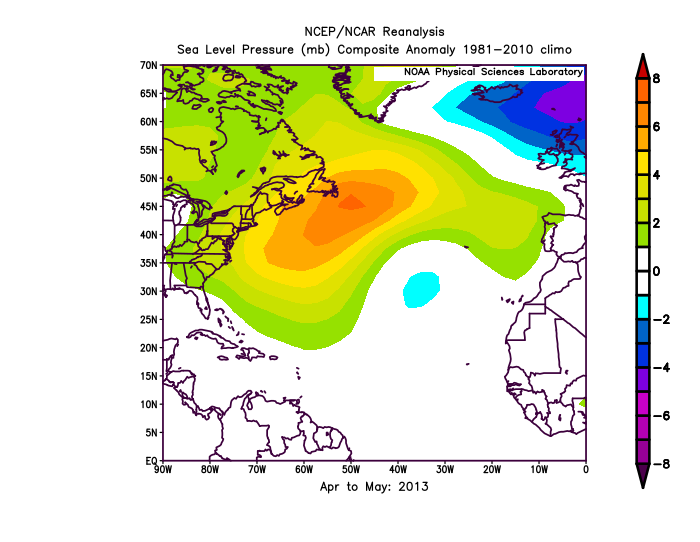
As you can see, there was a major pressure anomaly rise in the region, a sign of the THC weakening.
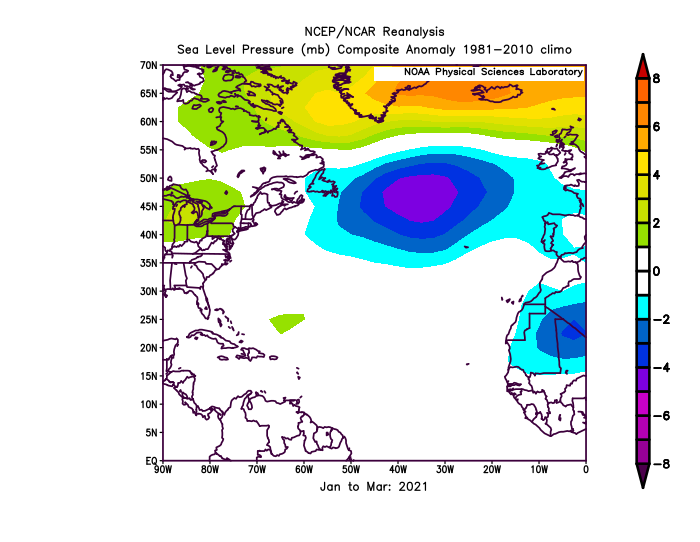
Now let's look at 2021.
2021 January-March:
2021 April-May:
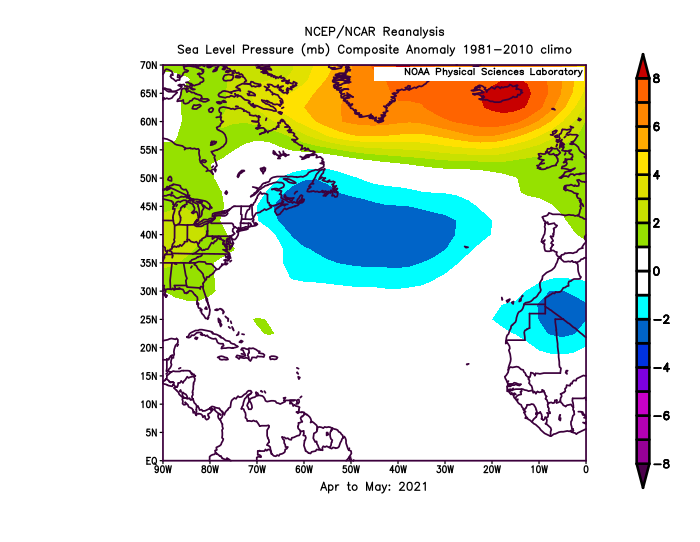
Not really as much of a big pressure pattern flip like 2013. By this metric, there was far less THC weakening than in 2013, and at the very least the atmospheric teleconnections aren't really kicking in (maybe at least yet). Appears to me 2013 isn't a great comparison right now. We'll see in ASO. More likely it's just 2013 being brought up like clockwork
Paper here: http://tropical.atmos.colostate.edu/Inc ... _short.pdf
Let's first look at 2013 data. For the springtime I have omitted June data for better comparison with 2021.
2013 January-March:
2013 April-May:
As you can see, there was a major pressure anomaly rise in the region, a sign of the THC weakening.
Now let's look at 2021.
2021 January-March:
2021 April-May:
Not really as much of a big pressure pattern flip like 2013. By this metric, there was far less THC weakening than in 2013, and at the very least the atmospheric teleconnections aren't really kicking in (maybe at least yet). Appears to me 2013 isn't a great comparison right now. We'll see in ASO. More likely it's just 2013 being brought up like clockwork
10 likes
This post was probably an opinion of mine, and in no way is official. Please refer to http://www.hurricanes.gov for official tropical analysis and advisories.
My website, with lots of tropical wx graphics, including satellite and recon: http://cyclonicwx.com
My website, with lots of tropical wx graphics, including satellite and recon: http://cyclonicwx.com
-
Category5Kaiju
- Category 5
- Posts: 4334
- Joined: Thu Dec 24, 2020 12:45 pm
- Location: Seattle and Phoenix
Re: 2021 Indicators: SST's / SAL / MSLP / Shear / Steering / Instability / Sat Images
NotSparta wrote:There's a good paper here by Dr. Gray and Philip Klotzbach about what happened in 2013. One thing that signaled a major change was the SLPA pattern. During the winter it was similar to years with a strong THC, with very low pressure in the subtropics. Then, in spring, the pressure pattern totally flipped, suggesting a major THC weakening. This seemed to be the reason 2013 was so inactive.
Paper here: http://tropical.atmos.colostate.edu/Inc ... _short.pdf
Let's first look at 2013 data. For the springtime I have omitted June data for better comparison with 2021.
2013 January-March:
https://uploads.disquscdn.com/images/e82bf3871236ba6ef0c7ef02d47536ee9c950bf0917fa38c60dbebaccc7b3f9a.png
2013 April-May:
https://uploads.disquscdn.com/images/06b87d6b7a81be0e8dd4d0abd82f952d979398c9c812446d48825884501d4296.png
As you can see, there was a major pressure anomaly rise in the region, a sign of the THC weakening.
Now let's look at 2021.
2021 January-March:
https://uploads.disquscdn.com/images/194cfff2662093e9367a6a5e51f1b27be283b92461f597c5a1da32656a4b49dd.png
2021 April-May:
https://uploads.disquscdn.com/images/a2881feea31421c2c3747676d1fb318d69b0953a5bb1c1b8a1340e657c617bc7.png
Not really as much of a big pressure pattern flip like 2013. By this metric, there was far less THC weakening than in 2013, and at the very least the atmospheric teleconnections aren't really kicking in (maybe at least yet). Appears to me 2013 isn't a great comparison right now. We'll see in ASO. More likely it's just 2013 being brought up like clockwork
Oh wow, thanks for the visuals of the pressure patterns; 2013 really did experience a total 180' with the sea level pressure in the spring. Doesn't look similar to what 2021 is experiencing at all so far
2 likes
Unless explicitly stated, all info in my posts is based on my own opinions and observations. Tropical storms and hurricanes can be extremely dangerous. Refer to an accredited weather research agency or meteorologist if you need to make serious decisions regarding an approaching storm.
-
NotSparta
- Professional-Met
- Posts: 1677
- Age: 24
- Joined: Fri Aug 18, 2017 8:24 am
- Location: Naples, FL
- Contact:
Re: 2021 Indicators: SST's / SAL / MSLP / Shear / Steering / Instability / Sat Images
Category5Kaiju wrote:NotSparta wrote:There's a good paper here by Dr. Gray and Philip Klotzbach about what happened in 2013. One thing that signaled a major change was the SLPA pattern. During the winter it was similar to years with a strong THC, with very low pressure in the subtropics. Then, in spring, the pressure pattern totally flipped, suggesting a major THC weakening. This seemed to be the reason 2013 was so inactive.
Paper here: http://tropical.atmos.colostate.edu/Inc ... _short.pdf
Let's first look at 2013 data. For the springtime I have omitted June data for better comparison with 2021.
2013 January-March:
https://uploads.disquscdn.com/images/e82bf3871236ba6ef0c7ef02d47536ee9c950bf0917fa38c60dbebaccc7b3f9a.png
2013 April-May:
https://uploads.disquscdn.com/images/06b87d6b7a81be0e8dd4d0abd82f952d979398c9c812446d48825884501d4296.png
As you can see, there was a major pressure anomaly rise in the region, a sign of the THC weakening.
Now let's look at 2021.
2021 January-March:
https://uploads.disquscdn.com/images/194cfff2662093e9367a6a5e51f1b27be283b92461f597c5a1da32656a4b49dd.png
2021 April-May:
https://uploads.disquscdn.com/images/a2881feea31421c2c3747676d1fb318d69b0953a5bb1c1b8a1340e657c617bc7.png
Not really as much of a big pressure pattern flip like 2013. By this metric, there was far less THC weakening than in 2013, and at the very least the atmospheric teleconnections aren't really kicking in (maybe at least yet). Appears to me 2013 isn't a great comparison right now. We'll see in ASO. More likely it's just 2013 being brought up like clockwork
Oh wow, thanks for the visuals of the pressure patterns; 2013 really did experience a total 180' with the sea level pressure in the spring. Doesn't look similar to what 2021 is experiencing at all so far
Thanks, decided to look into things since there were some comparisons flying around. And yeah, as usual, probably not a good idea to compare to a season like 2013 (or 2005, too)
2 likes
This post was probably an opinion of mine, and in no way is official. Please refer to http://www.hurricanes.gov for official tropical analysis and advisories.
My website, with lots of tropical wx graphics, including satellite and recon: http://cyclonicwx.com
My website, with lots of tropical wx graphics, including satellite and recon: http://cyclonicwx.com
-
Category5Kaiju
- Category 5
- Posts: 4334
- Joined: Thu Dec 24, 2020 12:45 pm
- Location: Seattle and Phoenix
Re: 2021 Indicators: SST's / SAL / MSLP / Shear / Steering / Instability / Sat Images
NotSparta wrote:Category5Kaiju wrote:NotSparta wrote:There's a good paper here by Dr. Gray and Philip Klotzbach about what happened in 2013. One thing that signaled a major change was the SLPA pattern. During the winter it was similar to years with a strong THC, with very low pressure in the subtropics. Then, in spring, the pressure pattern totally flipped, suggesting a major THC weakening. This seemed to be the reason 2013 was so inactive.
Paper here: http://tropical.atmos.colostate.edu/Inc ... _short.pdf
Let's first look at 2013 data. For the springtime I have omitted June data for better comparison with 2021.
2013 January-March:
https://uploads.disquscdn.com/images/e82bf3871236ba6ef0c7ef02d47536ee9c950bf0917fa38c60dbebaccc7b3f9a.png
2013 April-May:
https://uploads.disquscdn.com/images/06b87d6b7a81be0e8dd4d0abd82f952d979398c9c812446d48825884501d4296.png
As you can see, there was a major pressure anomaly rise in the region, a sign of the THC weakening.
Now let's look at 2021.
2021 January-March:
https://uploads.disquscdn.com/images/194cfff2662093e9367a6a5e51f1b27be283b92461f597c5a1da32656a4b49dd.png
2021 April-May:
https://uploads.disquscdn.com/images/a2881feea31421c2c3747676d1fb318d69b0953a5bb1c1b8a1340e657c617bc7.png
Not really as much of a big pressure pattern flip like 2013. By this metric, there was far less THC weakening than in 2013, and at the very least the atmospheric teleconnections aren't really kicking in (maybe at least yet). Appears to me 2013 isn't a great comparison right now. We'll see in ASO. More likely it's just 2013 being brought up like clockwork
Oh wow, thanks for the visuals of the pressure patterns; 2013 really did experience a total 180' with the sea level pressure in the spring. Doesn't look similar to what 2021 is experiencing at all so far
Thanks, decided to look into things since there were some comparisons flying around. And yeah, as usual, probably not a good idea to compare to a season like 2013 (or 2005, too)
Yeah, I personally think that comments predicting a particular season to be "2013 2.0" or "2005 2.0" or "another 'insert past hurricane season year here'" simply undermine the fact that no two hurricane seasons are carbon copies and that there will always be more differences than similarities in any two hurricane seasons when compared. Take 2020, for example. I've heard many comments about it being a "2005 2.0." However, did 2020 feature a Cat 5? No. Did 2020 feature a long track major MDR storm that 2005 lacked? Yes. Did 2020 have major hurricanes in July? No. Did 2020 feature two November majors unlike 2005? Yes. And so forth.
2 likes
Unless explicitly stated, all info in my posts is based on my own opinions and observations. Tropical storms and hurricanes can be extremely dangerous. Refer to an accredited weather research agency or meteorologist if you need to make serious decisions regarding an approaching storm.
-
Shell Mound
- Category 5
- Posts: 2432
- Age: 33
- Joined: Thu Sep 07, 2017 3:39 pm
- Location: St. Petersburg, FL → Scandinavia
Re: 2021 Indicators: SST's / SAL / MSLP / Shear / Steering / Instability / Sat Images
USTropics wrote:This has been ongoing for decades now, and there is a lot of debate within the meteorology community regarding the impacts a slowdown of the AMOC has on the Atlantic hurricane season. We saw a significant slowdown in 2009 and 2010 that brought unusually cooler anomalous temperatures to Europe (and created a significant hurricane season in 2010). This also occurred in 2004 and 2005. We typically see a peak slowdown in the months of January - March, and then a release before summer.
I strongly recommend listening to this podcast released last week with climate scientist Samantha Hallam if you want more details (her interview starts around 14 minutes in) -https://open.spotify.com/episode/73Lgx26XS0jxGilSEzZDgA?si=Hg1P8TqVQzeowiNTdQmFKw&dl_branch=1
How would a slower AMOC enhance the probability of an active season? I thought it would do the opposite by creating sinking air and/or stability over the MDR.
0 likes
CVW / MiamiensisWx / Shell Mound
The posts in this forum are NOT official forecasts and should not be used as such. They are just the opinion of the poster and may or may not be backed by sound meteorological data. They are NOT endorsed by any professional institution or STORM2K. For official information, please refer to products from the NHC and NWS.
-
Shell Mound
- Category 5
- Posts: 2432
- Age: 33
- Joined: Thu Sep 07, 2017 3:39 pm
- Location: St. Petersburg, FL → Scandinavia
Re: 2021 Indicators: SST's / SAL / MSLP / Shear / Steering / Instability / Sat Images
https://twitter.com/AndyHazelton/status/1403118797805002753
https://twitter.com/AndyHazelton/status/1403119144502009856
https://twitter.com/grogmanweather1/status/1403153830196432901
https://twitter.com/grogmanweather1/status/1403155172159807489
https://twitter.com/AnthonyMweather/status/1403077296152580096
https://twitter.com/AndyHazelton/status/1403119144502009856
https://twitter.com/grogmanweather1/status/1403153830196432901
https://twitter.com/grogmanweather1/status/1403155172159807489
https://twitter.com/AnthonyMweather/status/1403077296152580096
0 likes
CVW / MiamiensisWx / Shell Mound
The posts in this forum are NOT official forecasts and should not be used as such. They are just the opinion of the poster and may or may not be backed by sound meteorological data. They are NOT endorsed by any professional institution or STORM2K. For official information, please refer to products from the NHC and NWS.
-
USTropics
- Professional-Met
- Posts: 2739
- Joined: Sun Aug 12, 2007 3:45 am
- Location: Florida State University
Re: 2021 Indicators: SST's / SAL / MSLP / Shear / Steering / Instability / Sat Images
Shell Mound wrote:USTropics wrote:This has been ongoing for decades now, and there is a lot of debate within the meteorology community regarding the impacts a slowdown of the AMOC has on the Atlantic hurricane season. We saw a significant slowdown in 2009 and 2010 that brought unusually cooler anomalous temperatures to Europe (and created a significant hurricane season in 2010). This also occurred in 2004 and 2005. We typically see a peak slowdown in the months of January - March, and then a release before summer.
I strongly recommend listening to this podcast released last week with climate scientist Samantha Hallam if you want more details (her interview starts around 14 minutes in) -https://open.spotify.com/episode/73Lgx26XS0jxGilSEzZDgA?si=Hg1P8TqVQzeowiNTdQmFKw&dl_branch=1
How would a slower AMOC enhance the probability of an active season? I thought it would do the opposite by creating sinking air and/or stability over the MDR.
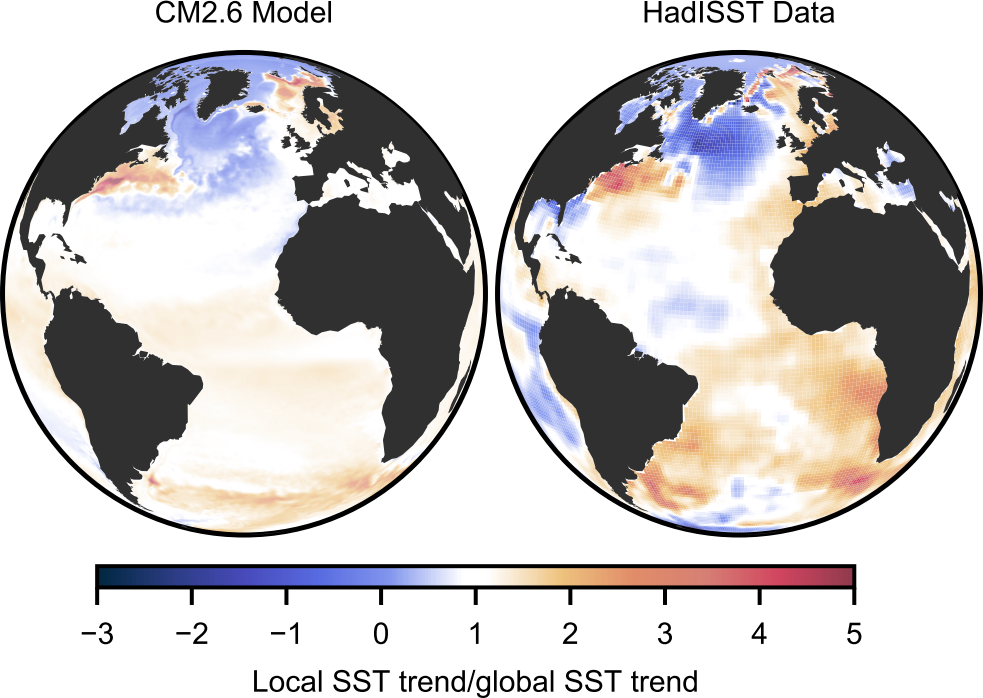
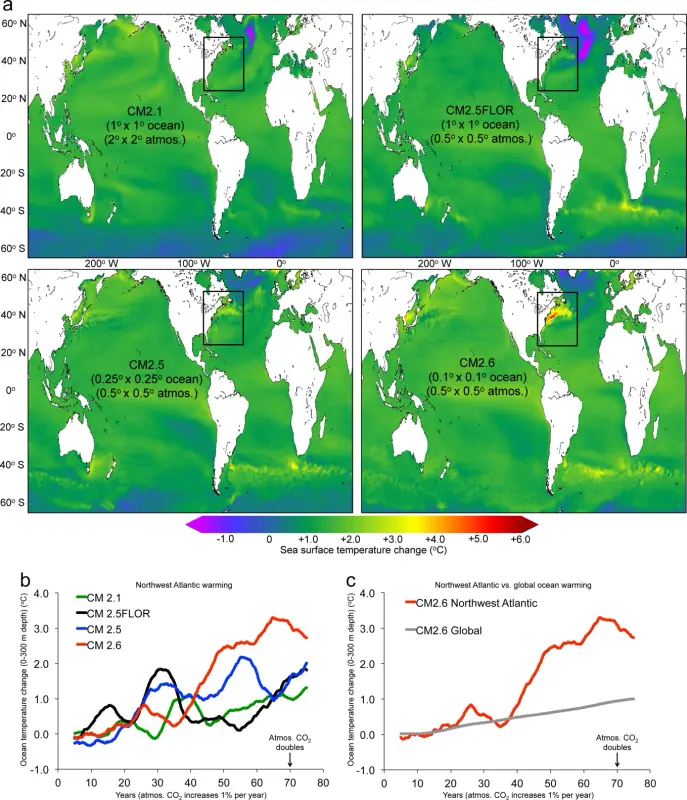
We have a long-term slowdown (that has been occurring over the past 2 decades) but we also have seasonal slowdowns that occur annually, I definitely want to differentiate those two. The decades long slowdown is likely tied to climate change, and the current computing power limitation for climate models creates some uncertainty on how this will impact the Atlantic hurricane season. The leading theory is the tropical MDR and subtropical regions would experience anomalous cooling, but we would see anomalous warming in the Caribbean/GOM/Florida/East coast.
When we have an abrupt and significant seasonal slowdown of the AMOC in the months of January-March (which typically correlates with a cold winter in Europe, particularly northwestern Europe where the AMOC increases local temperatures by 5-10C compared to the global average at this latitude), this creates a backup of warm waters in the tropics. You can read this article published in 2012 about the
specific data(https://agupubs.onlinelibrary.wiley.com ... 12GL052933), but highlighting some of the details the mean AMOC from April 2004 to March 2009 was 18.5 Sv; this reduced to 12.8 Sv (30% decline) from April 2009 to March 2010. The issue is again a lack of data though, we only had the capability to quantitatively analyze the slowdown of the AMOC starting in 2004, and we can only point to the 2009/2010 season to definitively state we witnessed a sudden seasonal slowdown of the AMOC.
Going back to your comment, the issue becomes if the AMOC abruptly slows down after the months of April/May, as this is when we see a ramp up of Greenland surface melt that dumps fresh waster into the North Atlantic:

(as a side note, you can find specific data for each year here - https://nsidc.org/greenland-today/green ... ive-chart/)
With the properties of water the warmer, dense, high salinity tropical waters being transported begin to intermingle with the cooler atmosphere and fresh water in this region and begin to sink, and this creates a feedback system where the water is transported back south through undercurrents (you can get a bit more information about the Atlantic currents here in my post last month - viewtopic.php?p=2903240#p2903240). When we have a slowdown in conjunction with an increase in the annual freshwater deposit in the NA, this begins to create issues with the Atlantic thermohaline circulation. This can then impact specific atmospheric circulations, such as the Hadley and Ferrell cells.
7 likes
-
Category5Kaiju
- Category 5
- Posts: 4334
- Joined: Thu Dec 24, 2020 12:45 pm
- Location: Seattle and Phoenix
Re: 2021 Indicators: SST's / SAL / MSLP / Shear / Steering / Instability / Sat Images
So this is a question purely out of curiosity and I don't know a whole lot about it, so any input would be greatly appreciated. For a particular season, is there a reason why people tend to look at MDR sst anomalies to determine whether the upcoming season would be active or not? Because from what I can remember in 2018 we had Florence, Helene, and Isaac going on in a somewhat cool to average MDR, and especially if you have an active WAM, couldn't that theoretically mean more storms would develop closer to land (and theoretically not impact overall NS or MH amounts?)
3 likes
Unless explicitly stated, all info in my posts is based on my own opinions and observations. Tropical storms and hurricanes can be extremely dangerous. Refer to an accredited weather research agency or meteorologist if you need to make serious decisions regarding an approaching storm.
-
USTropics
- Professional-Met
- Posts: 2739
- Joined: Sun Aug 12, 2007 3:45 am
- Location: Florida State University
Re: 2021 Indicators: SST's / SAL / MSLP / Shear / Steering / Instability / Sat Images
Category5Kaiju wrote:So this is a question purely out of curiosity and I don't know a whole lot about it, so any input would be greatly appreciated. For a particular season, is there a reason why people tend to look at MDR sst anomalies to determine whether the upcoming season would be active or not? Because from what I can remember in 2018 we had Florence, Helene, and Isaac going on in a somewhat cool to average MDR, and especially if you have an active WAM, couldn't that theoretically mean more storms would develop closer to land (and theoretically not impact overall NS or MH amounts?)
MDR SSTAs, while just being one factor, would really have more of an impact on ACE values. You're correct that what doesn't develop (in reference to AEWs/tropical wave seeds) in the eastern Atlantic/MDR would continue heading westward and perhaps find more suitable conditions in the western Atlantic/Caribbean/GOM. In fact, these tropical waves already act as seeds for the EPAC until conditions become more favorable in the Atlantic:

3 likes
-
Shell Mound
- Category 5
- Posts: 2432
- Age: 33
- Joined: Thu Sep 07, 2017 3:39 pm
- Location: St. Petersburg, FL → Scandinavia
Re: 2021 Indicators: SST's / SAL / MSLP / Shear / Steering / Instability / Sat Images
USTropics wrote:Shell Mound wrote:USTropics wrote:This has been ongoing for decades now, and there is a lot of debate within the meteorology community regarding the impacts a slowdown of the AMOC has on the Atlantic hurricane season. We saw a significant slowdown in 2009 and 2010 that brought unusually cooler anomalous temperatures to Europe (and created a significant hurricane season in 2010). This also occurred in 2004 and 2005. We typically see a peak slowdown in the months of January - March, and then a release before summer.
I strongly recommend listening to this podcast released last week with climate scientist Samantha Hallam if you want more details (her interview starts around 14 minutes in) -https://open.spotify.com/episode/73Lgx26XS0jxGilSEzZDgA?si=Hg1P8TqVQzeowiNTdQmFKw&dl_branch=1
How would a slower AMOC enhance the probability of an active season? I thought it would do the opposite by creating sinking air and/or stability over the MDR.
We have a long-term slowdown (that has been occurring over the past 2 decades) but we also have seasonal slowdowns that occur annually, I definitely want to differentiate those two. The decades long slowdown is likely tied to climate change, and the current computing power limitation for climate models creates some uncertainty on how this will impact the Atlantic hurricane season. The leading theory is the tropical MDR and subtropical regions would experience anomalous cooling, but we would see anomalous warming in the Caribbean/GOM/Florida/East coast. ...
Going back to your comment, the issue becomes if the AMOC abruptly slows down after the months of April/May, as this is when we see a ramp up of Greenland surface melt that dumps fresh waster into the North Atlantic:
https://i.imgur.com/u221bSn.png
(as a side note, you can find specific data for each year here - https://nsidc.org/greenland-today/green ... ive-chart/)
With the properties of water the warmer, dense, high salinity tropical waters being transported begin to intermingle with the cooler atmosphere and fresh water in this region and begin to sink, and this creates a feedback system where the water is transported back south through undercurrents (you can get a bit more information about the Atlantic currents here in my post last month - viewtopic.php?p=2903240#p2903240). When we have a slowdown in conjunction with an increase in the annual freshwater deposit in the NA, this begins to create issues with the Atlantic thermohaline circulation. This can then impact specific atmospheric circulations, such as the Hadley and Ferrell cells.
Sources: A, B
Based on this, it appears that climate change could certainly be causing a downturn in the AMO via changes in the AMOC over time. Both long-term observations and projected modelling suggest more of a -AMO signature evolving over time and the Atlantic Niño (warm Gulf of Guinea) becoming more prominent as well. Therefore, a warming climate may actually correlate with weaker Atlantic hurricane seasons overall and a reduced risk of landfalls due to overall decrease in TC activity. I personally never believed that climate change was actually increasing the intensity of the strongest tropical cyclones. If anything, changes in the atmospheric circulation resulting in greater stability over the tropical Atlantic may decrease intensity as well as frequency of tropical cyclones. The ongoing slowdown of the AMOC over the past several weeks could certainly present a significant limitation on the upcoming peak of the season in regard to potential ACE.
0 likes
CVW / MiamiensisWx / Shell Mound
The posts in this forum are NOT official forecasts and should not be used as such. They are just the opinion of the poster and may or may not be backed by sound meteorological data. They are NOT endorsed by any professional institution or STORM2K. For official information, please refer to products from the NHC and NWS.

Re: 2021 Indicators: SST's / SAL / MSLP / Shear / Steering / Instability / Sat Images
If anything didn't the 2020 season show us ACE is a bit of a silly metric to put all your eggs into? The cooling of the MDR this early seems irrelevant given how most landfalling impactful storms don't ramp up until closer to the coast.
3 likes
Andrew (1992), Irene (1999), Frances (2004), Katrina (2005), Wilma (2005), Fay (2008), Irma (2017), Eta (2020), Ian (2022)

Re: 2021 Indicators: SST's / SAL / MSLP / Shear / Steering / Instability / Sat Images
TCHP is not on a 2020/2017 level in terms of extent, but it is a shade above 2019 and leagues above 2018.

7 likes
Kendall -> SLO -> PBC
Memorable Storms: Katrina (for its Florida landfall...) Wilma Matthew Irma
Memorable Storms: Katrina (for its Florida landfall...) Wilma Matthew Irma
Who is online
Users browsing this forum: AnnularCane and 171 guests