


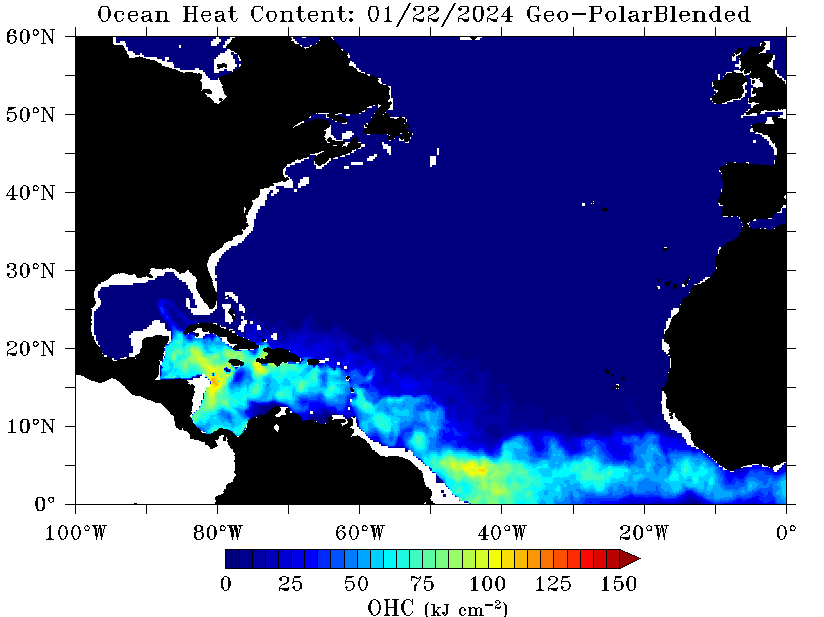
Ubuntwo wrote:TCHP is not on a 2020/2017 level in terms of extent, but it is a shade above 2019 and leagues above 2018.
https://cdn.discordapp.com/attachments/289981599448039425/852950315644485682/TCHP.png
What catches my eye is that loop current in the Gulf, like if I recall last year had a thing where that specific patch of the Gulf had below average UOHC; this graphic seems to suggest the opposite at least for this year. Additionally, maybe you guys know this website or not, but at least personally I've found it quite interesting. It shows how strong a storm in a certain part of the Atlantic could potentially get given ssts and UOHC, and it updates daily. In fact I remember referring off of this map last year when Zeta happened, and the graphic showed that a max hurricane intensity in the Louisiana coast where Zeta ultimately hit was a low end Cat 3/high end Cat 2.
http://wxmaps.org/pix/hurpot


