
OISST analysis:

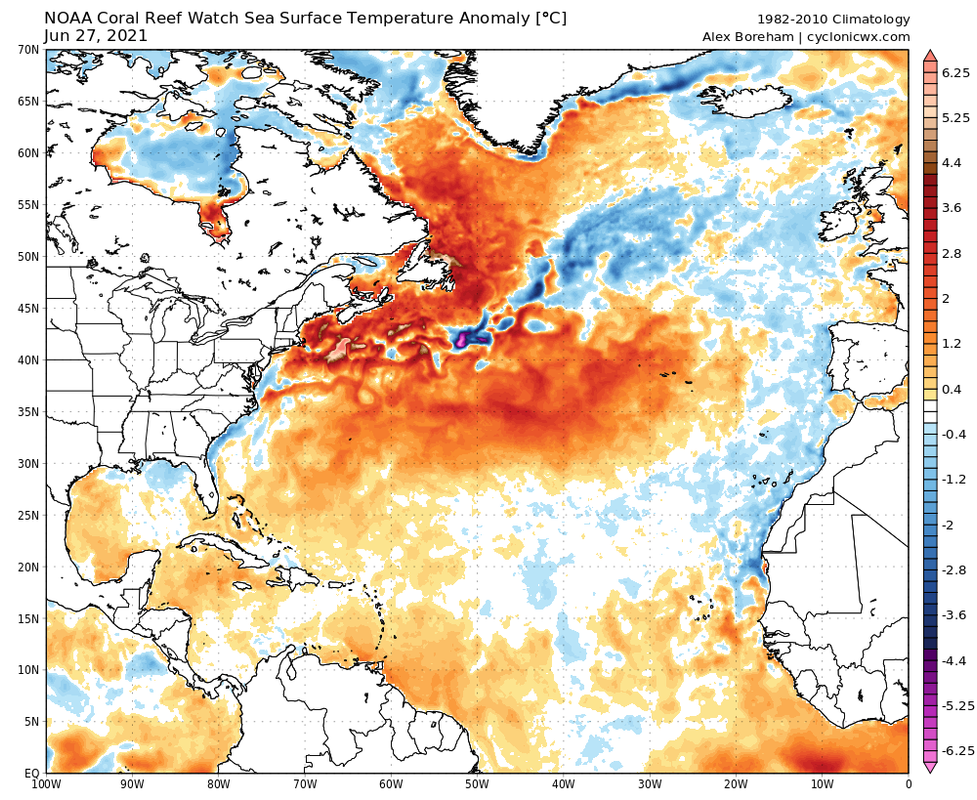
CRW analysis:

Reynolds analysis:

Where is the 'below average' narrative coming from? Are people still using CDAS?
Moderator: S2k Moderators

Ubuntwo wrote:Sea surface temperatures remain at or above average, with some warming in the MDR and slight cooling in the Caribbean.
OISST analysis:
https://cdn.discordapp.com/attachments/289981599448039425/858436587528519680/oisst_anom_1d_tropatl_2021062400.png
CRW analysis:
https://cdn.discordapp.com/attachments/289981599448039425/858436922417479720/ct5km_ssta_v3.png
Reynolds analysis:
https://media.discordapp.net/attachments/289981599448039425/858437025287372840/atl_anom.png?width=725&height=668
Where is the 'below average' narrative coming from? Are people still using CDAS?


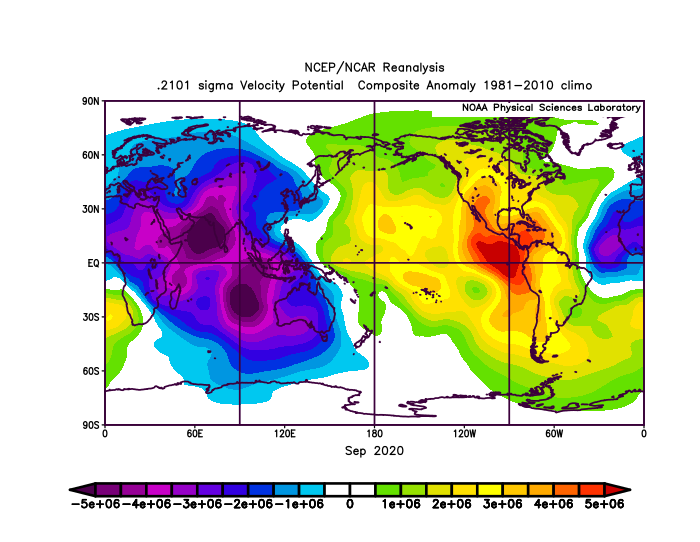
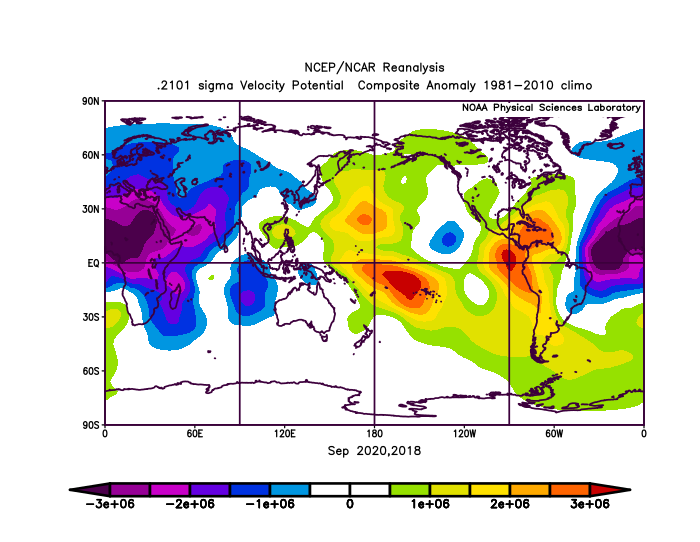
AlphaToOmega wrote:In my opinion, people are too fixated on SSTs. They are important, but they are only one piece of the story. What matters is velocity potential; higher SSTs create areas of -VP, and -VP creates wetter air and lowers wind shear. VP is a general indicator of favorability. From what I have gathered (correct me if I am wrong), rising air over Africa means a more active Atlantic, and rising air over the Americas means a more active Pacific.
2021 May VP anomalies:
https://psl.noaa.gov/cgi-bin/data/composites/comp.pl?var=Velocity+Potential&level=.2101+sigma&mon1=4&mon2=4&iy=2021&iy=&iy=&iy=&iy=&iy=&iy=&iy=&iy=&iy=&iy=&iy=&iy=&iy=&iy=&iy=&iy=&iy=&iy=&iy=&ipos%5B1%5D=&ipos%5B2%5D=&ineg%5B1%5D=&ineg%5B2%5D=&timefile0=&tstype=0&timefile1=&value=&typeval=1&compval=1&lag=0&labelcolor=Color&labelshaded=Shaded&type=2&scale=100&contourlabel=1&switch=0&cint=&lowr=&highr=&proj=ALL&xlat1=0&xlat2=90&xlon1=0&xlon2=360&custproj=Northern+Hemisphere+Polar+Stereographic&level1=1000mb&level2=10mb&Submit=Create+Plot
2020 May VP anomalies:
https://psl.noaa.gov/cgi-bin/data/composites/comp.pl?var=Velocity+Potential&level=.2101+sigma&mon1=4&mon2=4&iy=2020&iy=&iy=&iy=&iy=&iy=&iy=&iy=&iy=&iy=&iy=&iy=&iy=&iy=&iy=&iy=&iy=&iy=&iy=&iy=&ipos%5B1%5D=&ipos%5B2%5D=&ineg%5B1%5D=&ineg%5B2%5D=&timefile0=&tstype=0&timefile1=&value=&typeval=1&compval=1&lag=0&labelcolor=Color&labelshaded=Shaded&type=2&scale=100&contourlabel=1&switch=0&cint=&lowr=&highr=&proj=ALL&xlat1=0&xlat2=90&xlon1=0&xlon2=360&custproj=Northern+Hemisphere+Polar+Stereographic&level1=1000mb&level2=10mb&Submit=Create+Plot
2019 May VP anomalies:
https://psl.noaa.gov/cgi-bin/data/composites/comp.pl?var=Velocity+Potential&level=.2101+sigma&mon1=4&mon2=4&iy=2019&iy=&iy=&iy=&iy=&iy=&iy=&iy=&iy=&iy=&iy=&iy=&iy=&iy=&iy=&iy=&iy=&iy=&iy=&iy=&ipos%5B1%5D=&ipos%5B2%5D=&ineg%5B1%5D=&ineg%5B2%5D=&timefile0=&tstype=0&timefile1=&value=&typeval=1&compval=1&lag=0&labelcolor=Color&labelshaded=Shaded&type=2&scale=100&contourlabel=1&switch=0&cint=&lowr=&highr=&proj=ALL&xlat1=0&xlat2=90&xlon1=0&xlon2=360&custproj=Northern+Hemisphere+Polar+Stereographic&level1=1000mb&level2=10mb&Submit=Create+Plot
2018 May VP anomalies:
https://psl.noaa.gov/cgi-bin/data/composites/comp.pl?var=Velocity+Potential&level=.2101+sigma&mon1=4&mon2=4&iy=2018&iy=&iy=&iy=&iy=&iy=&iy=&iy=&iy=&iy=&iy=&iy=&iy=&iy=&iy=&iy=&iy=&iy=&iy=&iy=&ipos%5B1%5D=&ipos%5B2%5D=&ineg%5B1%5D=&ineg%5B2%5D=&timefile0=&tstype=0&timefile1=&value=&typeval=1&compval=1&lag=0&labelcolor=Color&labelshaded=Shaded&type=2&scale=100&contourlabel=1&switch=0&cint=&lowr=&highr=&proj=ALL&xlat1=0&xlat2=90&xlon1=0&xlon2=360&custproj=Northern+Hemisphere+Polar+Stereographic&level1=1000mb&level2=10mb&Submit=Create+Plot
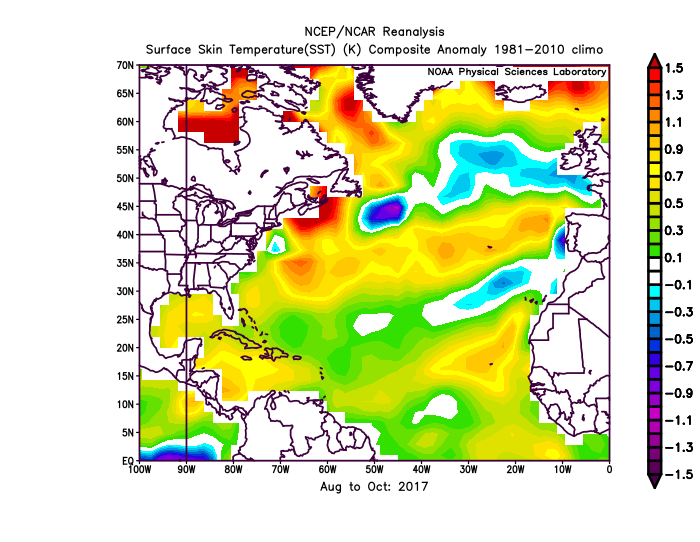
2017 May VP anomalies:
https://psl.noaa.gov/cgi-bin/data/composites/comp.pl?var=Velocity+Potential&level=.2101+sigma&mon1=4&mon2=4&iy=2017&iy=&iy=&iy=&iy=&iy=&iy=&iy=&iy=&iy=&iy=&iy=&iy=&iy=&iy=&iy=&iy=&iy=&iy=&iy=&ipos%5B1%5D=&ipos%5B2%5D=&ineg%5B1%5D=&ineg%5B2%5D=&timefile0=&tstype=0&timefile1=&value=&typeval=1&compval=1&lag=0&labelcolor=Color&labelshaded=Shaded&type=2&scale=100&contourlabel=1&switch=0&cint=&lowr=&highr=&proj=ALL&xlat1=0&xlat2=90&xlon1=0&xlon2=360&custproj=Northern+Hemisphere+Polar+Stereographic&level1=1000mb&level2=10mb&Submit=Create+Plot
2016 May VP anomalies:
https://psl.noaa.gov/cgi-bin/data/composites/comp.pl?var=Velocity+Potential&level=.2101+sigma&mon1=4&mon2=4&iy=2016&iy=&iy=&iy=&iy=&iy=&iy=&iy=&iy=&iy=&iy=&iy=&iy=&iy=&iy=&iy=&iy=&iy=&iy=&iy=&ipos%5B1%5D=&ipos%5B2%5D=&ineg%5B1%5D=&ineg%5B2%5D=&timefile0=&tstype=0&timefile1=&value=&typeval=1&compval=1&lag=0&labelcolor=Color&labelshaded=Shaded&type=2&scale=100&contourlabel=1&switch=0&cint=&lowr=&highr=&proj=ALL&xlat1=0&xlat2=90&xlon1=0&xlon2=360&custproj=Northern+Hemisphere+Polar+Stereographic&level1=1000mb&level2=10mb&Submit=Create+Plot
From the looks of it, 2021 has the most favorable May VP pattern. Only 2020 and 2018 could really compare to 2021. These are only for May, and things could easily change; however, it seems interesting that 2021 seems to have a more favorable pattern than 2020.
Ubuntwo wrote:Sea surface temperatures remain at or above average, with some warming in the MDR and slight cooling in the Caribbean.
OISST analysis:
https://cdn.discordapp.com/attachments/289981599448039425/858436587528519680/oisst_anom_1d_tropatl_2021062400.png
CRW analysis:
https://cdn.discordapp.com/attachments/289981599448039425/858436922417479720/ct5km_ssta_v3.png
Reynolds analysis:
https://media.discordapp.net/attachments/289981599448039425/858437025287372840/atl_anom.png?width=725&height=668
Where is the 'below average' narrative coming from? Are people still using CDAS?
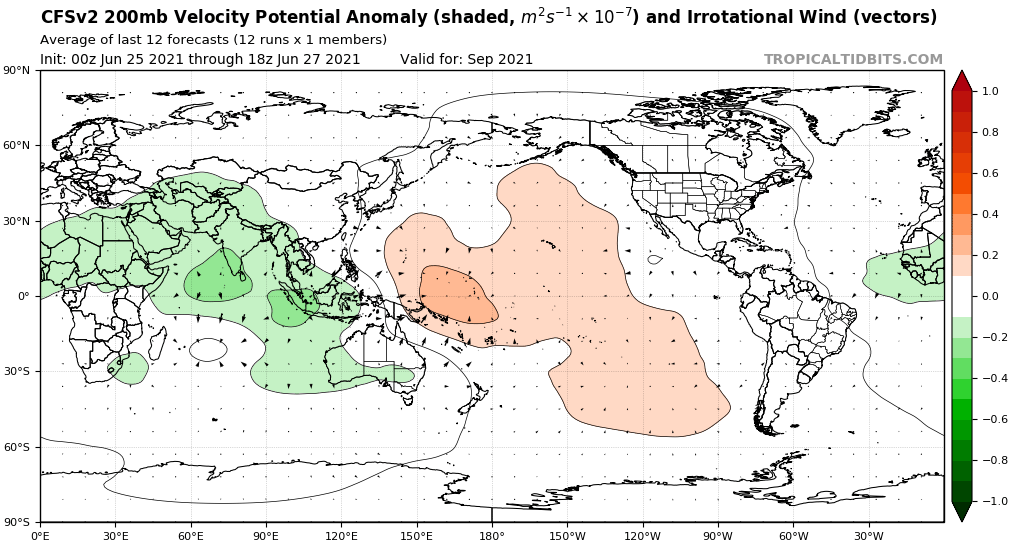
AlphaToOmega wrote:The Atlantic is expected to be ripe for tropical development until July 25. After July 25, sinking air as a result of a suppressed MJO phase is expected to be present throughout Africa, which should be a handicap for the strong WAM. It is also important to note that sinking air does not exclude the possibility of subtropical development.
[url]https://i.postimg.cc/qBZWFQTb/cfs-avg-chi200-Mean-global-fh168-1008.gif [/url]
A surge of activity in early and mid July is possible given this. If this verified, this might be the first season in a while without people saying "season cancelled".

aspen wrote:AlphaToOmega wrote:The Atlantic is expected to be ripe for tropical development until July 25. After July 25, sinking air as a result of a suppressed MJO phase is expected to be present throughout Africa, which should be a handicap for the strong WAM. It is also important to note that sinking air does not exclude the possibility of subtropical development.
[url]https://i.postimg.cc/qBZWFQTb/cfs-avg-chi200-Mean-global-fh168-1008.gif [/url]
A surge of activity in early and mid July is possible given this. If this verified, this might be the first season in a while without people saying "season cancelled".
That’s the complete opposite of the Euro velocity potential, which shows increased rising motion over Africa starting in late July after the suppressive MJO phase in the Atlantic dissipates.
tolakram wrote:aspen wrote:AlphaToOmega wrote:The Atlantic is expected to be ripe for tropical development until July 25. After July 25, sinking air as a result of a suppressed MJO phase is expected to be present throughout Africa, which should be a handicap for the strong WAM. It is also important to note that sinking air does not exclude the possibility of subtropical development.
[url]https://i.postimg.cc/qBZWFQTb/cfs-avg-chi200-Mean-global-fh168-1008.gif [/url]
A surge of activity in early and mid July is possible given this. If this verified, this might be the first season in a while without people saying "season cancelled".
That’s the complete opposite of the Euro velocity potential, which shows increased rising motion over Africa starting in late July after the suppressive MJO phase in the Atlantic dissipates.
Listening to Bastardi's Saturday Summary on Weatherbell. It's free, though you have to put up with his ramblings which can be quite expensive.Euro has been doing quite badly with MJO forecasts.
Weather Dude wrote:AlphaToOmega wrote:The Atlantic is expected to be ripe for tropical development until July 25. After July 25, sinking air as a result of a suppressed MJO phase is expected to be present throughout Africa, which should be a handicap for the strong WAM. It is also important to note that sinking air does not exclude the possibility of subtropical development.
[url]https://i.postimg.cc/qBZWFQTb/cfs-avg-chi200-Mean-global-fh168-1008.gif [/url]
A surge of activity in early and mid July is possible given this. If this verified, this might be the first season in a while without people saying "season cancelled".
They would just season cancel in August instead

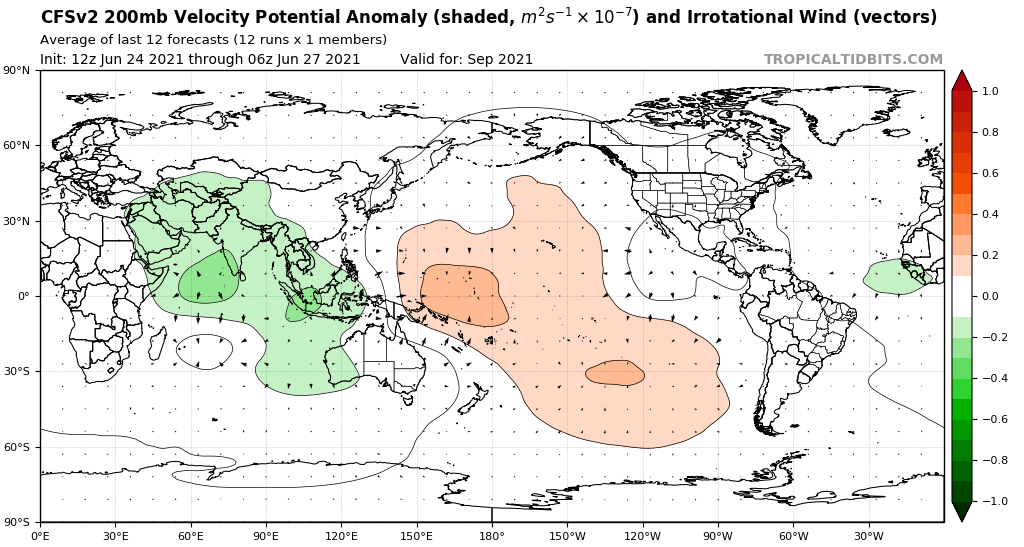
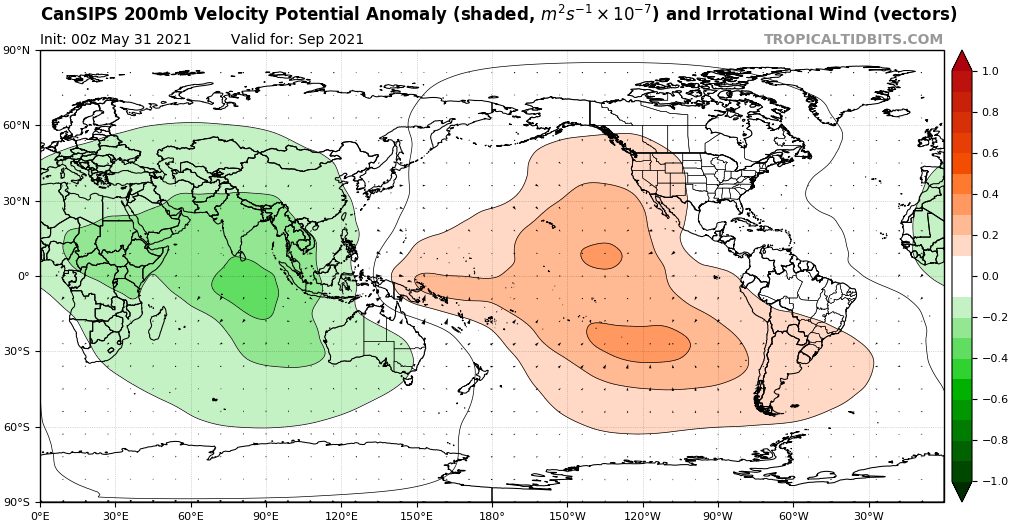
AlphaToOmega wrote:CanSIPS:
[url]https://i.postimg.cc/d0dj2bPC/cansips-chi200-global-4.png [/url]
CFSv2:
[url]https://i.postimg.cc/h40M3RJb/cfs-mon-01-chi200-global-3.png [/url]
The CanSIPS is more bullish than the CFSv2, but both generally indicate -VP anomalies over Africa and +VP anomalies over the Pacific and the Americas. Should either of these verify, the 2021 Atlantic Hurricane Season will be above-average (CFSv2) or possibly hyperactive (CanSIPS).

SconnieCane wrote:I think someone posted in one of the storm threads that if two of the current three active cyclones/AOIs in the North Atlantic get named, we'll beat last year for the earliest 5th named storm. Granted we can argue about whether naming criteria have changed and things are getting named now that wouldn't have 20-30 years ago (a similar debate is to be had about tornado ratings on the F/EF-scales), making comparing recent seasonal activity with historical ones not as clear-cut as we might like. That said, the fact that there is even the possibility of challenging 2020's formation records the very next season is not good.
aspen wrote:SconnieCane wrote:I think someone posted in one of the storm threads that if two of the current three active cyclones/AOIs in the North Atlantic get named, we'll beat last year for the earliest 5th named storm. Granted we can argue about whether naming criteria have changed and things are getting named now that wouldn't have 20-30 years ago (a similar debate is to be had about tornado ratings on the F/EF-scales), making comparing recent seasonal activity with historical ones not as clear-cut as we might like. That said, the fact that there is even the possibility of challenging 2020's formation records the very next season is not good.
Now that 96L became Danny, there’s a chance of both the earliest 5th AND 6th named storm records from last year falling, if 95L and the wave behind it develop like the HWRF really wants them to.
Elsa and Fred, back to back MDR tropical storms (or maybe weak hurricanes) in the first week of July….talk about an ominous sign for peak season.
Beef Stew wrote:While the formation of frequent early season TC’s (especially in the subtropics) isn’t on its own indicative of a strong ASO, it seems to be that the background state of 2021- similar to 2020- is proving to be more conductive for genesis than most. We have Danny on June 28th- nearly two months ahead of Dorian’s formation in 2019, a season which still managed to produce 18 named storms. With an active wave train already presenting itself, and a strong WAM being forecast, the potential for going deep into the name list is certainly presenting itself.
Users browsing this forum: StormPyrate and 206 guests


