For those more interested in the Atlantic equatorial mode (or Atlantic Nino), I've broken down the four main varieties (early-termination, persistent, early-onset, late-onset; there are 4 mixed-signals as well but for brevity sake will not include those) with descriptions/observations and various anomaly composites. The anomaly images include SSTAs, precipitation rates, 500mb heights, mid-level relative humidity, zonal 10m winds, meridional 10m winds, and omega 200mb velocity potential. This is broken into seasonal outlooks: (1) December, January, February (DJF); (2) March, April, May (MAM); (3) June, July, August (JJA); and (4) September, October, November (SON). First, here is a description/observations of each of the four major types of Atlantic Nino:
Early terminationYears: 1974, 1991, and 1996
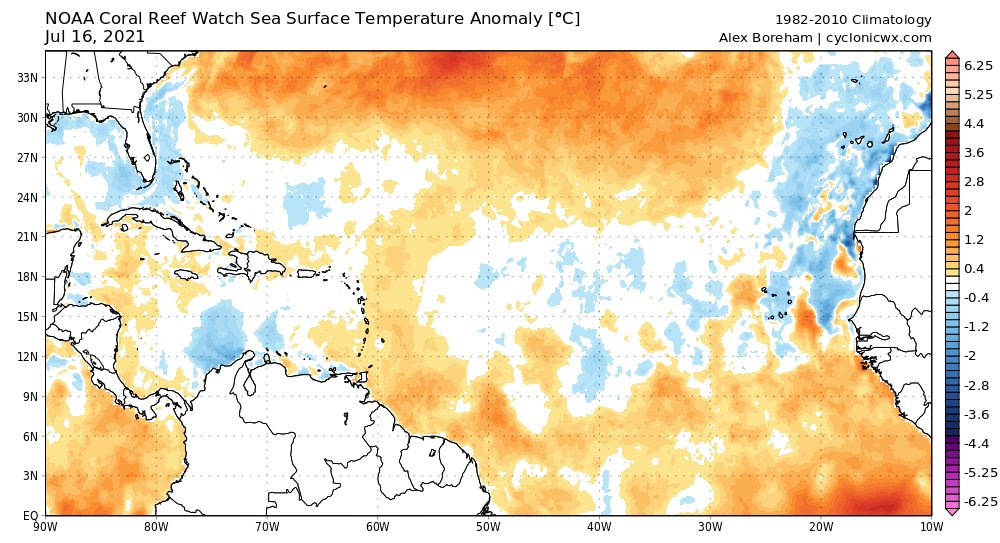
SSTA observations: Rapid and complete termination of Atlantic Nino and warm equatorial Atlantic SSTAs shortly after August. From December-May, SSTAs in the tropical North Atlantic (TNA) are typically cooler and SSTAs in the tropical South Atlantic (TSA) are typically warmer.
Precipitation observations: Precipitation over West Africa/sub-Sahel region (0-10N latitude) persists only through July-August. Reduced precipitation over northeastern South America from April-May.
Mode observations: -AMM develops in DJF and persists through MAM. Cold SSTAs in the equatorial Pacific along with La Nina conditions are exhibited in boreal winter.
Wind observations: Positive northeasterly wind anomalies in TNA and positive northwesterly wind anomalies in TSA during MAM.
PersistentYears: 1963, 1973, 1984, 1987, 2010, 2016, and 2019
SSTA observations: Strong SSTAs observed in the Atlantic Nino area and warm equatorial Atlantic SSTAs that continue through the end of the year.
Precipitation observations: Precipitation is enhanced over northeastern South America September-December but exhibits reduced rainfall in this region from January-May.
Mode observations: Strong Pacific El Nino events during the preceding boreal winter are typical.
Wind observations: Weak trade wind anomalies in both hemispheres from December-May. Increased southwesterly wind anomalies located directly off the west coast of Africa reduces coastal upwelling (reinforcing Atlantic Nino).
Early onsetYears: 1988, 1995, 1998
SSTA observations: Gradual development of equatorial warm SSTAs starting in January but begin to dissipate as early as March. Southwest Africa develops warm SSTAs in DJF. Cooler SSTAs are common in TNA from December-May. Positive SSTAs are confined to the eastern equatorial Atlantic region.
Precipitation observations: Increased precipitation is typically not observed over West Africa/sub-Sahel region before July, and especially between the months of January-April. West Africa/sub-Sahel region exhibits increased precipitation anomalies between the months of July-August. South America experiences enhanced precipitation from April-May.
Mode observations: Strong Pacific El Nino events during the preceding boreal winter are typical.
Wind observations: Persistent interhemispheric wind anomalies from December-May.
Late onsetYears: 1949, 1951, 1968, 1981, 1993, and 2018
SSTA observations: A sudden and late development of warm equatorial SSTAs that begin in May and peak in June. Warm SSTAs persist through much of boreal summer in the Atlantic Nino and equatorial Atlantic region.
Precipitation observations: Enhanced precipitation rates are observed over West Africa and the sub-Sahel region from July-October. Neutral precipitation rates over northeastern South America are observed from July-October. Reduced rainfall over the Sahelian region (10-20N latitude) is reduced during June-September (i.e., a weakened West African monsoon during boreal summer).
Wind observations: Neutral wind anomalies are typical from December-May.
Anomaly composites
SSTAs Precipitation Rates
 500mb Heights
 Mid-level RH
 Zonal 10m Winds
  meridional 10m winds
 Omega 200mb Velocity Potential


