The posts in this forum are NOT official forecasts and should not be used as such. They are just the opinion of the poster and may or may not be backed by sound meteorological data. They are NOT endorsed by any professional institution or STORM2K. For official information, please refer to products from the National Hurricane Center and National Weather Service.
Shell Mound wrote:If one looks at old radar images of Audrey, Carla, Camille, Celia, and Eloise, among others, one sees that, even with crude techniques in place then vs. today’s technology, those storms had much more impressive radar presentations at landfall vs. most recent MH impacts on the CONUS. Since the 1990s only Andrew, Charley, and Michael really compare to many of these old storms in terms of radar-based presentation.
This is clearly not true, at all. Can you please cite specific sources to back this up? These are also three of the most intense landfalls we've had (Laura too) in recent years and their appearance on radar wasn't degraded.
4 likes
Andrew (1992), Irene (1999), Frances (2004), Katrina (2005), Wilma (2005), Fay (2008), Irma (2017), Eta (2020), Ian (2022)
Ubuntwo wrote:There is no lack of pre-doppler radar snapshots with ground clutter, weak rainbands, and other low-reflectivity phenomena. A convectively weak eyewall would be depicted pretty much the same as an intense one. We have the resolution and range in reflectivity to make these distinctions now, early radar did not. I'm sure systems like Isaias and Hanna would look quite similar to stronger ones like Laura/Audrey.
Assuming attenuation, you extrapolated that Audrey had a "solidly closed inner eyewall". I could just as easily make handwavey arguments, supposing that dry air undercut the storm at the mid-levels with some disruption from an eyewall replacement cycle, leaving behind only the remnant upper-level echoes, resulting in an open appearance at landfall, with only a more coherent structure revealed only when the Alexandria radar activated and could see the weaker, lower-level returns inland with ground friction allowing for greater moisture convergence. ... Even if we were to imagine Audrey having a complete radar eyewall, assuming that it suddenly means that Audrey's inner eyewall is suddenly as strong if not stronger than Laura's seems like quite a leap in judgement. I mean, it could be true, but I don't think we're going to convince anyone using these low-resolution radarscope images with large coverage gaps. It's an even larger leap in judgement to use that sort of logic to make the broader claim that the strongest storms nowadays are just collectively weaker.
At 0:29 one can clearly see a “moat” surrounding the inner eye of Carla. However, at 0:31, the “moat” seems to melt back into the surrounding convection as Carla nears. This does not appear to be solely related to an optical illusion, because a few seconds later one can see convection rotating in the moat around the inner eyewall. So Carla’s inner eyewall was apparently connected to the surrounding convection, with only a slight decrease in the intensity of precipitation between bands, but far from a true “moat,” as intense convective activity was very closely spaced, with only very narrow “breaks,” more properly slight “lulls,” between peak precipitation cores. As mentioned previously, I suspect that attenuation at greater distances was more common in pre-Doppler radar, which sometimes failed to detect all but the strongest convection, primarily at greater distances.
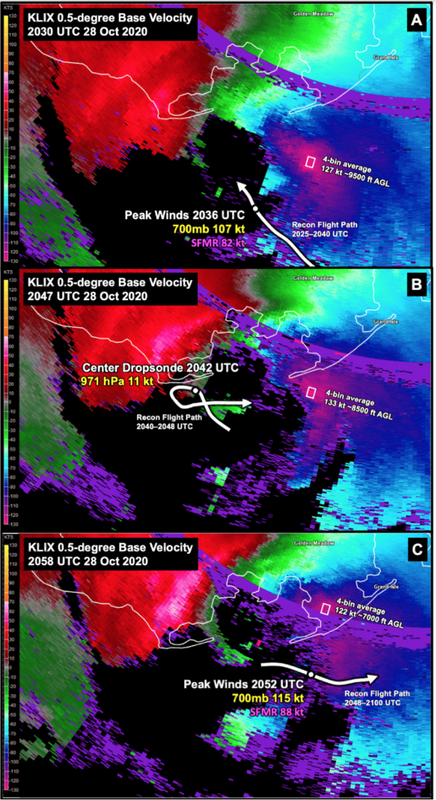
Regarding Audrey, the following radar-based image from Alexandria, LA, at 19Z on 27 June 1957—almost five hours after landfall—suggests a symmetric, closed, and rather intense inner eyewall. Moreover, the apparent “opening” on the western side is likely an illusion created by attenuation, as one can see convection to the immediate south and north, in the “moat” surrounding the inner eyewall. This also strongly suggests that the apparent “intrusion” of dry air during landfall approximately five hours earlier was an illusion, as imagery both prior to and after landfall suggests that little or no dry-air intrusion was occurring. As with Carla, I suspect that Audrey was featuring much more intense, closely spaced convective bands than we have seen in the most intense storms of recent years, suggesting that the largest and most intense storms of the pre-Doppler past were indeed more vigorous than today’s:
Ubuntwo wrote:The inland reach of surge is not indicative of intensity. Audrey tracked further west than Laura and drove peak or near-peak surge directly up Calcasieu Lake (which extends 19 miles inland & lies at sea level). Laura's peak surge, on the other hand, crossed entirely over marshy land. I'm sure you can see why one is more impressive.
That said, I'm not sure where the idea that Laura is somehow "certainly far less impressive than other peak-season majors that occurred in the same general region over the years" came from, especially considering that Laura rapidly intensified by 55kt in 24 hours, produced the highest storm surge ever recorded in southwest Louisiana (list), and within the top 10 highest surges ever recorded in the US. And if we use the official database, Laura is the strongest hurricane to strike Louisiana since Camille (and the strongest ever for southwest Louisiana) so I'm not sure what makes Laura "certainly far less impressive". ... I used SLOSH because it provides surge in terms of inundation above ground level, which is what the ArcGIS recap of Laura's surge also did, so I was trying to be fair because the vocabulary concerning storm surge, tide, and inundation is very precise and can mean different things; the 13.9 ft value I mentioned is above sea level, as you and I both noted. Regardless this is still quite lower than the 18 ft above ground level inundation that occurred in Laura (or the 17.1 ft high-water mark measured). Hurricane Laura also approached the coast at a more oblique angle and at a faster speed, so if anything Audrey's slower and more perpendicular motion gave its surge a slight "advantage".
There is very little variation in elevation in Southwestern Louisiana, much less between sea level and marshland. According to its TCR (p. 6), Laura’s peak high-water mark of 17.2 ft AGL occurred in Oak Grove, LA, a part of Creole. According to Google Earth the highest elevation in Oak Grove is 2 m (~7 ft) ASL. Moreover, Oak Grove is apparently partly sited on fill or spoil material, being located at the end of a dredged canal, which can contribute to the “piling up” of water; a similar situation could have occurred along the Mermentau River during Audrey, resulting in the peak measurement of 13.9 ft ASL there, though I suspect that dredging and canalisation was less developed in 1957 than in the 1960s and later, so artificial contributions to water heights might have been less back then. So the difference between MSL and ground level in the marshy lands in and around Creole, to not mention across the entirety of coastal Southwestern Louisiana, is negligible, contributing only ±2 m (usually ≤ 1 m and often far less, especially away from canals and artificial embankments). When the lower level of infrastructure and development in 1957 vs. 2020 is taken into account, Audrey’s high-water marks come across as being at least as or even more impressive than Laura’s.
Ubuntwo wrote:
Shell Mound wrote:Bottom line: there is very good circumstantial evidence, based on actual observations (as opposed to theoretical modelling), that Audrey’s MSLP was in the low 920s as it made landfall in LA, which, given its smaller-than-average “inner” RMW of ≤ 15 n mi and relatively fast forward movement offsetting low environmental pressure, would suggest a high-end Category 4 or borderline Cat-4/-5 in terms of MSW at LF, given that Audrey had apparently been undergoing and completing an ERC while offshore and its inner eye still contracting and intensifying as the storm made landfall. Observations of the winds from Lake Charles, Port Arthur, and Cameron combined suggest that Audrey had both a small inner RMW of ≤ 15 n mi and an outer RMW of ~30 n mi, which fits the pattern of observed storm-surge values
I'm not sure why you cite surge to support an intensity in the low 920s. A low 920s landfall on this stretch of coast, especially with a system undergoing broadening via ERC, would be in excess of 20 feet. That is well beyond what one can assume with undersampling. Peak surge does not always occur in the RMW, it occurs wherever flow is both directly perpendicular to the coastline and at its maximum. It's also worth noting the difference between storm tide and storm surge. One is measured above MHHW, the other is simply an elevation from the average. They can be separated by 4ft+ especially if tides align.
Considering 959mb was observed in Cameron, which clearly received part of the inner eyewall based on radar loops, it's very difficult to argue for a sub-930 pressure. Pressure gradient strongly levels off in the eye of a storm, in which the 1mb/10kt rule is usually applied. That would imply a record eyewall gradient exceeding storms like Dorian, which seems very unlikely considering Audrey's just below average eye and ongoing ERC. If the 924.5mb measurement had ANY credibility it would receive an official mention. A lack of calibration is very common.
As I noted earlier, the reanalysis mentioned that Winnfield, LA, recorded a minimum MSLP of 972 mb at 00Z on 28 June, nearly ten hours after landfall. The reanalysis calculated that a MSLP of 972 mb so far inland would suggest a MSLP of no more than 940 mb at landfall. This was among several possible values calculated for Audrey’s estimated MSLP at landfall, ranging from a possible minimum (lower bound) of 919 mb to a possible maximum (upper bound) of 960 mb. Winnfield’s peak observed MSW occurred from the east-southeast, suggesting that Audrey’s centre passed just to its west. Audrey was moving due N at LF, yet peak observed water marks occurred E (and likely W) of Cameron.
Based on radar imagery ~1h pre-LF, Cameron actually appears to have encountered the eastern edge of Audrey’s inner eyewall, so the RMW passed a bit to its west:
As far as pressure gradients inside the RMW (eye) are concerned, the 1947 Fort Lauderdale hurricane featured a strong pressure gradient inside its eye. Hillsboro Inlet Lighthouse was located just inside the RMW, near the northern edge of the eye, and recorded a brief decrease in the winds, along with an adjusted minimum MSLP of 947 mb. To its immediate west, a private barometer at Cap’s Place in present-day Lighthouse Point measured 945 mb. Farther south, three separate stations in and near Fort Lauderdale, which was closest to the centre of the eye and reported a lull of one hour and fifteen minutes, registered minimum MSLP values ranging from 951 to 956 mb.
Ubuntwo wrote:
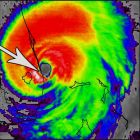
Shell Mound wrote:At 2045Z on 15 September 2004, the ADT CI for Ivan was 6.0 (115 kt), whereas Laura’s ADT CI at 0250Z on 27 August 2020 was 6.4 (125 kt). Yet Ivan’s CDO was clearly more symmetric than Laura’s, its cloud-tops were far colder, and Ivan’s eye was arguably just as warm as Laura’s. Yet Laura’s ADT CI was 10 kt higher than Ivan’s. If anything, Laura’s should have been lower than Ivan’s, not higher. Are ADT estimates calculated differently today?
Yes, ADT's algorithm has changed. Satellites have also improved in resolution allowing them to better resolve eye temps (though Laura's was warmer at that point regardless).
These two GOES IR images, taken from the GIBBS archive, seemingly rely on the same temperature-scale, even though the image of Ivan was taken by GOES 12 and that of Laura by GOES 16. Even so, considering the latter’s higher resolution, Laura’s presentation should have been more impressive than Ivan’s, given that Laura was officially 15 kt stronger than Ivan at the time its image was taken. Ivan (left) clearly appears to be more intense than Laura (right), yet Ivan’s ADT CI was 115 kt at this time, while Laura’s was 125 kt. Notably, Ivan’s overall circulation and CDO are more symmetric than Laura’s, and Ivan was then encountering less vertical wind shear in its eastern and western quadrants, respectively, than Laura was, and featured considerably colder cloud-tops. I think the ADT CI should be reversed: Ivan should be assigned 125 kt and Laura 115 kt.
Ubuntwo wrote:
Shell Mound wrote:Regarding Harvey, I was mainly alluding to the damage in and around Rockport, which clearly was not indicative of Category-4 winds, given the lack of extreme vegetative damage and the fact that even relatively frail buildings tended to survive.
It should be noted, however, that the northeastern quadrant
of the hurricane came ashore in an unpopulated and unmonitored area near San Jose Island and
Matagorda Island, including Aransas National Wildlife Refuge, and the maximum winds were
probably not sampled by any anemometer.
Rockport is 8 miles inland from the coast, separated from the barrier island by a small bay. This is more than enough for land friction to take effect and reduce winds. They did not receive the RMW and were also on the weaker south side of the storm. High-end category 2 is probably around the wind most of Rockport received, barring mesovort gusts. Aransas Pass recorded 96kt, well outside the RMW - on the southern rim of Harvey's eyewall. This is perfectly in line with recon SMFR - they peaked at 90-100kt on Harvey's south side. With a landfall pressure of 938mb Harvey is in the company of strong category four hurricanes, many even larger than the storm - Knaff-Zehr corroborates this. 700mb flight level reduction, SFMR pre-shoaling (no, waves do not break 30 miles offshore south Texas) and wind-pressure relationships all strongly support a category 4 Harvey. As with every other high-end hurricane, it is accepted that maximum winds occur on an unsampled beach, otherwise Audrey would go down as a low-end category 1.
You are correct about Harvey. I gracefully retract my earlier statements.
Ubuntwo wrote:So, "Are the strongest US hurricanes getting smaller and/or weaker?" Well, they're not getting smaller. Frances, Wilma, and Irma were all enormous hurricanes at landfall. So are they getting weaker? Easiest standard to use is landfall pressure. Barometers are just about the only tool of observation reliable back to the 19th century, as long as they are well-calibrated.
None of those three hurricanes counts as among the strongest U.S. hurricanes by MSW at LF, and only Irma, with its minimum MSLP of 931 mb on Cudjoe Key, FL, is listed among the most intense by MSLP at LF. As I have mentioned earlier, I think Irma was more probably 110 kt, or high-end Category 3, at landfall in the Florida Keys than 115 kt, or low-end Category 4, based on a blend of radar velocities and aircraft data during landfall. 110 kt would also fit the filling rate observed by reconnaissance between the Straits of Florida north of Cuba, where Irma’s minimum MSLP briefly dipped to 928 mb (coincident with reconnaissance data supporting MSW of 115 kt) over the Gulf Stream, and Irma’s final landfall on Marco Island, FL, where storm chasers indicated a MSLP of 936 mb in the eye and MSW of 100 kt, based on a one-minute observation of 97 kt at 10 m. I would venture that Irma weakened by 5 kt per every 2 mb of filling between the Straits and Marco Island, which would support 110 kt in the Keys and 100 kt on Marco Island. Furthermore, post-storm surveys by the NWS in Key West derived estimated peak representative wind gusts of ~113 kt on Big Pine Key, which experienced the eastern eyewall and the strongest winds of Irma. Those gusts would correspond to ~87 kt MSW on land. Assuming slightly stronger winds just to the east, over water between Big Pine and Bahia Honda Keys—over and/or around Spanish Harbour, Big Mangrove, and No Name Keys—would correspond perfectly with 110 kt.
Ubuntwo wrote:Your posts use a smattering of observations varying in credibility/official status, the gaps filled in with logical leaps and conclusions as if the mere presence of a citation supports them. And the tone constantly implies a superiority towards the NHC and associated agencies. We're just weather enthusiasts. They know better.
While I do respect the professionals at the NHC, upon recent examination I have had some questions about recent classifications. Regarding Zeta, for instance:
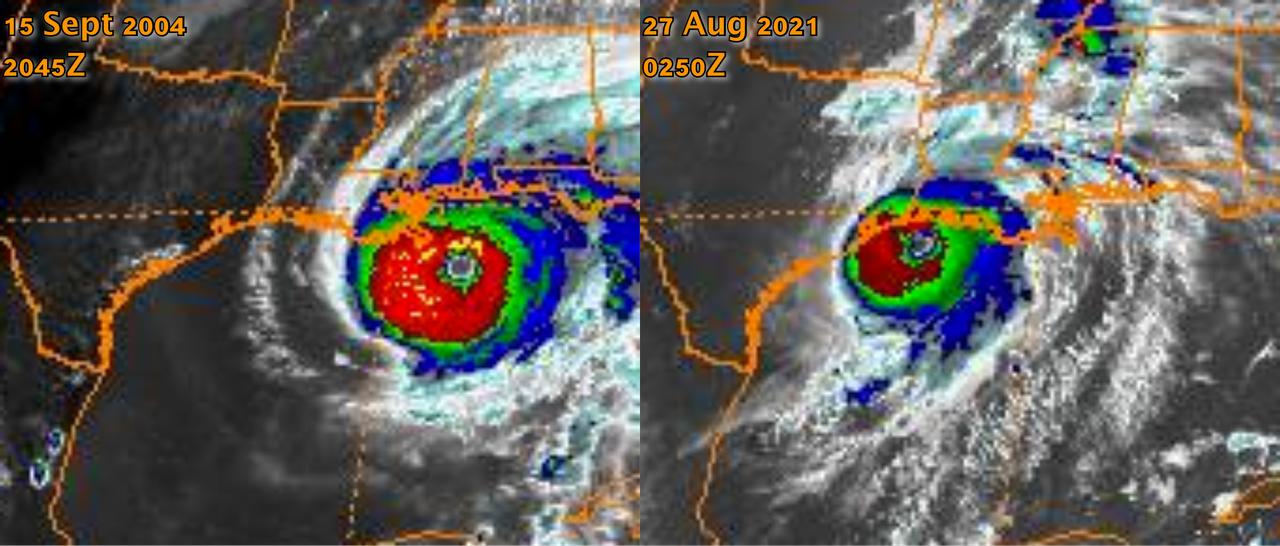
This image was taken from Zeta’s TCR. According to both the above and radar loops, Zeta’s peak radar velocities clearly struck Port Fourchon, LA, at ~2045Z:
0:26 in the above loop corresponds to the peak radar velocities in the figure from the TCR, and shows the maximum velocities heading through Port Fourchon and passing east of Golden Meadow. According to the TCR, Golden Meadow measured peak 1-min MSW of ~82 kt at 2139Z (peak gust: 96 kt), its anemometer being sited 6 m AGL. The TCR also notes that a levee breached and caused some localised flooding in and around Port Fourchon and Golden Meadow, but nothing particularly extreme. Nearby, an anemometer in Cocodrie measured ~67 kt NNW 1-min MSW at 2130Z, and another instrument in Port Fourchon measured ~76 kt SE 1-min MSW at 21Z. Furthermore, here are some images of the damage in and around Port Fourchon, Golden Meadow, and Leeville:
None of these images shows wind-caused damage that would be suggestive of anything stronger than sustained Category-1 winds. Some power poles were downed, possibly by surge and/or wave in some cases, but not snapped; metal structures were blown down; and some shingles and loose coverings were blown loose. Several of these images were taken in Port Fourchon, which should have experienced low-end Category-3 winds, per radar. Even the images from Golden Meadow do not suggest anything stronger than low-end Category-1 winds, with barely any damage to vegetation, structures, or power poles. I experienced low-end sustained Cat-1 conditions during Wilma in Boca Raton, FL, back in 2005, and even these caused far more serious damage to utilities, roofs, screens, trees, and shrubs than anything in the images from Zeta shown above.
Taken together, the data suggest that the radar velocities were mesoscale in nature and not representative of Zeta’s surface winds. Reanalysis may be necessary.
As far as Elsa is concerned, it was certainly a hurricane over the Lesser Antilles, but after that point I think its winds were largely overestimated. Case in point:
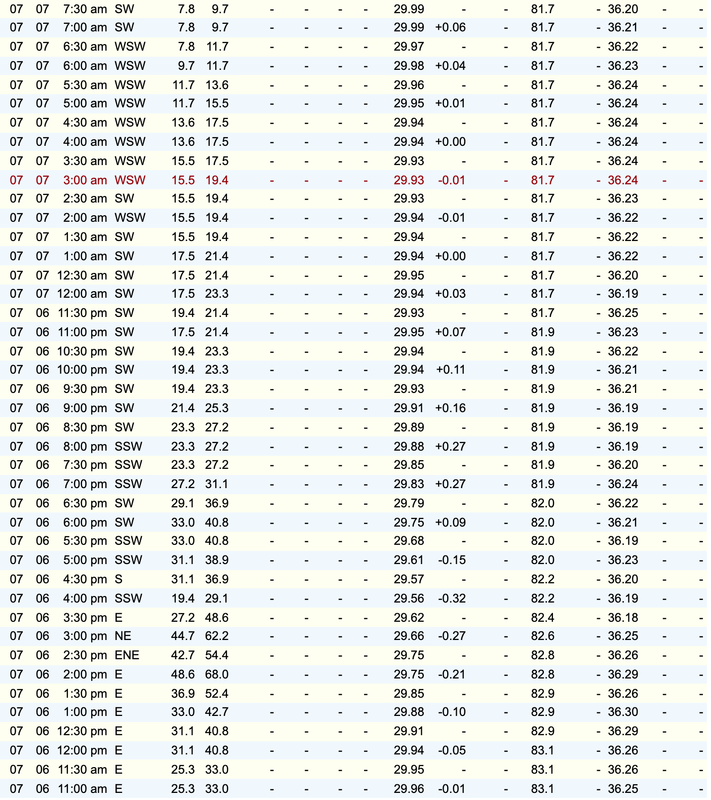
This image shows conditions at Buoy 41023 while Elsa passed nearly overhead. The buoy was located over the eastern Gulf of Mexico, and Elsa passed closest by on 6 July 2021. While the NHC indicated that the centre passed just east of the buoy, the actual observations from the buoy suggested that the centre passed just to the west. Furthermore, while the NHC upgraded Elsa to a hurricane at that point based on radar velocities, observations from the buoy, which sampled the strongest quadrant of N-moving Elsa, suggested that MSW were only around 55 kt rather than 65 kt at that time. Perhaps Elsa is another storm that merits reevaluation in the future.
Any thoughts on my points regarding Zeta and Elsa? Initially I agreed with Zeta being a Cat-3, but upon further review I have come to doubt.
1 likes
CVW / MiamiensisWx / Shell Mound
The posts in this forum are NOT official forecasts and should not be used as such. They are just the opinion of the poster and may or may not be backed by sound meteorological data. They are NOT endorsed by any professional institution or STORM2K. For official information, please refer to products from the NHC and NWS.
You’ve been proven wrong multiple times including by an Ivy Leaguer in TheAustinMan, who’s studying meteorology and who went to great lengths to correctly prove whatever you’re trying is wrong.
Teban54 wrote:Just curious, how does that explain Iota then? I remember that after Eta, people were saying Iota would have some extremely cool cloud tops due to November troposphere. But that didn't happen and Iota actually looked like a "normal" high end C4/low end C5 on IR, unlike Eta.
That's a great question I don't know the answer to. I imagine there are many other intraseasonal factors that influence cloud top temperatures, time of year being the most 'consistent'.
Shell Mound wrote:Any thoughts on my points regarding Zeta and Elsa? Initially I agreed with Zeta being a Cat-3, but upon further review I have come to doubt.
Zeta is definitely a weird one. When baroclinic forcing comes into play, traditional reduction factors and vertical wind profiles go out the window. The evidence for C3 is pretty solid though. A dropsonde recorded a mean boundary layer wind of 119kt. Considering this was in a weaker quadrant it supports 100kt. As for radar velocities, a couple points. Because of the position of KLIX in relation to the storm at landfall, proper RFQ velocities were not sampled (recon did not sample it either and the NHC takes explicit note of this in the TCR). Also, the last couple passes into Zeta's eastern side had SFMRs peak 5-10 miles west of FL wind, suggesting an outward slant with height. So the position of intense velocities aloft doesn't directly correspond to where they will peak on the ground, in this case they line up better with scattered barrier islands.
I should point out that, in the pre-SFMR "good ol days", Zeta would have been upgraded to category 3 without question. Dropsondes and 700mb flight level winds easily supported it.
A word of warning against relying on pre-doppler weather radar. The reflectivity cutoff was in the 20-30 dBZ range, above which reflectivity didn't matter. This makes it really hard to distinguish convective intensity. A 30 dBZ section of eyewall would look just as beefy as intense convection on early radar, instead appearing rather weak and anemic on modern WSR-88s.
9 likes
Kendall -> SLO -> PBC
Memorable Storms: Katrina (for its Florida landfall...) Wilma Matthew Irma
Shell Mound wrote:Any thoughts on my points regarding Zeta and Elsa? Initially I agreed with Zeta being a Cat-3, but upon further review I have come to doubt.
Zeta is definitely a weird one. When baroclinic forcing comes into play, traditional reduction factors and vertical wind profiles go out the window. The evidence for C3 is pretty solid though. A dropsonde recorded a mean boundary layer wind of 119kt. Considering this was in a weaker quadrant it supports 100kt. As for radar velocities, a couple points. Because of the position of KLIX in relation to the storm at landfall, proper RFQ velocities were not sampled (recon did not sample it either and the NHC takes explicit note of this in the TCR). Also, the last couple passes into Zeta's eastern side had SFMRs peak 5-10 miles west of FL wind, suggesting an outward slant with height. So the position of intense velocities aloft doesn't directly correspond to where they will peak on the ground, in this case they line up better with scattered barrier islands.
I should point out that, in the pre-SFMR "good ol days", Zeta would have been upgraded to category 3 without question. Dropsondes and 700mb flight level winds easily supported it.
A word of warning against relying on pre-doppler weather radar. The reflectivity cutoff was in the 20-30 dBZ range, above which reflectivity didn't matter. This makes it really hard to distinguish convective intensity. A 30 dBZ section of eyewall would look just as beefy as intense convection on early radar, instead appearing rather weak and anemic on modern WSR-88s.
All these bolded points make sense. Regarding Zeta, however, I did mention a handful of observations from Cocodrie and Port Fourchon that the TCR did not include. These observations indicate peak MSW of ~67 kt NNW in Cocodrie at 2130Z and ~76 kt SE in Port Fourchon at 21Z. Taking into account the likelihood that the maximum surface winds were offset ~4–9 n mi west of the strongest radar-derived velocities and FL winds, how well do these aforementioned observations line up with SFMR and an estimated MSW of 100 kt at LF? In Zeta’s case, could MSW ~4–9 n mi west of Port Fourchon be 20 kt higher than in town? Additionally, why do photographs of the damage from Golden Meadow suggest lower MSW than the anemometer measured? For example, I have not yet seen images showing widespread downing/snapping of numerous trees or “major roof and siding damage” to “well-constructed frame homes.” The anemometer in Golden Meadow reported 82 kt 1-min MSW at 6 m, so if anything 10-m winds would have been slightly higher, but there is no real visual evidence of Cat-2 conditions in town.
Edit: the FL wind of 119 kt coincided with SFMR of 71 kt. The maximum SFMR on the same pass was 87 kt, or 16 kt higher. 76 + 16 = 92 kt.
Also, what are your thoughts on the points that presented below regarding Elsa?
As far as Elsa is concerned, it was certainly a hurricane over the Lesser Antilles, but after that point I think its winds were largely overestimated. Case in point:
This image shows conditions at Buoy 41023 while Elsa passed nearly overhead. The buoy was located over the eastern Gulf of Mexico, and Elsa passed closest by on 6 July 2021. While the NHC indicated that the centre passed just east of the buoy, the actual observations from the buoy suggested that the centre passed just to the west. Furthermore, while the NHC upgraded Elsa to a hurricane at that point based on radar velocities, observations from the buoy, which sampled the strongest quadrant of N-moving Elsa, suggested that MSW were only around 55 kt rather than 65 kt at that time.
I feel that I am learning more and more from these discussions, so I appreciate the responses.
2 likes
CVW / MiamiensisWx / Shell Mound
The posts in this forum are NOT official forecasts and should not be used as such. They are just the opinion of the poster and may or may not be backed by sound meteorological data. They are NOT endorsed by any professional institution or STORM2K. For official information, please refer to products from the NHC and NWS.
I don't have anything to add to the discussion about intensity and how it was indicated by different generations of satellite and radar... but the argument for hurricanes getting smaller in size seems pretty easy to refute on its face. Super jumbo sized hurricanes and the extra complications they cause have been a defining trait of 21st century seasons. Ivan, Katrina, Wilma, Ike (which became the poster child for this pattern), Isaac, Sandy, Irma, Delta, etc...
Shell Mound wrote:If one looks at old radar images of Audrey, Carla, Camille, Celia, and Eloise, among others, one sees that, even with crude techniques in place then vs. today’s technology, those storms had much more impressive radar presentations at landfall vs. most recent MH impacts on the CONUS. Since the 1990s only Andrew, Charley, and Michael really compare to many of these old storms in terms of radar-based presentation.
Audrey and Eloise were degrading and had open eyewalls as they came in.
The ragged appearances you mention on radar seem to result from specifically northward-moving hurricanes interacting with continental air, particularly in the northern Gulf of Mexico--Carmen (at the time 120mph) proves an excellent example of this from the earlier period. It's actually uncommon to find a solid presentation near or north of 30N, but as there were more hurricanes hitting the US since the 1990s, naturally there will be more examples of radar presentations that degrade as they move in, as this is the more common result.
There have also been a fair amount of strengthening Cat 2 hurricanes that have had a fairly intense radar appearance, seemingly moreso than during the 60s-80s.
1 likes
The above post is not official and should not be used as such. It is the opinion of the poster and may or may not be backed by sound meteorological data. It is not endorsed by any professional institution or storm2k.org. For official information, please refer to the NHC and NWS products.
Shell Mound wrote:If one looks at old radar images of Audrey, Carla, Camille, Celia, and Eloise, among others, one sees that, even with crude techniques in place then vs. today’s technology, those storms had much more impressive radar presentations at landfall vs. most recent MH impacts on the CONUS. Since the 1990s only Andrew, Charley, and Michael really compare to many of these old storms in terms of radar-based presentation.
Audrey and Eloise were degrading and had open eyewalls as they came in.
Based on aircraft and surface observations, both storms were actually deepening up until landfall; official reports on Audrey and Eloise, to not mention the reanalysis of Audrey, make this clear. Therefore, both storms could hardly have been degenerating as they came ashore. Eloise in particular was deepening quite rapidly up until landfall, much like 1970’s Celia. If I recall correctly, radar imagery of Celia also showed an open inner core, so all three cases likely indicate the influence of attenuation. Observations indicate that Audrey’s MSLP at landfall was no higher than 946 mb—likely much lower—while Eloise’s was likely below 955 mb, given that the 955 mb was measured at Destin, near the western edge of the eye.
As an aside, where did you locate radar-based imagery of Eloise?
0 likes
CVW / MiamiensisWx / Shell Mound
The posts in this forum are NOT official forecasts and should not be used as such. They are just the opinion of the poster and may or may not be backed by sound meteorological data. They are NOT endorsed by any professional institution or STORM2K. For official information, please refer to products from the NHC and NWS.
Shell Mound wrote:If one looks at old radar images of Audrey, Carla, Camille, Celia, and Eloise, among others, one sees that, even with crude techniques in place then vs. today’s technology, those storms had much more impressive radar presentations at landfall vs. most recent MH impacts on the CONUS. Since the 1990s only Andrew, Charley, and Michael really compare to many of these old storms in terms of radar-based presentation.
Audrey and Eloise were degrading and had open eyewalls as they came in.
Based on aircraft and surface observations, both storms were actually deepening up until landfall; official reports on Audrey and Eloise, to not mention the reanalysis of Audrey, make this clear. Therefore, both storms could hardly have been degenerating as they came ashore. Eloise in particular was deepening quite rapidly up until landfall, much like 1970’s Celia. If I recall correctly, radar imagery of Celia also showed an open inner core, so all three cases likely indicate the influence of attenuation. Observations indicate that Audrey’s MSLP at landfall was no higher than 946 mb—likely much lower—while Eloise’s was likely below 955 mb, given that the 955 mb was measured at Destin, near the western edge of the eye.
As an aside, where did you locate radar-based imagery of Eloise?
Found Eloise (as well as Agnes during the same search) while trying to fill in my radar archive:
The above post is not official and should not be used as such. It is the opinion of the poster and may or may not be backed by sound meteorological data. It is not endorsed by any professional institution or storm2k.org. For official information, please refer to the NHC and NWS products.
Weaker??? They are probably getting smaller in the Atlantic( mostly MDR) and I think this is due to increased stability .Saharan Dust outbreaks and that warm pool of the Eastern United States that became common since 2012 help to increase stability in the Deep Tropics. Also, too much convention in the Pacific.
Deshaunrob17 wrote:Weaker??? They are probably getting smaller in the Atlantic( mostly MDR) and I think this is due to increased stability .Saharan Dust outbreaks and that warm pool of the Eastern United States that became common since 2012 help to increase stability in the Deep Tropics. Also, too much convention in the Pacific.
I concur with all these points. They also explain why the peak of the season has become delayed since 2013. As climate change results in an expansion of the Hadley cell + warming of the NW subtropical Atlantic → more static stability in the deep tropics through late August. As seasons change from summer to fall instability usually increases during September/October, especially toward late September, as wavelengths shorten and amplitudes increase due to extratropical influence(s). But due to AGW the change now occurs later in the year, leading to more “back-loaded” seasons. However, recent trends toward more of a -AMM/-AMO signal (cooler far N Atlantic during late fall/winter/spring) since 2013 suggest that the “lengthening” of the season might be temporary, as SST in the tropical Atlantic tend to decrease, climatologically speaking, after mid-September. A more active African monsoon in recent seasons also results in broader waves that take time to consolidate until entering the subtropics farther NW. So overall since 2012 the various factors have arguably become less favourable for MH impacts, especially Category-4+, on the CONUS, given that most Cat-4+ impacts on the mainland U.S. have been associated with long-trackers that originated in the MDR, and the MDR has become much less conducive to MH, on balance, since 2012 (and to a lesser extent since 2005), 2017 being an exception to the trend. Since all the trends that you mentioned are in one way or another linked to AGW via Greenland ice melt → weaker Atlantic THC, one can reasonably conclude that climate change may be causing the most recent +AMO to end earlier than, say, previous +AMOs that lasted for much of the cooler nineteenth century, the same period as the so-called “Little Ice Age.” Anyway, since the climate has warmed since the 1980s, it is quite possible that the strongest U.S. landfalling hurricanes have become smaller, weaker, and/or less frequent as a result, given indirect influences on the MDR etc.
0 likes
CVW / MiamiensisWx / Shell Mound
The posts in this forum are NOT official forecasts and should not be used as such. They are just the opinion of the poster and may or may not be backed by sound meteorological data. They are NOT endorsed by any professional institution or STORM2K. For official information, please refer to products from the NHC and NWS.
Deshaunrob17 wrote:Weaker??? They are probably getting smaller in the Atlantic( mostly MDR) and I think this is due to increased stability .Saharan Dust outbreaks and that warm pool of the Eastern United States that became common since 2012 help to increase stability in the Deep Tropics. Also, too much convention in the Pacific.
I concur with all these points. They also explain why the peak of the season has become delayed since 2013. As climate change results in an expansion of the Hadley cell + warming of the NW subtropical Atlantic → more static stability in the deep tropics through late August. As seasons change from summer to fall instability usually increases during September/October, especially toward late September, as wavelengths shorten and amplitudes increase due to extratropical influence(s). But due to AGW the change now occurs later in the year, leading to more “back-loaded” seasons. However, recent trends toward more of a -AMM/-AMO signal (cooler far N Atlantic during late fall/winter/spring) since 2013 suggest that the “lengthening” of the season might be temporary, as SST in the tropical Atlantic tend to decrease, climatologically speaking, after mid-September. A more active African monsoon in recent seasons also results in broader waves that take time to consolidate until entering the subtropics farther NW. So overall since 2012 the various factors have arguably become less favourable for MH impacts, especially Category-4+, on the CONUS, given that most Cat-4+ impacts on the mainland U.S. have been associated with long-trackers that originated in the MDR, and the MDR has become much less conducive to MH, on balance, since 2012 (and to a lesser extent since 2005), 2017 being an exception to the trend. Since all the trends that you mentioned are in one way or another linked to AGW via Greenland ice melt → weaker Atlantic THC, one can reasonably conclude that climate change may be causing the most recent +AMO to end earlier than, say, previous +AMOs that lasted for much of the cooler nineteenth century, the same period as the so-called “Little Ice Age.” Anyway, since the climate has warmed since the 1980s, it is quite possible that the strongest U.S. landfalling hurricanes have become smaller, weaker, and/or less frequent as a result, given indirect influences on the MDR etc.
#2017 defied everything you said. Irma was a large Cat 4 with a pressure of 930mb. Also, storms like Sandy with a span of over 1100 miles in gale force wins seriously throws doubt over the hypothesis that storms that are making landfall now are smaller and weaker now than in the past. With more moisture available, storms will be able to be larger now than then. 2017 Irma show this is the case as well as Sandy(the Carribbean moisture was what allowed such a large moisture envelope) and Igor, Teddy both were in the top 4 largest atlantic storms and that means 3 of the four largest storms since 1857 have occurred in the past 11 years. Also Katrina had the largest hurricane force wind span in the gulf and slammed into the Gulf coast as a massive beast.
2 likes
I am by no means a professional. DO NOT look at my forecasts for official information or make decisions based on what I post.
Goal: to become a registered expert over tropical and subtropical cyclones.
Interesting article on hurricane active/inactive phases. Not sure just over 100 years of data is enough of a sample size to conclude if hurricanes are getting smaller and/or weaker. There is a tremendous amount of precision to determine a hurricanes size/strength today without being on the ground during the storm, so there is no comparison of the current precise analysis of hurricanes compared to prior to 1980.
I really don't think one can compare today's hurricanes to hurricanes of the past based on the technology of the day. Years ago, before doppler radar, GPS dropsondes, surface winds were estimated based on the size of waves. Flight level winds were thought to be representative of surface winds. Trying to compare WSR-88 radar to the WSR-1 radars common to the 1950s is faulty. On the older radars, those image one sees today were photographs of the radar screen. No signal processing was available back then nor was volume scans. Those old radars were just only military radars adapted to civilian use. Hurricanes have not changed over the years....just the technology to sample them have.....MGC


