I posted it in the ENSO thread.
2021 Indicators: SST's / SAL / MSLP / Shear / Steering / Instability / Sat Images
Moderator: S2k Moderators
Forum rules

The posts in this forum are NOT official forecasts and should not be used as such. They are just the opinion of the poster and may or may not be backed by sound meteorological data. They are NOT endorsed by any professional institution or STORM2K. For official information, please refer to products from the National Hurricane Center and National Weather Service.
-
cycloneye

- Admin

- Posts: 149508
- Age: 69
- Joined: Thu Oct 10, 2002 10:54 am
- Location: San Juan, Puerto Rico
Re: 2021 Indicators: SST's / SAL / MSLP / Shear / Steering / Instability / Sat Images
I posted it in the ENSO thread.
1 likes
Visit the Caribbean-Central America Weather Thread where you can find at first post web cams,radars
and observations from Caribbean basin members Click Here
and observations from Caribbean basin members Click Here
-
cycloneye
- Admin
- Posts: 149508
- Age: 69
- Joined: Thu Oct 10, 2002 10:54 am
- Location: San Juan, Puerto Rico
Re: 2021 Indicators: SST's / SAL / MSLP / Shear / Steering / Instability / Sat Images
1 likes
Visit the Caribbean-Central America Weather Thread where you can find at first post web cams,radars
and observations from Caribbean basin members Click Here
and observations from Caribbean basin members Click Here
-
SFLcane

- S2K Supporter

- Posts: 10281
- Age: 48
- Joined: Sat Jun 05, 2010 1:44 pm
- Location: Lake Worth Florida
Re: 2021 Indicators: SST's / SAL / MSLP / Shear / Steering / Instability / Sat Images
Cdas is garbage..

2 likes
-
AlphaToOmega
- Category 5

- Posts: 1448
- Joined: Sat Jun 26, 2021 10:51 am
- Location: Somewhere in Massachusetts
-
Category5Kaiju

- Category 5
- Posts: 4334
- Joined: Thu Dec 24, 2020 12:45 pm
- Location: Seattle and Phoenix
Re: 2021 Indicators: SST's / SAL / MSLP / Shear / Steering / Instability / Sat Images
So it looks like as of now there's quite a bit of talk on this season being above average but not hyperactive; however, is there really a surefire way at this point of distinguishing between the two? I thought it may have been Eric Webb but I do remember nebulously earlier this month or so when he showed on Twitter a predicted 2021 velocity pattern that matched that of a hyperactive year composite?
3 likes
Unless explicitly stated, all info in my posts is based on my own opinions and observations. Tropical storms and hurricanes can be extremely dangerous. Refer to an accredited weather research agency or meteorologist if you need to make serious decisions regarding an approaching storm.

Re: 2021 Indicators: SST's / SAL / MSLP / Shear / Steering / Instability / Sat Images
Category5Kaiju wrote:So it looks like as of now there's quite a bit of talk on this season being above average but not hyperactive; however, is there really a surefire way at this point of distinguishing between the two? I thought it may have been Eric Webb but I do remember nebulously earlier this month or so when he showed on Twitter a predicted 2021 velocity pattern that matched that of a hyperactive year composite?
To me, it seems that to most people trying to establish a correlation (or even causation) between MDR SSTs and hyperactivity, there's an underlying assumption that hyperactive seasonal activity correlates with hyperactive MDR activity.
While that's true in some hyperactive years like 2017 and 2010, the fact that the two most active seasons on record, 2020 and 2005, had record high MDR SSTs yet relatively lackluster storms and ACE in the MDR, should at least raise some doubts. I'm curious just how much correlation there is between MDR SSTs and MDR ACE.
3 likes
TC naming lists: retirements and intensity
Most aggressive Advisory #1's in North Atlantic (cr. kevin for starting the list)
Most aggressive Advisory #1's in North Atlantic (cr. kevin for starting the list)
-
AlphaToOmega
- Category 5
- Posts: 1448
- Joined: Sat Jun 26, 2021 10:51 am
- Location: Somewhere in Massachusetts
Re: 2021 Indicators: SST's / SAL / MSLP / Shear / Steering / Instability / Sat Images
Category5Kaiju wrote:So it looks like as of now there's quite a bit of talk on this season being above average but not hyperactive; however, is there really a surefire way at this point of distinguishing between the two? I thought it may have been Eric Webb but I do remember nebulously earlier this month or so when he showed on Twitter a predicted 2021 velocity pattern that matched that of a hyperactive year composite?
There is no surefire way, but the forecasted VP pattern for 2021 ASO is certainly indicative of a hyperactive season. This is based on the CanSIPS forecast initialized on 2021-06-30. Within the last AMO phase, only four seasons had -VP over Africa and +VP over EPac: 1995, 1996, 2010, and 2020, all of which were hyperactive (165% of the 1951 to 2020 median ACE).
Edit: 1996 was actually a -AMO year; only 1995, 2010, and 2020 can be used as analogs in this regard.
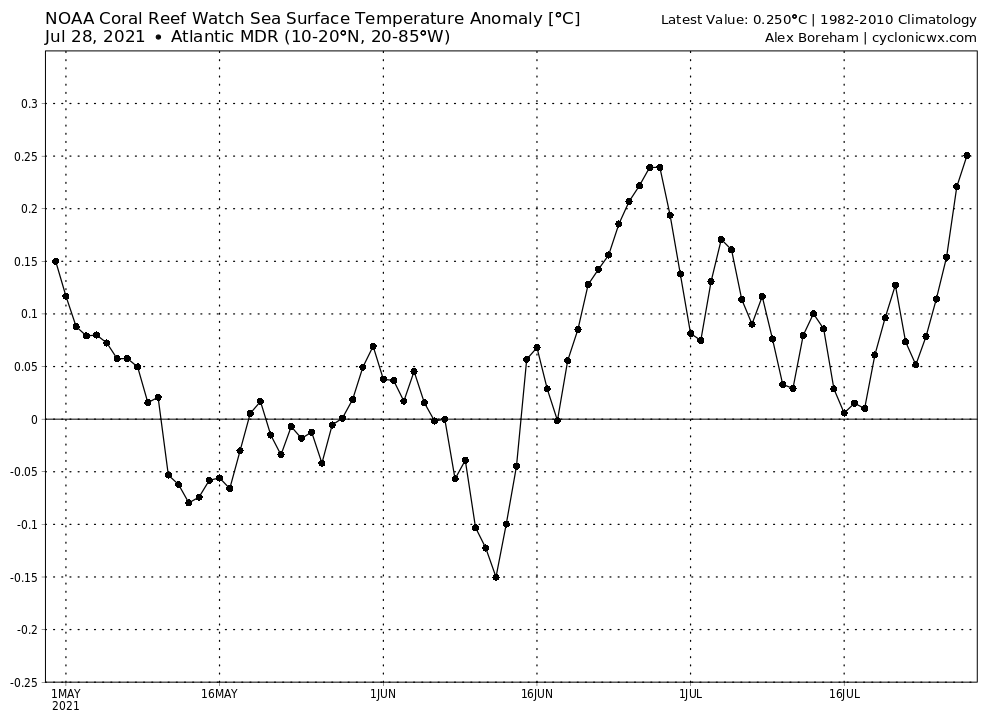
1996 -0.020 -0.042 -0.067 -0.000 -0.075 -0.133 -0.115 -0.018 -0.011 -0.155 -0.184 -0.165
Last edited by AlphaToOmega on Wed Jul 28, 2021 10:36 am, edited 1 time in total.
0 likes

Re: 2021 Indicators: SST's / SAL / MSLP / Shear / Steering / Instability / Sat Images
AlphaToOmega wrote:Category5Kaiju wrote:So it looks like as of now there's quite a bit of talk on this season being above average but not hyperactive; however, is there really a surefire way at this point of distinguishing between the two? I thought it may have been Eric Webb but I do remember nebulously earlier this month or so when he showed on Twitter a predicted 2021 velocity pattern that matched that of a hyperactive year composite?
There is no surefire way, but the forecasted VP pattern for 2021 ASO is certainly indicative of a hyperactive season. This is based on the CanSIPS forecast initialized on 2021-06-30. Within the last AMO phase, only four seasons had -VP over Africa and +VP over EPac: 1995, 1996, 2010, and 2020, all of which were hyperactive (165% of the 1951 to 2020 median ACE).
What about seasons with -VP over Africa/IO and mostly +VP over the EPac with a small -VP cell? EPac competition caused by that -VP cell has been mentioned to potentially be a limiting factor for the Atlantic by generating shear, but if Pacific storms keep taking forever to develop and don’t become strong until further west like Felicia, then shear could be less.
1 likes
Irene '11 Sandy '12 Hermine '16 5/15/2018 Derecho Fay '20 Isaias '20 Elsa '21 Henri '21 Ida '21
I am only a meteorology enthusiast who knows a decent amount about tropical cyclones. Look to the professional mets, the NHC, or your local weather office for the best information.
I am only a meteorology enthusiast who knows a decent amount about tropical cyclones. Look to the professional mets, the NHC, or your local weather office for the best information.
-
tolakram
- Admin
- Posts: 20186
- Age: 62
- Joined: Sun Aug 27, 2006 8:23 pm
- Location: Florence, KY (name is Mark)
Re: 2021 Indicators: SST's / SAL / MSLP / Shear / Steering / Instability / Sat Images
If forecasting season numbers was easy no one would be getting it wrong. 
4 likes
M a r k
- - - - -
Join us in chat: Storm2K Chatroom Invite. Android and IOS apps also available.
The posts in this forum are NOT official forecasts and should not be used as such. Posts are NOT endorsed by any professional institution or STORM2K.org. For official information and forecasts, please refer to NHC and NWS products.
-
tolakram
- Admin
- Posts: 20186
- Age: 62
- Joined: Sun Aug 27, 2006 8:23 pm
- Location: Florence, KY (name is Mark)
Re: 2021 Indicators: SST's / SAL / MSLP / Shear / Steering / Instability / Sat Images
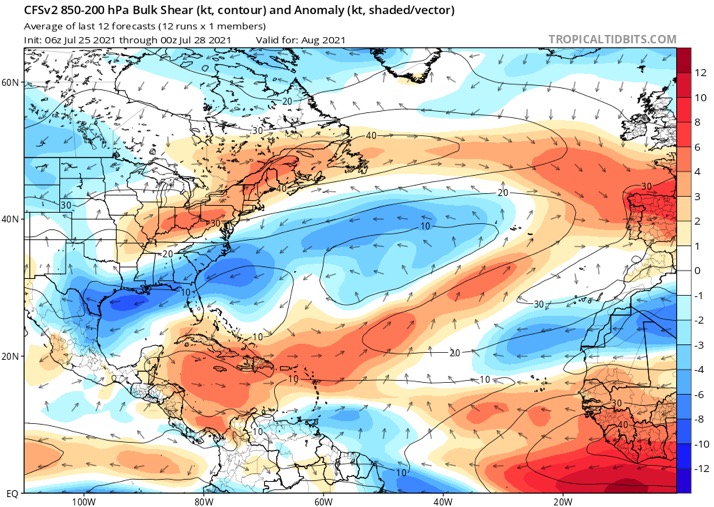
Latest 24hr shear analysis.

0 likes
M a r k
- - - - -
Join us in chat: Storm2K Chatroom Invite. Android and IOS apps also available.
The posts in this forum are NOT official forecasts and should not be used as such. Posts are NOT endorsed by any professional institution or STORM2K.org. For official information and forecasts, please refer to NHC and NWS products.
- - - - -
Join us in chat: Storm2K Chatroom Invite. Android and IOS apps also available.
The posts in this forum are NOT official forecasts and should not be used as such. Posts are NOT endorsed by any professional institution or STORM2K.org. For official information and forecasts, please refer to NHC and NWS products.
-
tolakram
- Admin
- Posts: 20186
- Age: 62
- Joined: Sun Aug 27, 2006 8:23 pm
- Location: Florence, KY (name is Mark)
Re: 2021 Indicators: SST's / SAL / MSLP / Shear / Steering / Instability / Sat Images
Live 12 hour upper WV loop
https://whirlwind.aos.wisc.edu/~wxp/goes16/wvh/goes16_fulldisk_60.html
source: https://www.aos.wisc.edu/weather/wx_obs/GOES16.html
https://whirlwind.aos.wisc.edu/~wxp/goes16/wvh/goes16_fulldisk_60.html
source: https://www.aos.wisc.edu/weather/wx_obs/GOES16.html
0 likes
M a r k
- - - - -
Join us in chat: Storm2K Chatroom Invite. Android and IOS apps also available.
The posts in this forum are NOT official forecasts and should not be used as such. Posts are NOT endorsed by any professional institution or STORM2K.org. For official information and forecasts, please refer to NHC and NWS products.
- - - - -
Join us in chat: Storm2K Chatroom Invite. Android and IOS apps also available.
The posts in this forum are NOT official forecasts and should not be used as such. Posts are NOT endorsed by any professional institution or STORM2K.org. For official information and forecasts, please refer to NHC and NWS products.
-
Shell Mound
- Category 5
- Posts: 2432
- Age: 33
- Joined: Thu Sep 07, 2017 3:39 pm
- Location: St. Petersburg, FL → Scandinavia
Re: 2021 Indicators: SST's / SAL / MSLP / Shear / Steering / Instability / Sat Images
aspen wrote:Shell Mound wrote:tolakram wrote:Can you clarify TC activity in the CPAC?Kingarabian wrote:Crazy how past 120W is the sweet spot so far. That's literally something you do not see in non +ENSO/+PDO/+PMM years.
Source
https://twitter.com/AndyHazelton/status/1420077643035258883
https://twitter.com/dmorris9661/status/1420078881697054725
https://twitter.com/AndyHazelton/status/1420080934313938944
https://twitter.com/AndyHazelton/status/1420087940823359488
https://twitter.com/HurricaneAddict/status/1420094264483139592
If the GFS’ hints of a TC attempting to form east of 50W between August 5-10th verify, that TUTT won’t be an issue, assuming it ends up in that position by that time frame.
The overall setup still isn’t particularly conducive to heightened activity in the tropical Atlantic until the last several days of August. Currently the CPAC is behaving as though a +PMM/+PDO/+ENSO were present, rather than the opposite. Also, the EPS has shown a tendency to be too fast with the progression of the MJO, while the CFSv2 has actually been performing better, at least within the short term. So the overall trends do not appear to favour the Atlantic for the next three weeks. Until then the TUTT will be extremely strong, owing in part to interference from the Pacific. Also, I’ll need to see much more sustained warming of the MDR before adopting a more bullish outlook.
0 likes
CVW / MiamiensisWx / Shell Mound
The posts in this forum are NOT official forecasts and should not be used as such. They are just the opinion of the poster and may or may not be backed by sound meteorological data. They are NOT endorsed by any professional institution or STORM2K. For official information, please refer to products from the NHC and NWS.
-
cycloneye
- Admin
- Posts: 149508
- Age: 69
- Joined: Thu Oct 10, 2002 10:54 am
- Location: San Juan, Puerto Rico
Re: 2021 Indicators: SST's / SAL / MSLP / Shear / Steering / Instability / Sat Images
1 likes
Visit the Caribbean-Central America Weather Thread where you can find at first post web cams,radars
and observations from Caribbean basin members Click Here
and observations from Caribbean basin members Click Here
-
Category5Kaiju
- Category 5
- Posts: 4334
- Joined: Thu Dec 24, 2020 12:45 pm
- Location: Seattle and Phoenix
Re: 2021 Indicators: SST's / SAL / MSLP / Shear / Steering / Instability / Sat Images
While by definition it was not "hyperactive" per se, 2008 imho did really seem like a hyperactive year; it produced 146 ACE when if I remember correctly the threshold for hyperactivity is around 153. With 4 Cat 4s and a major hurricane in every month between July and November, had, let's say, Ike been slightly longer lived and more powerful (and maybe throw in Gustav as well), 2008 could have very well exceeded the 153 ACE threshold and been a hyperactive year. In recent times, I think 2008 was the closest "above average" year that easily had hyperactive potential and could have really achieved that had some of its storms been slightly stronger or longer-lived with all else being equal.
3 likes
Unless explicitly stated, all info in my posts is based on my own opinions and observations. Tropical storms and hurricanes can be extremely dangerous. Refer to an accredited weather research agency or meteorologist if you need to make serious decisions regarding an approaching storm.
-
AlphaToOmega
- Category 5
- Posts: 1448
- Joined: Sat Jun 26, 2021 10:51 am
- Location: Somewhere in Massachusetts
Re: 2021 Indicators: SST's / SAL / MSLP / Shear / Steering / Instability / Sat Images
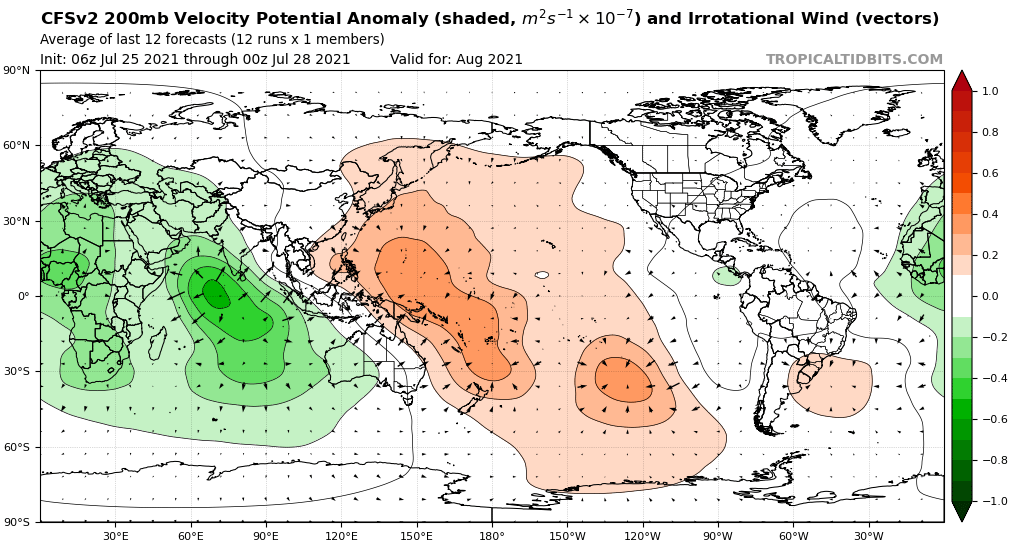
CFSv2, just like the CanSIPS and JMA, finally suggests a favorable pattern for August:
3 likes
-
Category5Kaiju
- Category 5
- Posts: 4334
- Joined: Thu Dec 24, 2020 12:45 pm
- Location: Seattle and Phoenix
Re: 2021 Indicators: SST's / SAL / MSLP / Shear / Steering / Instability / Sat Images
AlphaToOmega wrote:CFSv2, just like the CanSIPS and JMA, finally suggests a favorable pattern for August:
https://i.postimg.cc/P5mPZCZ0/cfs-mon-01-chi200-global-1.png
Looks like the WPAC is going to have some trouble generating some powerful typhoons should that verify. Lots of sinking motion over the basin
0 likes
Unless explicitly stated, all info in my posts is based on my own opinions and observations. Tropical storms and hurricanes can be extremely dangerous. Refer to an accredited weather research agency or meteorologist if you need to make serious decisions regarding an approaching storm.
-
Shell Mound
- Category 5
- Posts: 2432
- Age: 33
- Joined: Thu Sep 07, 2017 3:39 pm
- Location: St. Petersburg, FL → Scandinavia
Re: 2021 Indicators: SST's / SAL / MSLP / Shear / Steering / Instability / Sat Images
Category5Kaiju wrote:While by definition it was not "hyperactive" per se, 2008 imho did really seem like a hyperactive year; it produced 146 ACE when if I remember correctly the threshold for hyperactivity is around 153. With 4 Cat 4s and a major hurricane in every month between July and November, had, let's say, Ike been slightly longer lived and more powerful (and maybe throw in Gustav as well), 2008 could have very well exceeded the 153 ACE threshold and been a hyperactive year. In recent times, I think 2008 was the closest "above average" year that easily had hyperactive potential and could have really achieved that had some of its storms been slightly stronger or longer-lived with all else being equal.
As far as ACE is concerned, 2005, 2010, and 2020 all underperformed relative to SST, especially in the MDR. 2010 featured the warmest SST on record in the tropical Atlantic since the early 1980s, yet ended up with an ACE index of only 165 units. By contrast, 1996, 1999, 2003, and 2004 were comparatively cooler, yet ended up with higher ACE indices than 2010. Given their near-record-high SST, 2005 and 2020 also should have been expected to yield more ACE over the MDR than they actually did.
0 likes
CVW / MiamiensisWx / Shell Mound
The posts in this forum are NOT official forecasts and should not be used as such. They are just the opinion of the poster and may or may not be backed by sound meteorological data. They are NOT endorsed by any professional institution or STORM2K. For official information, please refer to products from the NHC and NWS.
-
Category5Kaiju
- Category 5
- Posts: 4334
- Joined: Thu Dec 24, 2020 12:45 pm
- Location: Seattle and Phoenix
Re: 2021 Indicators: SST's / SAL / MSLP / Shear / Steering / Instability / Sat Images
Shell Mound wrote:Category5Kaiju wrote:While by definition it was not "hyperactive" per se, 2008 imho did really seem like a hyperactive year; it produced 146 ACE when if I remember correctly the threshold for hyperactivity is around 153. With 4 Cat 4s and a major hurricane in every month between July and November, had, let's say, Ike been slightly longer lived and more powerful (and maybe throw in Gustav as well), 2008 could have very well exceeded the 153 ACE threshold and been a hyperactive year. In recent times, I think 2008 was the closest "above average" year that easily had hyperactive potential and could have really achieved that had some of its storms been slightly stronger or longer-lived with all else being equal.
As far as ACE is concerned, 2005, 2010, and 2020 all underperformed relative to SST, especially in the MDR. 2010 featured the warmest SST on record in the tropical Atlantic since the early 1980s, yet ended up with an ACE index of only 165 units. By contrast, 1996, 1999, 2003, and 2004 were comparatively cooler, yet ended up with higher ACE indices than 2010. Given their near-record-high SST, 2005 and 2020 also should have been expected to yield more ACE over the MDR than they actually did.
Interestingly enough, I've noticed this too; not entirely sure if it is a reasonable culprit, but something tells me that the massive dust outbreaks during the summer of last year and in 2005 may have contributed to mid-level dry air or something related in the MDR that hindered the existence of long-trackers. 2010 also had a mid-level dry air issue, but that still did not prevent storms like Danielle, Igor, or Earl from happening.
0 likes
Unless explicitly stated, all info in my posts is based on my own opinions and observations. Tropical storms and hurricanes can be extremely dangerous. Refer to an accredited weather research agency or meteorologist if you need to make serious decisions regarding an approaching storm.
-
CyclonicFury

- Category 5
- Posts: 2035
- Age: 27
- Joined: Sun Jul 02, 2017 12:32 pm
- Location: NC
- Contact:
Re: 2021 Indicators: SST's / SAL / MSLP / Shear / Steering / Instability / Sat Images
For some reason, despite a La Niña and warmer than normal MDR SSTs, the CFSv2 is predicting above-normal wind shear over the MDR and Caribbean for ASO.

3 likes
NCSU B.S. in Meteorology Class of 2021. Tropical weather blogger at http://www.cyclonicfury.com. My forecasts and thoughts are NOT official, for official forecasts please consult the National Hurricane Center.
-
SFLcane
- S2K Supporter
- Posts: 10281
- Age: 48
- Joined: Sat Jun 05, 2010 1:44 pm
- Location: Lake Worth Florida
Re: 2021 Indicators: SST's / SAL / MSLP / Shear / Steering / Instability / Sat Images
AlphaToOmega wrote:CFSv2, just like the CanSIPS and JMA, finally suggests a favorable pattern for August:
https://i.postimg.cc/P5mPZCZ0/cfs-mon-01-chi200-global-1.png
But!?
1 likes
Who is online
Users browsing this forum: Ulf and 137 guests