

https://twitter.com/wx_tiger/status/1424830485226737667
2021 Indicators: SST's / SAL / MSLP / Shear / Steering / Instability / Sat Images
Moderator: S2k Moderators
Forum rules

The posts in this forum are NOT official forecasts and should not be used as such. They are just the opinion of the poster and may or may not be backed by sound meteorological data. They are NOT endorsed by any professional institution or STORM2K. For official information, please refer to products from the National Hurricane Center and National Weather Service.
-
Keldeo1997
- Category 2

- Posts: 688
- Joined: Fri Oct 11, 2019 11:35 pm

-
IsabelaWeather
- Category 1

- Posts: 316
- Age: 36
- Joined: Tue Jul 07, 2020 7:29 am
- Location: Isabela, Puerto Rico
Re: 2021 Indicators: SST's / SAL / MSLP / Shear / Steering / Instability / Sat Images
AlphaToOmega wrote:https://i.postimg.cc/sDfjfn3K/cansips-chi200-Mean-month-global-1.png
https://i.postimg.cc/wx2zrhDN/cansips-chi200-global-1.png
https://i.postimg.cc/L6sSFnVb/cansips-chi200-global-2.png
https://i.postimg.cc/3JbT8YSJ/cansips-chi200-global-3.png
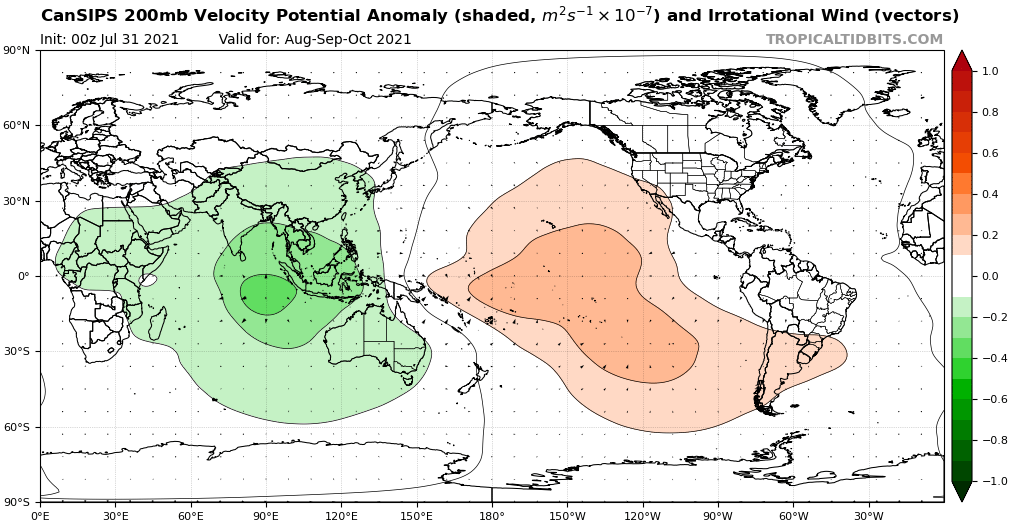
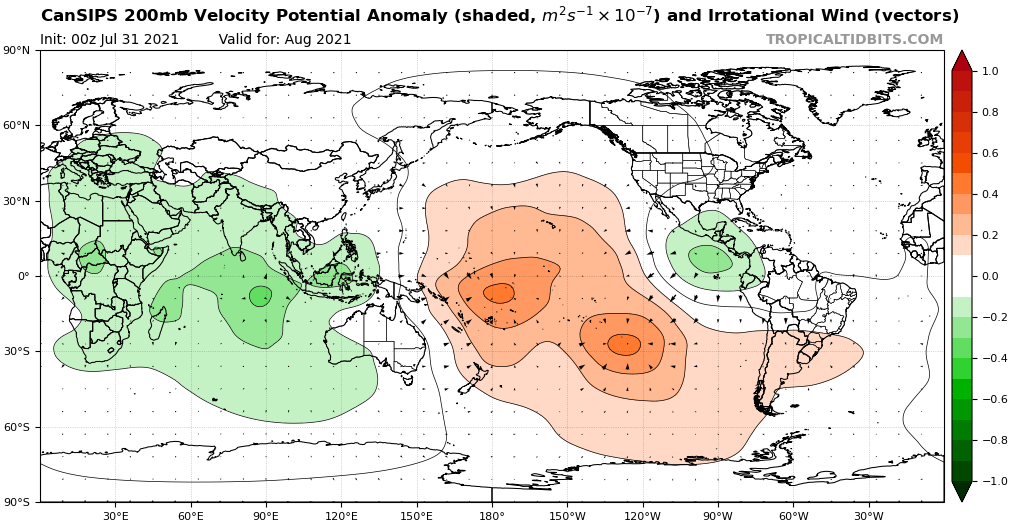
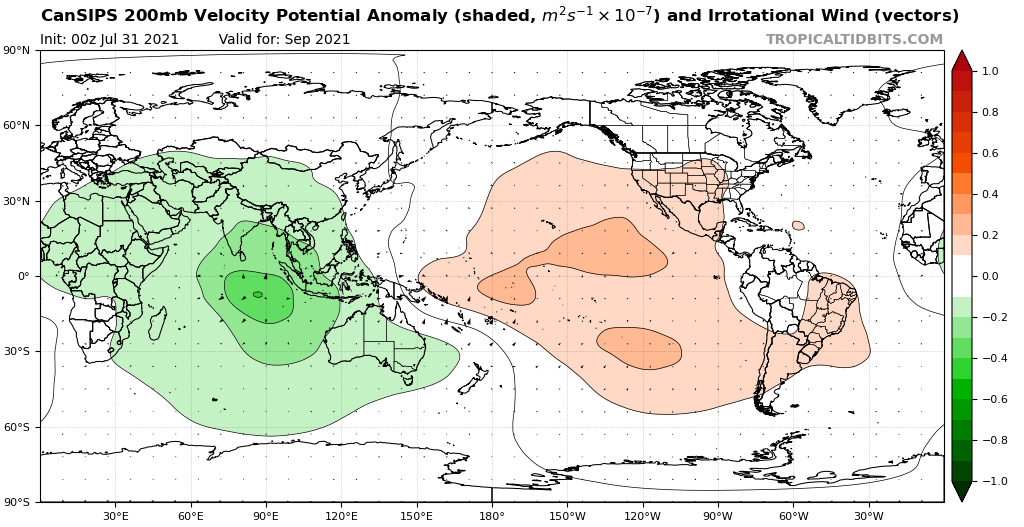
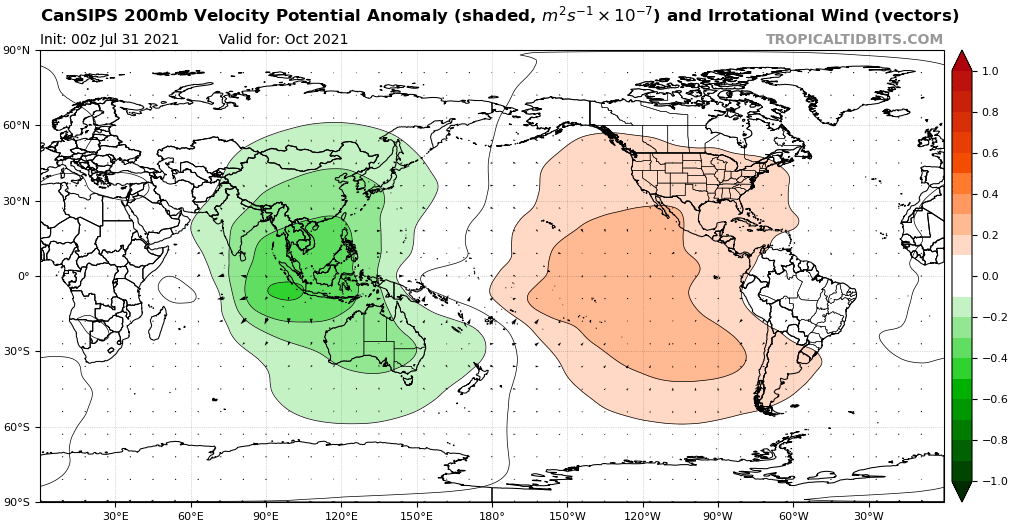
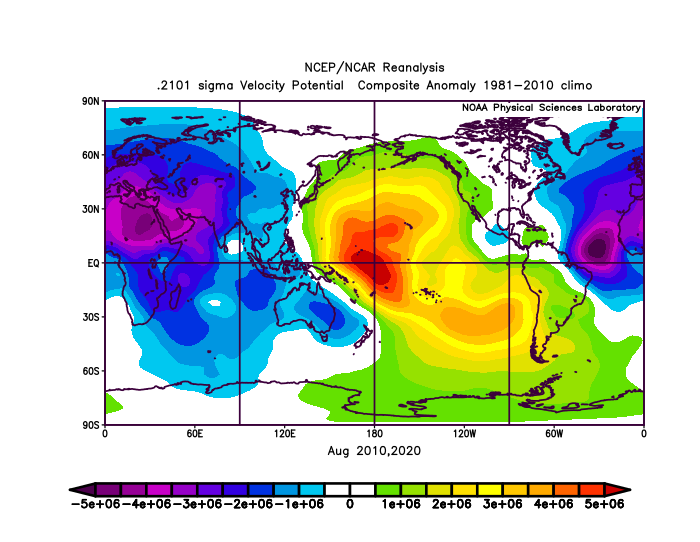
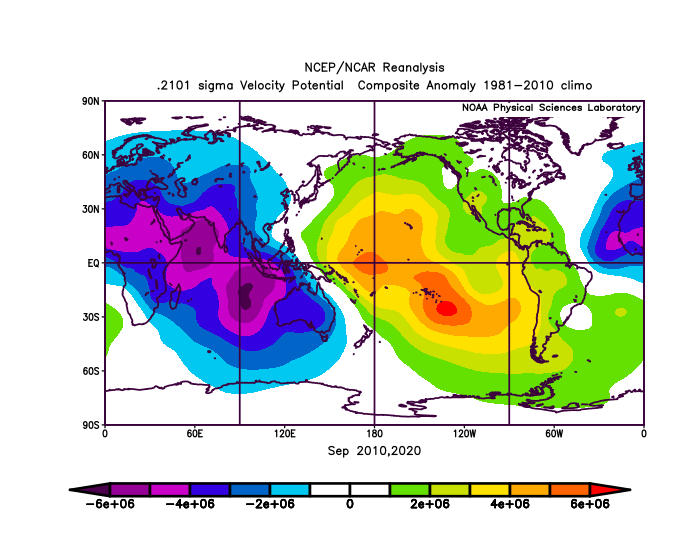
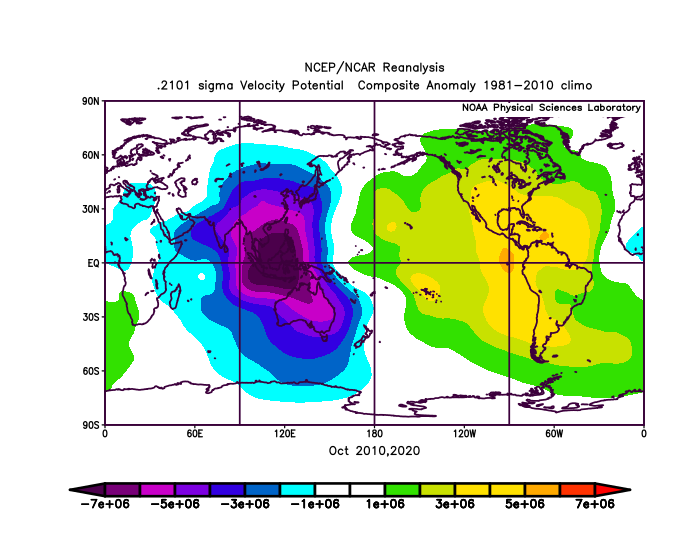
According to the CanSIPS model, the height to hurricane season activity might be in September/October. The -VP anomalies over the Indian Ocean and the Maritime Continent should greatly enhance tropical cyclogenesis. However, August will likely be decently active due to the -VP over Africa, the Indian Ocean, and the Maritime Content. In fact, these maps are nearly identical to the blended 2010 and 2020 VP anomaly maps, further supporting the idea that 2010 and 2020 are analog years for 2021.
https://i.postimg.cc/rFbYKmSs/Jcz-Zh-Z6-O-n.png
https://i.postimg.cc/3xvfpTBB/FYKNs-Mo1-R4.png
https://i.postimg.cc/25Nc7K9f/Cw-FAnz-WGfi.png
This means that peak season will likely be very active.
How come -VP over the indian ocean is bet for ATL? Just seems so far away, I'm a noob so Im just curious on the why.
1 likes
-
Category5Kaiju

- Category 5

- Posts: 4334
- Joined: Thu Dec 24, 2020 12:45 pm
- Location: Seattle and Phoenix
Re: 2021 Indicators: SST's / SAL / MSLP / Shear / Steering / Instability / Sat Images
IsabelaWeather wrote:AlphaToOmega wrote:https://i.postimg.cc/sDfjfn3K/cansips-chi200-Mean-month-global-1.png
https://i.postimg.cc/wx2zrhDN/cansips-chi200-global-1.png
https://i.postimg.cc/L6sSFnVb/cansips-chi200-global-2.png
https://i.postimg.cc/3JbT8YSJ/cansips-chi200-global-3.png
According to the CanSIPS model, the height to hurricane season activity might be in September/October. The -VP anomalies over the Indian Ocean and the Maritime Continent should greatly enhance tropical cyclogenesis. However, August will likely be decently active due to the -VP over Africa, the Indian Ocean, and the Maritime Content. In fact, these maps are nearly identical to the blended 2010 and 2020 VP anomaly maps, further supporting the idea that 2010 and 2020 are analog years for 2021.
https://i.postimg.cc/rFbYKmSs/Jcz-Zh-Z6-O-n.png
https://i.postimg.cc/3xvfpTBB/FYKNs-Mo1-R4.png
https://i.postimg.cc/25Nc7K9f/Cw-FAnz-WGfi.png
This means that peak season will likely be very active.
How come -VP over the indian ocean is bet for ATL? Just seems so far away, I'm a noob so Im just curious on the why.
Because it allows more and more vigorous tropical waves to be constantly generated from Eastern Africa, and they eventually can go on to become Atlantic storms. A -VP over the Americas would enhance Atlantic and EPAC competition, hurting the Atlantic as a result and hindering it from reaching its best potential.
8 likes
Unless explicitly stated, all info in my posts is based on my own opinions and observations. Tropical storms and hurricanes can be extremely dangerous. Refer to an accredited weather research agency or meteorologist if you need to make serious decisions regarding an approaching storm.
-
AlphaToOmega
- Category 5
- Posts: 1448
- Joined: Sat Jun 26, 2021 10:51 am
- Location: Somewhere in Massachusetts
Re: 2021 Indicators: SST's / SAL / MSLP / Shear / Steering / Instability / Sat Images
The AMO data for 2021 July has been released. During July 2021, the AMO was 0.22 C above-average. A ton of people were talking about a -AMO during July, yet the AMO remained positive.
https://psl.noaa.gov/data/correlation/amon.us.long.data
https://psl.noaa.gov/data/correlation/amon.us.long.data
1 likes
-
Shell Mound
- Category 5
- Posts: 2432
- Age: 33
- Joined: Thu Sep 07, 2017 3:39 pm
- Location: St. Petersburg, FL → Scandinavia
Re: 2021 Indicators: SST's / SAL / MSLP / Shear / Steering / Instability / Sat Images
SFLcane wrote:https://twitter.com/wx_tiger/status/1424830485226737667
If you read my dissertation (note: do not do this), you’ll find that cool phases of the Pacific Decadal Oscillation like the current one actually make mid-season Western Atlantic blocking of the kind favoring landfalls less likely. And, indeed, the historical Septembers with weak La Niñas and cold phase PDO tend to have a steering pattern close to the opposite of the averaged Florida landfall years, showing troughing over the east-central U.S., Central Atlantic ridging, and an open ocean escape route for Cape Verde hurricanes.
Source
0 likes
CVW / MiamiensisWx / Shell Mound
The posts in this forum are NOT official forecasts and should not be used as such. They are just the opinion of the poster and may or may not be backed by sound meteorological data. They are NOT endorsed by any professional institution or STORM2K. For official information, please refer to products from the NHC and NWS.
-
AlphaToOmega
- Category 5
- Posts: 1448
- Joined: Sat Jun 26, 2021 10:51 am
- Location: Somewhere in Massachusetts
Re: 2021 Indicators: SST's / SAL / MSLP / Shear / Steering / Instability / Sat Images
Also, the TNA was positive during July 2021.
https://psl.noaa.gov/data/correlation/tna.data
https://psl.noaa.gov/data/correlation/tna.data
0 likes
-
USTropics
- Professional-Met

- Posts: 2739
- Joined: Sun Aug 12, 2007 3:45 am
- Location: Florida State University
Re: 2021 Indicators: SST's / SAL / MSLP / Shear / Steering / Instability / Sat Images
Shell Mound wrote:SFLcane wrote:https://twitter.com/wx_tiger/status/1424830485226737667If you read my dissertation (note: do not do this), you’ll find that cool phases of the Pacific Decadal Oscillation like the current one actually make mid-season Western Atlantic blocking of the kind favoring landfalls less likely. And, indeed, the historical Septembers with weak La Niñas and cold phase PDO tend to have a steering pattern close to the opposite of the averaged Florida landfall years, showing troughing over the east-central U.S., Central Atlantic ridging, and an open ocean escape route for Cape Verde hurricanes.
Source
Not targeting Shell Mound here, I know he's just referring to the setup for September given the cool PDO/ENSO state. For those that didn't read the entire forecast though, just want to point out that segment was referring to September only. It could be misleading or misconstrued that there is no risk if you live in Florida this season. The proceeding paragraphs highlight a heightened risk in October for Florida, and to not let your guard down in any month due to the modest climatology skill in seasonal forecasting:
The flip side is that weak La Niña/cool PDO Octobers do tend to see high-latitude blocking develop over eastern North America. In fact, the weak La Niña/cool PDO October steering composite map is a close match for the steering currents observed in years in which Florida experienced a major hurricane in October, with ominously similar positioning of ridging and troughs.
Note that steering patterns are capricious, and landfall risk outlooks have very modest historical skill. Landfall risks are above normal for Florida in October, but only a fool would not be on guard for hurricane potential in August or September. Like Tetris, you never know what piece is going to show up next.
6 likes
-
Shell Mound
- Category 5
- Posts: 2432
- Age: 33
- Joined: Thu Sep 07, 2017 3:39 pm
- Location: St. Petersburg, FL → Scandinavia
Re: 2021 Indicators: SST's / SAL / MSLP / Shear / Steering / Instability / Sat Images
USTropics wrote:Shell Mound wrote:SFLcane wrote:https://twitter.com/wx_tiger/status/1424830485226737667If you read my dissertation (note: do not do this), you’ll find that cool phases of the Pacific Decadal Oscillation like the current one actually make mid-season Western Atlantic blocking of the kind favoring landfalls less likely. And, indeed, the historical Septembers with weak La Niñas and cold phase PDO tend to have a steering pattern close to the opposite of the averaged Florida landfall years, showing troughing over the east-central U.S., Central Atlantic ridging, and an open ocean escape route for Cape Verde hurricanes.
Source
Not targeting Shell Mound here, I know he's just referring to the setup for September given the cool PDO/ENSO state. For those that didn't read the entire forecast though, just want to point out that segment was referring to September only. It could be misleading or misconstrued that there is no risk if you live in Florida this season. The proceeding paragraphs highlight a heightened risk in October for Florida, and to not let your guard down in any month due to the modest climatology skill in seasonal forecasting:The flip side is that weak La Niña/cool PDO Octobers do tend to see high-latitude blocking develop over eastern North America. In fact, the weak La Niña/cool PDO October steering composite map is a close match for the steering currents observed in years in which Florida experienced a major hurricane in October, with ominously similar positioning of ridging and troughs.
Note that steering patterns are capricious, and landfall risk outlooks have very modest historical skill. Landfall risks are above normal for Florida in October, but only a fool would not be on guard for hurricane potential in August or September. Like Tetris, you never know what piece is going to show up next.

Since 1851 fifteen Category-4+ hurricanes have made landfall on the State of Florida. All but two occurred in either August or September and all but two developed initially in the MDR. The vast majority of Florida’s Category-4+ impacts have occurred in August or September and, especially in South(-east) Florida, have been associated with storms that initially formed in the MDR. King (1950) and Michael (2018) were exceptions that formed in the Caribbean in October and still managed to impact the State of Florida as Category-4+ cyclones. However, virtually all other Category-4+ impacts occurred in the months of August and September, including storms such as the 1919 Florida Keys hurricane, the 1926 Miami hurricane, the 1928 Okeechobee hurricane, the 1935 Labor Day hurricane, Donna (1960), and Andrew (1992). So WeatherTiger’s outlook does matter for Florida in terms of reducing the risk of the strongest landfalls.
1 likes
CVW / MiamiensisWx / Shell Mound
The posts in this forum are NOT official forecasts and should not be used as such. They are just the opinion of the poster and may or may not be backed by sound meteorological data. They are NOT endorsed by any professional institution or STORM2K. For official information, please refer to products from the NHC and NWS.

Re: 2021 Indicators: SST's / SAL / MSLP / Shear / Steering / Instability / Sat Images
Shell Mound wrote:USTropics wrote:Shell Mound wrote:
Source
Not targeting Shell Mound here, I know he's just referring to the setup for September given the cool PDO/ENSO state. For those that didn't read the entire forecast though, just want to point out that segment was referring to September only. It could be misleading or misconstrued that there is no risk if you live in Florida this season. The proceeding paragraphs highlight a heightened risk in October for Florida, and to not let your guard down in any month due to the modest climatology skill in seasonal forecasting:The flip side is that weak La Niña/cool PDO Octobers do tend to see high-latitude blocking develop over eastern North America. In fact, the weak La Niña/cool PDO October steering composite map is a close match for the steering currents observed in years in which Florida experienced a major hurricane in October, with ominously similar positioning of ridging and troughs.
Note that steering patterns are capricious, and landfall risk outlooks have very modest historical skill. Landfall risks are above normal for Florida in October, but only a fool would not be on guard for hurricane potential in August or September. Like Tetris, you never know what piece is going to show up next.
https://i.ibb.co/RYbzq5g/Ska-rmavbild-2021-08-10-kl-13-25-14.png
Since 1851 fifteen Category-4+ hurricanes have made landfall on the State of Florida. All but two occurred in either August or September and all but two developed initially in the MDR. The vast majority of Florida’s Category-4+ impacts have occurred in August or September and, especially in South(-east) Florida, have been associated with storms that initially formed in the MDR. King (1950) and Michael (2018) were exceptions that formed in the Caribbean in October and still managed to impact the State of Florida as Category-4+ cyclones. However, virtually all other Category-4+ impacts occurred in the months of August and September, including storms such as the 1919 Florida Keys hurricane, the 1926 Miami hurricane, the 1928 Okeechobee hurricane, the 1935 Labor Day hurricane, Donna (1960), and Andrew (1992). So WeatherTiger’s outlook does matter for Florida in terms of reducing the risk of the strongest landfalls.
Has this seen statistical analysis? 15 seems like a very small sample size to be ruling out chance factors.
Is there causation identified, or is this just correlation at this point?
3 likes
-
Category5Kaiju
- Category 5
- Posts: 4334
- Joined: Thu Dec 24, 2020 12:45 pm
- Location: Seattle and Phoenix
Re: 2021 Indicators: SST's / SAL / MSLP / Shear / Steering / Instability / Sat Images
SteveM wrote:Shell Mound wrote:USTropics wrote:
Not targeting Shell Mound here, I know he's just referring to the setup for September given the cool PDO/ENSO state. For those that didn't read the entire forecast though, just want to point out that segment was referring to September only. It could be misleading or misconstrued that there is no risk if you live in Florida this season. The proceeding paragraphs highlight a heightened risk in October for Florida, and to not let your guard down in any month due to the modest climatology skill in seasonal forecasting:
https://i.ibb.co/RYbzq5g/Ska-rmavbild-2021-08-10-kl-13-25-14.png
Since 1851 fifteen Category-4+ hurricanes have made landfall on the State of Florida. All but two occurred in either August or September and all but two developed initially in the MDR. The vast majority of Florida’s Category-4+ impacts have occurred in August or September and, especially in South(-east) Florida, have been associated with storms that initially formed in the MDR. King (1950) and Michael (2018) were exceptions that formed in the Caribbean in October and still managed to impact the State of Florida as Category-4+ cyclones. However, virtually all other Category-4+ impacts occurred in the months of August and September, including storms such as the 1919 Florida Keys hurricane, the 1926 Miami hurricane, the 1928 Okeechobee hurricane, the 1935 Labor Day hurricane, Donna (1960), and Andrew (1992). So WeatherTiger’s outlook does matter for Florida in terms of reducing the risk of the strongest landfalls.
Has this seen statistical analysis? 15 seems like a very small sample size to be ruling out chance factors.
Is there causation identified, or is this just correlation at this point?
^^ If this were a statistical study then unless there’s an associated p value of less than 0.05, I just don’t know how reliable or unflawed that observation would be; a sample size of n=15 is not a large number, and this could be compounded by changes in storm behavior over the years and other confounding factors that are very hard to control in this kind of setting
1 likes
Unless explicitly stated, all info in my posts is based on my own opinions and observations. Tropical storms and hurricanes can be extremely dangerous. Refer to an accredited weather research agency or meteorologist if you need to make serious decisions regarding an approaching storm.
Re: 2021 Indicators: SST's / SAL / MSLP / Shear / Steering / Instability / Sat Images
Landfalling cat 4 storms are thankfully rare in any circumstance. Setting the bar excessively high to push a desired narrative strikes me as...suspect. Sub cat 4 Katrina waves hello. As does sub cat 3 Ike. Weather Tiger's outlook was exceptional as usual.
5 likes
-
Shell Mound
- Category 5
- Posts: 2432
- Age: 33
- Joined: Thu Sep 07, 2017 3:39 pm
- Location: St. Petersburg, FL → Scandinavia
Re: 2021 Indicators: SST's / SAL / MSLP / Shear / Steering / Instability / Sat Images
psyclone wrote:Landfalling cat 4 storms are thankfully rare in any circumstance. Setting the bar excessively high to push a desired narrative strikes me as...suspect. Sub cat 4 Katrina waves hello. As does sub cat 3 Ike. Weather Tiger's outlook was exceptional as usual.
Some credible people disagree with the NHC’s downgrading Katrina to 110 kt at its initial landfall on Louisiana. Ike, on the other hand, was certainly a high-end Category 2 at landfall, as determined by MSW. Nevertheless, I still think that one can and should look at indicators to gauge the likelihood of a certain “ceiling” being established in regard to worst-case scenarios during the upcoming peak of the season. In this case the indicators suggest that a Category-4+ impact, while always rare, on (South) Florida might be even rarer this year than the long-term averages indicate, especially relative to those of an “average” above-average or “hyperactive” season.
1 likes
CVW / MiamiensisWx / Shell Mound
The posts in this forum are NOT official forecasts and should not be used as such. They are just the opinion of the poster and may or may not be backed by sound meteorological data. They are NOT endorsed by any professional institution or STORM2K. For official information, please refer to products from the NHC and NWS.
-
tolakram
- Admin

- Posts: 20186
- Age: 62
- Joined: Sun Aug 27, 2006 8:23 pm
- Location: Florence, KY (name is Mark)
Re: 2021 Indicators: SST's / SAL / MSLP / Shear / Steering / Instability / Sat Images
Shell Mound wrote:psyclone wrote:Landfalling cat 4 storms are thankfully rare in any circumstance. Setting the bar excessively high to push a desired narrative strikes me as...suspect. Sub cat 4 Katrina waves hello. As does sub cat 3 Ike. Weather Tiger's outlook was exceptional as usual.
Some credible people disagree with the NHC’s downgrading Katrina to 110 kt at its initial landfall on Louisiana. Ike, on the other hand, was certainly a high-end Category 2 at landfall, as determined by MSW. Nevertheless, I still think that one can and should look at indicators to gauge the likelihood of a certain “ceiling” being established in regard to worst-case scenarios during the upcoming peak of the season. In this case the indicators suggest that a Category-4+ impact, while always rare, on (South) Florida might be even rarer this year than the long-term averages indicate, especially relative to those of an “average” above-average or “hyperactive” season.
I do not think there is any way to reliably predict that AND show verification of that prediction. I'm not saying you shouldn't say it, but you know my concerns. We have people on here predicting everything and claiming to be correct when that prediction happens, even though there is no way to verify that the outcome was nothing more than a coincidence. In other words, if south Florida does not get hit by a large major hurricane this year will you be satisfied that your prediction and the methods used are correct?
8 likes
M a r k
- - - - -
Join us in chat: Storm2K Chatroom Invite. Android and IOS apps also available.
The posts in this forum are NOT official forecasts and should not be used as such. Posts are NOT endorsed by any professional institution or STORM2K.org. For official information and forecasts, please refer to NHC and NWS products.
-
Shell Mound
- Category 5
- Posts: 2432
- Age: 33
- Joined: Thu Sep 07, 2017 3:39 pm
- Location: St. Petersburg, FL → Scandinavia
Re: 2021 Indicators: SST's / SAL / MSLP / Shear / Steering / Instability / Sat Images
tolakram wrote:Shell Mound wrote:psyclone wrote:Landfalling cat 4 storms are thankfully rare in any circumstance. Setting the bar excessively high to push a desired narrative strikes me as...suspect. Sub cat 4 Katrina waves hello. As does sub cat 3 Ike. Weather Tiger's outlook was exceptional as usual.
Some credible people disagree with the NHC’s downgrading Katrina to 110 kt at its initial landfall on Louisiana. Ike, on the other hand, was certainly a high-end Category 2 at landfall, as determined by MSW. Nevertheless, I still think that one can and should look at indicators to gauge the likelihood of a certain “ceiling” being established in regard to worst-case scenarios during the upcoming peak of the season. In this case the indicators suggest that a Category-4+ impact, while always rare, on (South) Florida might be even rarer this year than the long-term averages indicate, especially relative to those of an “average” above-average or “hyperactive” season.
I do not think there is any way to reliably predict that AND show verification of that prediction. I'm not saying you shouldn't say it, but you know my concerns. We have people on here predicting everything and claiming to be correct when that prediction happens, even though there is no way to verify that the outcome was nothing more than a coincidence. In other words, if south Florida does not get hit by a large major hurricane this year will you be satisfied that your prediction and the methods used are correct?
I wouldn’t necessarily lend too much credence to the validity of my “methodology,” but I do enjoy sharing ideas and generating discussion.
Nevertheless, people should be prepared for the possibilities, regardless of seasonal forecasts. This goes for South Florida and elsewhere.
2 likes
CVW / MiamiensisWx / Shell Mound
The posts in this forum are NOT official forecasts and should not be used as such. They are just the opinion of the poster and may or may not be backed by sound meteorological data. They are NOT endorsed by any professional institution or STORM2K. For official information, please refer to products from the NHC and NWS.
-
AlphaToOmega
- Category 5
- Posts: 1448
- Joined: Sat Jun 26, 2021 10:51 am
- Location: Somewhere in Massachusetts
Re: 2021 Indicators: SST's / SAL / MSLP / Shear / Steering / Instability / Sat Images
After over a week of declining, both the 30-day and 90-day SOI indices have increased again. This is once again indicating higher pressures in Tahiti than in Darwin, which indicate easterly trade winds in the Pacific.
0 likes
-
Stormybajan
- Category 1
- Posts: 453
- Joined: Thu May 20, 2021 3:21 pm
- Location: Windward Islands
Re: 2021 Indicators: SST's / SAL / MSLP / Shear / Steering / Instability / Sat Images
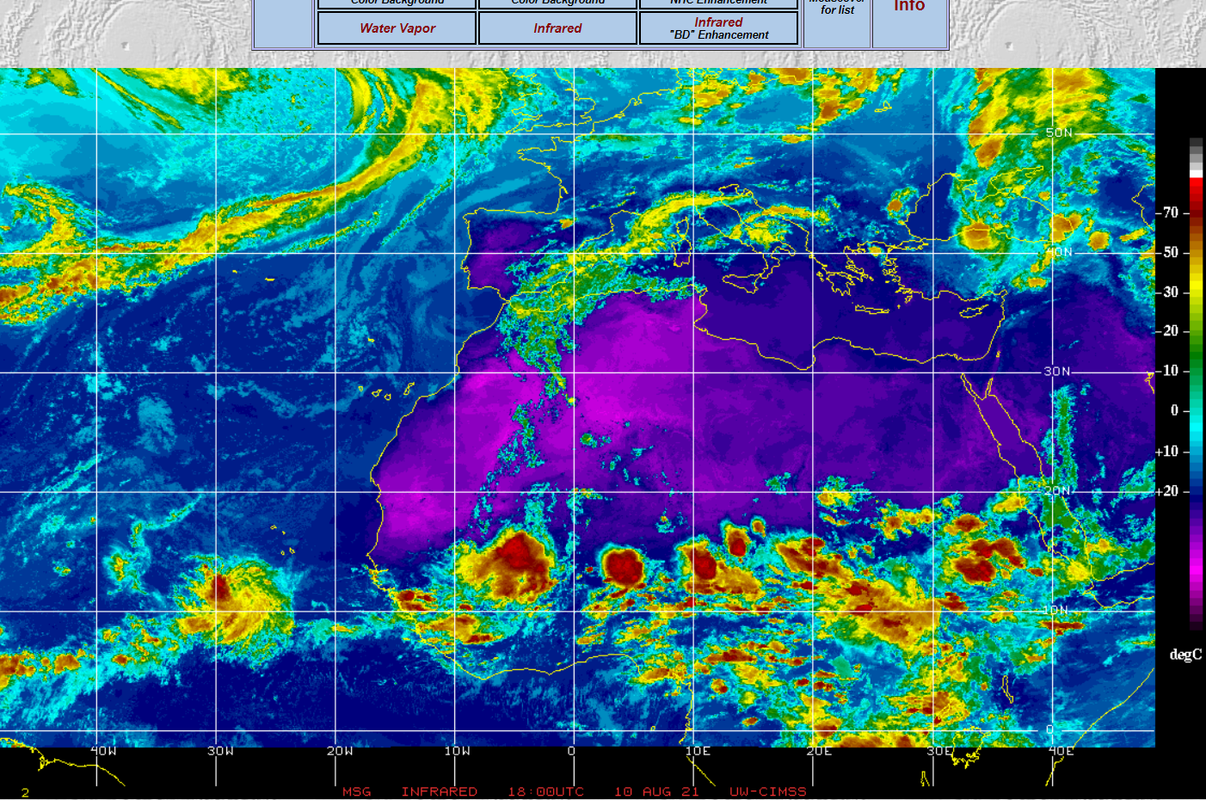
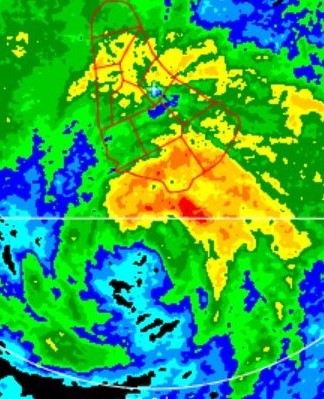
Looks like the convective phase of the MJO is finally kicking in!! Its a rainstorm basically over Africa right now, no wonder 95L looks so potent..
8 likes
Sad West Indies and Manchester United fan ⚽️
-
AlphaToOmega
- Category 5
- Posts: 1448
- Joined: Sat Jun 26, 2021 10:51 am
- Location: Somewhere in Massachusetts
Re: 2021 Indicators: SST's / SAL / MSLP / Shear / Steering / Instability / Sat Images
Back in May and June, there were many storms that developed in the subtropics: Ana, Bill, and Danny. Now all development seems to be tropical. I have one question: where is the subtropical development?  According to OISSTv2.1 analysis, the subtropics are 0.564 C above-average. Currently all development seems to be tropical.
0 likes
-
storminabox
- Category 1
- Posts: 263
- Joined: Sun Jul 09, 2017 10:50 pm
Re: 2021 Indicators: SST's / SAL / MSLP / Shear / Steering / Instability / Sat Images
Stormybajan wrote:https://i.postimg.cc/65Q6Wk21/EAtl-10aug21.png
Looks like the convective phase of the MJO is finally kicking in!! Its a rainstorm basically over Africa right now, no wonder 95L looks so potent..
It is almost go time.
0 likes
-
Category5Kaiju
- Category 5
- Posts: 4334
- Joined: Thu Dec 24, 2020 12:45 pm
- Location: Seattle and Phoenix
Re: 2021 Indicators: SST's / SAL / MSLP / Shear / Steering / Instability / Sat Images
Stormybajan wrote:https://i.postimg.cc/65Q6Wk21/EAtl-10aug21.png
Looks like the convective phase of the MJO is finally kicking in!! Its a rainstorm basically over Africa right now, no wonder 95L looks so potent..
WAM in action! Looks like there certainly will not be a lull later this month given that vigorous wave train.
0 likes
Unless explicitly stated, all info in my posts is based on my own opinions and observations. Tropical storms and hurricanes can be extremely dangerous. Refer to an accredited weather research agency or meteorologist if you need to make serious decisions regarding an approaching storm.
Who is online
Users browsing this forum: StPeteMike and 264 guests