

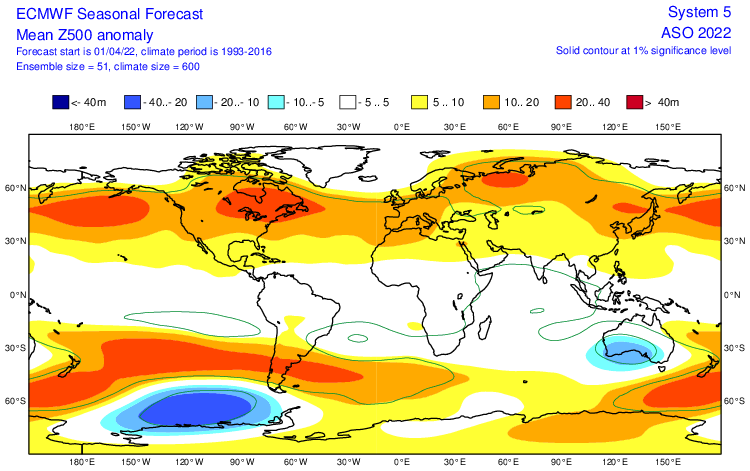
Caladesi wrote:AlphaToOmega wrote:Looking at the models and analogs, there are two seasons that seem like good steering analogs for 2022: 2005 and 2020. These two seasons both had the same SSTA pattern, had impacts in similar places (Louisiana and Central America), and had similar progressions. Looking at the ECMWF Z500 forecast, which actually verifies quite well for a field with very low skill, the pressure pattern for 2022 looks quite similar to that of 2005 and 2020 combined. In fact, the patterns are nearly identical: high pressure over NPac, low pressure over SPac, low pressure near Perth, high pressure over New Foundland, high pressure over European Russia, etc...
https://i.postimg.cc/52Hzhfkx/ps2png-worker-commands-dbd6fcf4b-52sbv-6fe5cac1a363ec1525f54343b6cc9fd8-Mv23r-V.png
https://i.postimg.cc/dtNdNh6H/y-Io-GSthk-Q.png
https://i.ibb.co/nr582J1/201621-ASO500mb.png
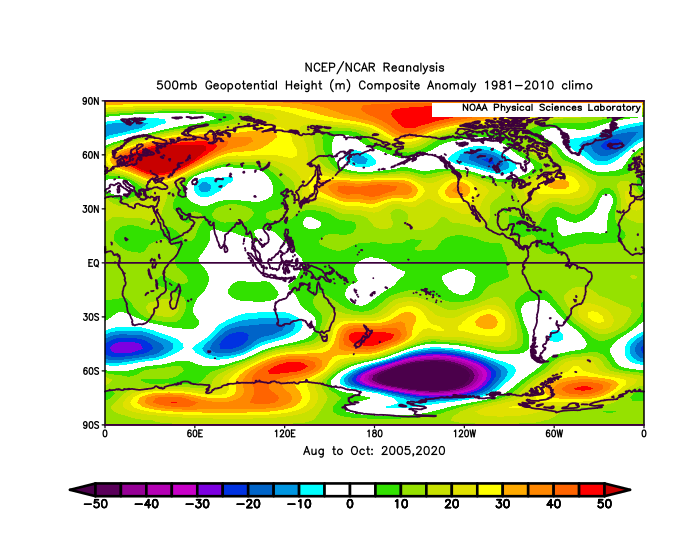
It is interesting to see how persistent this general setup has been since 2016: note the same basic configuration and positioning of ridges over the North (+EPO)/South Pacific, eastern Canada, Iberia, and so on. Also observe the persistent Icelandic low, along with the TUTT over the central Atlantic (=sinking air/below-average precipitation near the Leeward Islands). Some of these features seem to have become semi-permanent since 2016 and have dominated the peak months of ASO. On balance the setup has supported TC clusters over the easternmost MDR and in the western Caribbean and Gulf of Mexico, likely contributing in large part to the concentration of hurricanes along the U.S. Gulf Coast since 2016 (the landfalls on the Carolinas can be attributed to the influence of the TUTT + northward displacement of ridging + development outside the MDR):
https://i.ibb.co/xhph2Qx/Peninsular-Hurricanes.png
By contrast, several setups that yielded significant hurricane impacts on peninsular Florida tended to exclude the TUTT from the central Atlantic, coincided with lower heights in the deep tropics, and exhibited a pronounced southwestward extension of the ridge over eastern North America, along with overall westward displacement of the features that are present in 2016–21, e.g., the trough over western North America and the Iberian ridge, the latter of which is replaced by a mid-level low or weakness:
https://i.ibb.co/P4XY3q7/Ska-rmavbild-2022-04-05-kl-16-30-27.png
It seems that the warmer climate of recent decades, along with the subtropical warm pool off the East Coast, has contributed to the semi-permanent ridge/TUTT configuration that we have seen since 2016, and therefore has resulted in persistent “clustering” of hurricanes along the Gulf Coast, over Central America, and OTS. This kind of pattern seems to protect peninsular Florida for the most part while placing the Gulf Coast and Central America under threat, along with, to a lesser degree, the Carolinas (Outer Banks). Since 2016 the Gulf Coast has seen thirteen hurricane strikes, while peninsular Florida has seen just one and the East Coast four.
The Gulf Coast’s recent experience has mimicked that of peninsular Florida in the 1940s and that of the East Coast in the ‘50s.
wxman57 wrote:I was talking with Phil Klotzbach the other day. New data is even more bullish on seasonal activity, indicating ACE of 170-190. One think to look for is whether the current drought in TX/LA continues into July. That would be good for people there, as hurricane activity may shift east of Louisiana this year.
Wxman57’s latest post on the season
Well, this doesn’t sound like welcome news for Floridians...


