2022 Indicators (SSTs/SAL/MSLP/Shear/Steering/Instability) and >Day 16 Models

This is the general tropical discussion area. Anyone can take their shot at predicting a storms path.

Moderator: S2k Moderators

Forum rules

The posts in this forum are NOT official forecasts and should not be used as such. They are just the opinion of the poster and may or may not be backed by sound meteorological data. They are NOT endorsed by any professional institution or STORM2K. For official information, please refer to products from the National Hurricane Center and National Weather Service.

Help Support Storm2K
Message
Author
User avatar
Category5Kaiju
Category 5
Category 5
Posts: 4097
Joined: Thu Dec 24, 2020 12:45 pm
Location: Seattle

Re: 2022 indicators: SSTs / SAL / MSLP / shear / steering / instability / images

#561 Postby Category5Kaiju » Wed Apr 27, 2022 3:54 pm

SFLcane wrote:Part of the problem in my opinion last year was the ridging was so high latitude that it allowed troughing/shear underneath.The midlats are warm again globally so I kinda think we could see more of the same.

https://i.postimg.cc/prXKRmVd/xOVANieU.png


I wonder what years like 2005, 2008, or 2017 looked like in that regard, given those were high land impact, high quality seasons
0 likes   
Unless explicitly stated, all info in my posts is based on my own opinions and observations. Tropical storms and hurricanes can be extremely dangerous. Do not think you can beat Mother Nature. Refer to an accredited weather research agency or meteorologist if you need to make serious decisions regarding an approaching storm.

Monsoonjr99
Tropical Storm
Tropical Storm
Posts: 210
Age: 26
Joined: Fri Sep 21, 2018 11:22 pm
Location: Inland Empire, SoCal

Re: 2022 indicators: SSTs / SAL / MSLP / shear / steering / instability / images

#562 Postby Monsoonjr99 » Wed Apr 27, 2022 4:03 pm

IIRC it's mainly recurving typhoons that affect the mid-latitude circulation and thus CONUS wx and the NAtl.

An active WPac may have less affect on the Atlantic if typhoons are mainly tracking westward into the Philippines/SCS versus recurving tracks by Japan or OTS.
4 likes   
The posts in this forum are NOT official forecasts and should not be used as such. They are just the opinion of the poster and may or may not be backed by sound meteorological data. They are NOT endorsed by any professional institution or STORM2K. For official information, please refer to products from the NHC and NWS.

Some Californian who codes things and tracks weather.

Kay '22, Hilary '23

AlphaToOmega
Category 5
Category 5
Posts: 1448
Joined: Sat Jun 26, 2021 10:51 am
Location: Somewhere in Massachusetts

Re: 2022 indicators: SSTs / SAL / MSLP / shear / steering / instability / images

#563 Postby AlphaToOmega » Wed Apr 27, 2022 4:10 pm

SFLcane wrote:Part of the problem in my opinion last year was the ridging was so high latitude that it allowed troughing/shear underneath.The midlats are warm again globally so I kinda think we could see more of the same.

https://i.postimg.cc/prXKRmVd/xOVANieU.png


Interestingly, this pattern seems to be associated with Atlantic Nino years. Recent years that featured unusually warm waters in the Gulf of Guinea had this zonal wind pattern.

Image

Image

Image

Image
2 likes   

User avatar
Teban54
Category 5
Category 5
Posts: 3204
Joined: Sat May 19, 2018 1:19 pm

Re: 2022 indicators: SSTs / SAL / MSLP / shear / steering / instability / images

#564 Postby Teban54 » Wed Apr 27, 2022 4:20 pm

Here's an old post by USTropics in 2020 describing the modeled effects of Maysak and Haishen on the Atlantic:

USTropics wrote:Always love the WPAC teleconnections and how they impact large scale steering patterns over NA. Models show varying solutions, and I'll do my best to break down what exactly is occurring. First, here is a 48 hour forecast by the ECMWF showing our two typhoons in the WPAC. I've included some shrewd outlines of their eventual track (purple track is Maysak, blue track is Haishen).

https://i.imgur.com/WRGjkFJ.png

Now let's move out 48 hours in time (96 hour forecast), and we'll see Maysak has a weak signature here on the 500mb chart as it becomes extra tropical and begins to interact with the North Pacific jet stream. Essentially what we'll see is an amplification of the high pressure to the NE (labeled H1), which will then amplify the cutoff low towards the east (labeled L1). Haishen is also seen here as a potent Typhoon on the same trajectory as Maysak:

https://i.imgur.com/bMR77CR.png

Now let's move out 3 more days (144 hour forecast). We've had this trickle down effect, where H1 became pumped up, amplified L1, which is now creating a sort of Omega block pattern with the high pressure off the NW coast of the United States (labeled H2). We also have our longwave trough over the United states (labeled L2). In addition, we have Haishen repeating the process (circled in green) and this disturbance in the EPAC (circled in pink) that is just enough of a signature to prevent H2 from expanding much to the south:

https://i.imgur.com/ZPdpQoi.png

End result (168 hour forecast on the 00z ECMWF), a cutoff low forms (L2, green arrows show it cutting off) on the backend of the longwave trough, and a lot of this can be contributed to the presence of another high pressure area to the east (labeled H3). This is where model solutions really begin to vary, as the GFS has the entire longwave trough negatively tilting and rotating all the way down to the GOM before finally lifting out to the NE. Meanwhile, as you can see the ECMWF instead has a cutoff low that forms, and the longwave trough passes over the top of the high pressure area (H3):

https://i.imgur.com/yNrFSkr.png

As Crownweather stated, and in my personal experience, a cutoff low forming and diving towards the SW United States seems more realistic (we typically see a more chaotic weather pattern over NA and the EC when these typhoons recurve towards the east of Japan). Again this is a 7+ day forecast by all the models, so a lot will change before we end up with an actual solution.
2 likes   

mixedDanilo.E
Tropical Depression
Tropical Depression
Posts: 86
Joined: Sun Nov 21, 2021 8:00 am
Location: NY

Re: 2022 indicators: SSTs / SAL / MSLP / shear / steering / instability / images

#565 Postby mixedDanilo.E » Wed Apr 27, 2022 4:40 pm

[imgur] https://coralreefwatch.noaa.gov/data_cu ... urrent.png[/imgur]

Looking at the AMO in the Atlantic especially from the recent warming it be lookin sus now…
0 likes   

User avatar
InfernoFlameCat
Category 5
Category 5
Posts: 2102
Age: 22
Joined: Mon Dec 14, 2020 10:52 am
Location: Buford, GA

Re: 2022 indicators: SSTs / SAL / MSLP / shear / steering / instability / images

#566 Postby InfernoFlameCat » Wed Apr 27, 2022 5:25 pm

Shell Mound wrote:
Teban54 wrote:
aspen wrote:I’m expecting 2022 to have some unexpected limiting factor that becomes a major part of predictions for the following season. In 2020, it was an unusual typhoon-pumped TUTT during September (although that didn’t do anything to stop Oct-Nov). In 2021, it was a combo of unusual MJO-dependency and possibly the Atlantic Niño in Oct-Nov. Who knows what 2022 will bring. Triple-dip Ninas are already uncommon, and this will be the first season in the 2016-onwards active phase (which has behaved differently to 1995-2012) to take place during one.

By “limiting factor”, I mean hostile conditions that don’t stop the season from producing ridiculous NS numbers, but keeps down the quality of storms during certain parts of the year. If Maysak and Haishen never formed and recurved the way they did to enhance that TUTT, 2020 could’ve hit 200 ACE with Paulette and Rene becoming stronger, higher-ACE hurricanes. While the exact cause for 2021’s late-season slump is still kinda debated, whatever it was probably prevented an additional 10-20+ ACE from at least one Caribbean hurricane.

I remember one of the very casual, unscientific but nevertheless interesting ideas I've read from this forum earlier regarding 2010-13: it felt like the Atlantic was gradually "running out of steam", with each year being less impressive quality-wise. Some claimed this was due to the lack of an El Nino, which they say "recharges" the basin for subsequent years.

My own theory is that climate change has weakened and/or reversed the +AMO since 2010–13, but it’s an unpopular one on this site (I know, I am a contrarian :wink: ). Until we start seeing more hyperactive and/or quality-weighted seasons I will continue to argue that the -AMO has ended. Having a bunch of consecutive seasons basing much of their activity on marginal systems that wouldn’t have been classified a decade earlier does little to convince me that the +AMO is still around. Also, even if we are still in a +AMO, it means little for some areas if places such as metropolitan South Florida continue to dodge major bullets indefinitely.
How would an El Nino help recharge the Atlantic?
0 likes   
I am by no means a professional. DO NOT look at my forecasts for official information or make decisions based on what I post.

Goal: to become a registered expert over tropical and subtropical cyclones.

AlphaToOmega
Category 5
Category 5
Posts: 1448
Joined: Sat Jun 26, 2021 10:51 am
Location: Somewhere in Massachusetts

Re: 2022 indicators: SSTs / SAL / MSLP / shear / steering / instability / images

#567 Postby AlphaToOmega » Wed Apr 27, 2022 5:36 pm

MDR warming has halted today. MDR SSTAs have only increased by 0.007 C today, and the weak trade winds over the MDR are soon about to end momentarily. What happens next is still literally in the air.

Image
0 likes   

User avatar
skyline385
Category 5
Category 5
Posts: 2728
Age: 35
Joined: Wed Aug 26, 2020 11:15 pm
Location: Houston TX

Re: 2022 indicators: SSTs / SAL / MSLP / shear / steering / instability / images

#568 Postby skyline385 » Wed Apr 27, 2022 7:00 pm

Think people are a bit too focused on the MDR, meanwhile the Gulf and the Caribbean along with the western MDR is continuing to warm up which is probably a bigger issue cause
1) Hyperactive years like 2005 and 2020 did not have significant MDR runners
2) The Western Atlantic has been the hotspot for the past few seasons
3) Majority of the storms in June-July form in the Caribbean or near the Lesser Antilles moving into the Gulf and the hyperactive seasons see a good amount of activity in these months

Image
6 likes   

User avatar
toad strangler
S2K Supporter
S2K Supporter
Posts: 4543
Joined: Sun Jul 28, 2013 3:09 pm
Location: Earth
Contact:

Re: 2022 indicators: SSTs / SAL / MSLP / shear / steering / instability / images

#569 Postby toad strangler » Wed Apr 27, 2022 7:54 pm

Not a subscriber to MDR SST’s meaning much of anything either way this far out.
0 likes   

User avatar
cycloneye
Admin
Admin
Posts: 145308
Age: 68
Joined: Thu Oct 10, 2002 10:54 am
Location: San Juan, Puerto Rico

Re: 2022 indicators: SSTs / SAL / MSLP / shear / steering / instability / images

#570 Postby cycloneye » Wed Apr 27, 2022 8:09 pm

0 likes   
Visit the Caribbean-Central America Weather Thread where you can find at first post web cams,radars
and observations from Caribbean basin members Click Here

AlphaToOmega
Category 5
Category 5
Posts: 1448
Joined: Sat Jun 26, 2021 10:51 am
Location: Somewhere in Massachusetts

Re: 2022 indicators: SSTs / SAL / MSLP / shear / steering / instability / images

#571 Postby AlphaToOmega » Wed Apr 27, 2022 8:12 pm

toad strangler wrote:Not a subscriber to MDR SST’s meaning much of anything either way this far out.


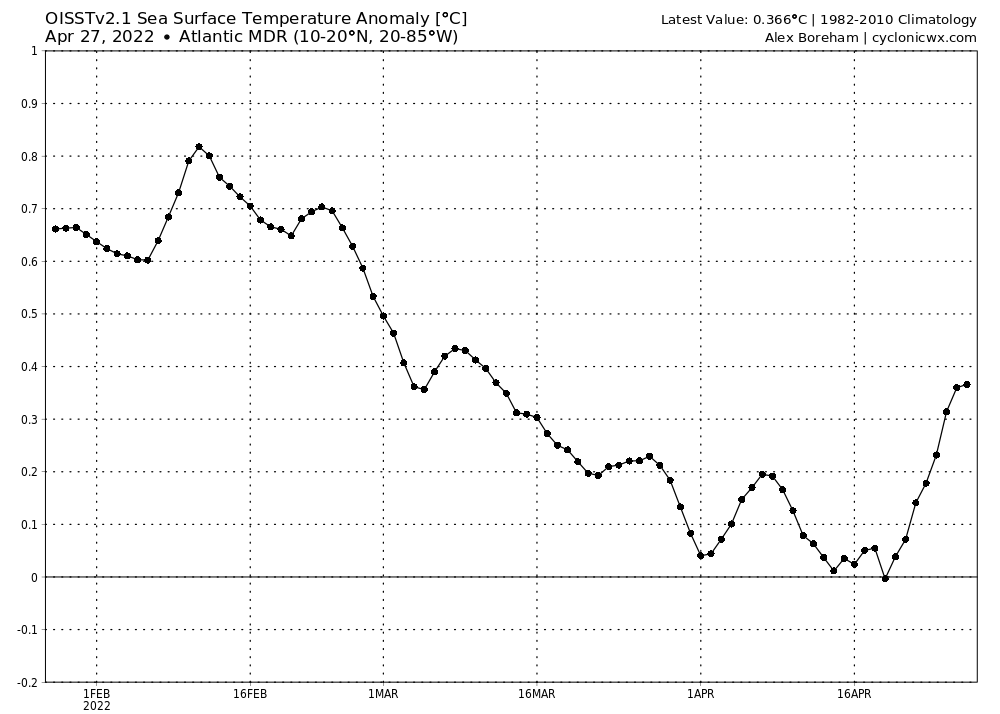
Not necessarily in April, but in May they could mean something. From May to September during the years of 2018, 2019, 2020, and 2021, the MDR has warmed by similar amounts: ~0.4 C. They will not tell us exactly how the MDR is going to be in September, but they can be a very crude indication. For instance, if, by some miracle, the MDR goes 0.5 C below-average during May, it is going to be extremely difficult for the MDR to be significantly above-average (above-average by > 0.5 C) by September. On the other hand, if the MDR is 0.6 C above-average during May, it is going to take a major reversal in patterns, especially with the strong WAM, to make the MDR near-average or below-average. Based on trends over the past decade, this is what we can say:

  1. If MDR SSTAs are greater than 0.4 C throughout May, they will be greater than 0.5 C throughout September.
  2. If MDR SSTAs are less than -0.2 C throughout May, they will be less than 0.5 C throughout September.
  3. If MDR SSTAs are between -0.2 C and 0.4 C throughout May, they can be either greater than 0.5 C or less than 0.5 C throughout September.

Obviously, a below-average MDR for May does not necessarily mean a below-average MDR for September and vice-versa, but at a certain point, the difference is too large to make up (when the MDR is > 0.2 C below-average), or the MDR would have to "go against the current (WAM)" (when the MDR is > 0.4 C above-average).
2 likes   

User avatar
NotSparta
Professional-Met
Professional-Met
Posts: 1669
Age: 23
Joined: Fri Aug 18, 2017 8:24 am
Location: Naples, FL
Contact:

Re: 2022 indicators: SSTs / SAL / MSLP / shear / steering / instability / images

#572 Postby NotSparta » Wed Apr 27, 2022 8:17 pm

skyline385 wrote:Think people are a bit too focused on the MDR, meanwhile the Gulf and the Caribbean along with the western MDR is continuing to warm up which is probably a bigger issue cause
1) Hyperactive years like 2005 and 2020 did not have significant MDR runners
2) The Western Atlantic has been the hotspot for the past few seasons
3) Majority of the storms in June-July form in the Caribbean or near the Lesser Antilles moving into the Gulf and the hyperactive seasons see a good amount of activity in these months

https://i.imgur.com/ymCVkrL.png


The Caribbean is a little underrated yeah but the activity there is correlated to the MDR. MDR is colder, typically that means the Caribbean is cooler too and either way there's less activity. Note that 2005 and 2020 had basically record warm MDRs. If it didn't matter at all then you'd probably see other years there too.

As for the Gulf it's basically a waste of time to really seriously look at its SSTAs. Way too variable and a warm Gulf doesn't really lead to more activity. The main effect of a warm Gulf in spring is people noting it and trying to drum up hype.

Of course the MDR isn't the only thing you should be watching right now but it's probably one of the best places to watch as early as April. A lot of the correlation to activity starts settling there once we get into hurricane season

That said of course you can get stuff popping up elsewhere, just when you're looking at something as broad as the entire season, the best bet for gauging impacts is how much activity is expected. There are exceptions (1992 and 2010) but generally that holds up. Worth noting that the chance of impacts from CSU in their forecasts is just climo multiplied by how active the season is expected to be relative to normal
10 likes   
This post was probably an opinion of mine, and in no way is official. Please refer to http://www.hurricanes.gov for official tropical analysis and advisories.

My website, with lots of tropical wx graphics, including satellite and recon: http://cyclonicwx.com

User avatar
Category5Kaiju
Category 5
Category 5
Posts: 4097
Joined: Thu Dec 24, 2020 12:45 pm
Location: Seattle

Re: 2022 indicators: SSTs / SAL / MSLP / shear / steering / instability / images

#573 Postby Category5Kaiju » Wed Apr 27, 2022 9:31 pm

NotSparta wrote:
skyline385 wrote:Think people are a bit too focused on the MDR, meanwhile the Gulf and the Caribbean along with the western MDR is continuing to warm up which is probably a bigger issue cause
1) Hyperactive years like 2005 and 2020 did not have significant MDR runners
2) The Western Atlantic has been the hotspot for the past few seasons
3) Majority of the storms in June-July form in the Caribbean or near the Lesser Antilles moving into the Gulf and the hyperactive seasons see a good amount of activity in these months

https://i.imgur.com/ymCVkrL.png


The Caribbean is a little underrated yeah but the activity there is correlated to the MDR. MDR is colder, typically that means the Caribbean is cooler too and either way there's less activity. Note that 2005 and 2020 had basically record warm MDRs. If it didn't matter at all then you'd probably see other years there too.

As for the Gulf it's basically a waste of time to really seriously look at its SSTAs. Way too variable and a warm Gulf doesn't really lead to more activity. The main effect of a warm Gulf in spring is people noting it and trying to drum up hype.

Of course the MDR isn't the only thing you should be watching right now but it's probably one of the best places to watch as early as April. A lot of the correlation to activity starts settling there once we get into hurricane season

That said of course you can get stuff popping up elsewhere, just when you're looking at something as broad as the entire season, the best bet for gauging impacts is how much activity is expected. There are exceptions (1992 and 2010) but generally that holds up. Worth noting that the chance of impacts from CSU in their forecasts is just climo multiplied by how active the season is expected to be relative to normal


With all this talk of the MDR, I am actually interested to ask this question: when we say "active MDR," does this include seasons where tropical storms frequently spawn in the MDR (like a season with many Lauras, Emilys, Andrews, etc.), or are we just referring to seasons where major hurricanes run rampant in that region (like a season with many Sams, Igors, Irmas, etc.)? I feel like "active MDR" could be interpreted in multiple ways.
1 likes   
Unless explicitly stated, all info in my posts is based on my own opinions and observations. Tropical storms and hurricanes can be extremely dangerous. Do not think you can beat Mother Nature. Refer to an accredited weather research agency or meteorologist if you need to make serious decisions regarding an approaching storm.

User avatar
cycloneye
Admin
Admin
Posts: 145308
Age: 68
Joined: Thu Oct 10, 2002 10:54 am
Location: San Juan, Puerto Rico

Re: 2022 indicators: SSTs / SAL / MSLP / shear / steering / instability / images

#574 Postby cycloneye » Thu Apr 28, 2022 7:36 am

1 likes   
Visit the Caribbean-Central America Weather Thread where you can find at first post web cams,radars
and observations from Caribbean basin members Click Here

User avatar
Category5Kaiju
Category 5
Category 5
Posts: 4097
Joined: Thu Dec 24, 2020 12:45 pm
Location: Seattle

Re: 2022 indicators: SSTs / SAL / MSLP / shear / steering / instability / images

#575 Postby Category5Kaiju » Thu Apr 28, 2022 7:45 am


Jeez, just by looking at what follows that trade surge I genuinely think that if that verifies, we will not see much of a cooldown due to the surge in the MDR but rather a short period of time where the MDR remains warm but does not rapidly warm up. That, of course, would then change after the first several days of May.

Also, I find it especially interesting how the subtropical warm pool has really been cooling. I wonder if that (assuming it lasts) could entail a season with more focus on deep tropical activity, unlike the past several years where subtropical activity was quite frequent
1 likes   
Unless explicitly stated, all info in my posts is based on my own opinions and observations. Tropical storms and hurricanes can be extremely dangerous. Do not think you can beat Mother Nature. Refer to an accredited weather research agency or meteorologist if you need to make serious decisions regarding an approaching storm.

User avatar
SFLcane
S2K Supporter
S2K Supporter
Posts: 10163
Age: 47
Joined: Sat Jun 05, 2010 1:44 pm
Location: Lake Worth Florida

Re: 2022 indicators: SSTs / SAL / MSLP / shear / steering / instability / images

#576 Postby SFLcane » Thu Apr 28, 2022 8:29 am

Category5Kaiju wrote:


Jeez, just by looking at what follows that trade surge I genuinely think that if that verifies, we will not see much of a cooldown due to the surge in the MDR but rather a short period of time where the MDR remains warm but does not rapidly warm up. That, of course, would then change after the first several days of May.

Also, I find it especially interesting how the subtropical warm pool has really been cooling. I wonder if that (assuming it lasts) could entail a season with more focus on deep tropical activity, unlike the past several years where subtropical activity was quite frequent


Yeah potentially it could if it keeps up.
1 likes   

User avatar
cycloneye
Admin
Admin
Posts: 145308
Age: 68
Joined: Thu Oct 10, 2002 10:54 am
Location: San Juan, Puerto Rico

Re: 2022 indicators: SSTs / SAL / MSLP / shear / steering / instability / images

#577 Postby cycloneye » Thu Apr 28, 2022 9:31 am

2 likes   
Visit the Caribbean-Central America Weather Thread where you can find at first post web cams,radars
and observations from Caribbean basin members Click Here

User avatar
aspen
Category 5
Category 5
Posts: 8818
Joined: Sat Oct 12, 2019 7:10 pm
Location: Connecticut, USA

Re: 2022 indicators: SSTs / SAL / MSLP / shear / steering / instability / images

#578 Postby aspen » Thu Apr 28, 2022 10:42 am

0 likes   
Irene '11 Sandy '12 Hermine '16 5/15/2018 Derecho Fay '20 Isaias '20 Elsa '21 Henri '21 Ida '21

I am only a meteorology enthusiast who knows a decent amount about tropical cyclones. Look to the professional mets, the NHC, or your local weather office for the best information.

User avatar
DorkyMcDorkface
Category 3
Category 3
Posts: 888
Age: 27
Joined: Mon Sep 30, 2019 1:32 pm
Location: Mid-Atlantic

Re: 2022 indicators: SSTs / SAL / MSLP / shear / steering / instability / images

#579 Postby DorkyMcDorkface » Thu Apr 28, 2022 10:46 am

Within a week's time we have gone from this:
Image

To this:
Image
A much more favorable configuration.

Here's the overall trend over the last two weeks:
Image
9 likes   
Please note the thougths expressed by this account are solely those of the user and are from a hobbyist perspective. For more comprehensive analysis, consult an actual professional meteorologist or meteorology agency.


Floyd 1999 | Isabel 2003 | Hanna 2008 | Irene 2011 | Sandy 2012 | Isaias 2020

hurricane2025
Tropical Storm
Tropical Storm
Posts: 208
Joined: Thu Apr 08, 2021 10:36 am

Re: 2022 indicators: SSTs / SAL / MSLP / shear / steering / instability / images

#580 Postby hurricane2025 » Thu Apr 28, 2022 11:44 am

Gut feeling upper texas coast will get nailed this year
0 likes   


Return to “Talkin' Tropics”

Who is online

Users browsing this forum: abajan, duilaslol, Ulf and 50 guests