#593 Postby Category5Kaiju » Sat Apr 30, 2022 11:34 pm
The 2008 comparisons being brought up are quite interesting, and mildly concerning to an extent. 2008 was the last season to feature a major hurricane in July, and while it was not operationally hyperactive, it could have very well been so had it had slightly more total named storms or longer-lasting/more powerful storms (for instance, if Gustav or Ike even briefly became a Cat 5, that would have driven 2008's ACE easily up to the hyperactive threshold). But what really intrigues me is how that was a ripe year for multiple severe land impacts, much like 2004, 2005, and 2017.
If 2022 adopts a sst anomaly configuration like 2008, that may not be a good sign. Things can change though, so I'm staying tuned.
*also, question for the experts/folks into hurricane history, but didn't 2008 also have record low shear in the Caribbean in the early hurricane season months? I remember hearing something like that, though I am not sure if that is true
Last edited by
Category5Kaiju on Sat Apr 30, 2022 11:36 pm, edited 1 time in total.
1 likes
Unless explicitly stated, all info in my posts is based on my own opinions and observations. Tropical storms and hurricanes can be extremely dangerous. Refer to an accredited weather research agency or meteorologist if you need to make serious decisions regarding an approaching storm.


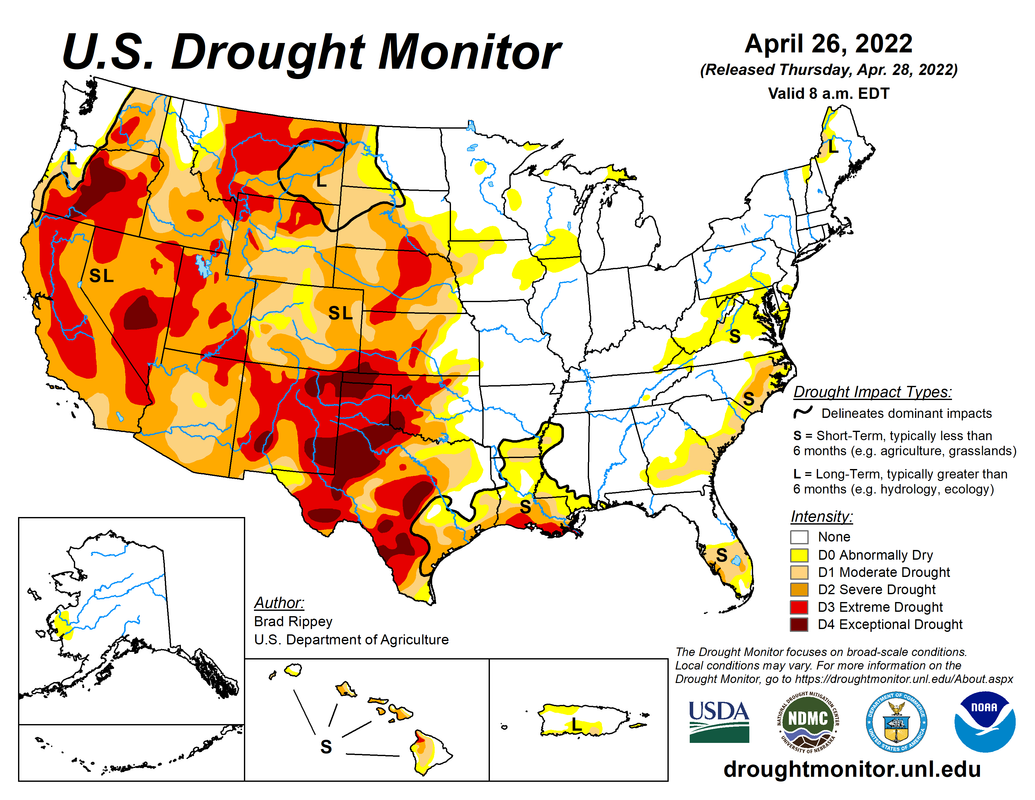


 This is what I dont want to see happening looking from Puerto Rico.
