The posts in this forum are NOT official forecasts and should not be used as such. They are just the opinion of the poster and may or may not be backed by sound meteorological data. They are NOT endorsed by any professional institution or STORM2K. For official information, please refer to products from the National Hurricane Center and National Weather Service.
Category5Kaiju wrote:How the heck is the EPAC expected to be that active while the Atlantic and even the WPAC remain suppressed (let alone in a third year La Niña and with the EPAC sst anomalies not glaringly warm) is my question lol
Guess it's the low-lat wave track maybe? EPAC will probably quiet down at some point though
Well I figure that at some point, the EPAC is going to inevitably die down and struggle; as we are seeing with Estelle (which at one point was supposed to become a major hurricane), it is clearly fighting La Nina-induced shear and dry air, and I would have to imagine that later on in the season (especially as we move into August), the EPAC is going to have to endure harsher conditions, with this La Nina base state clearly not going away anytime soon. It's climatology and the general rules of La Nina forcing that make me want to believe that the EPAC can't conceivably keep generating major storms and activity while suppressing the Atlantic.
It's also quite interesting how the WPAC is supposed to have a rather decent below average % chance of storms in that map you posted but the EPAC has above average. That's interesting to say the least; even in La Nina years, typically the WPAC gets more activity than the EPAC
1 likes
Unless explicitly stated, all information in my posts is based on my own opinions and observations. Tropical storms and hurricanes can be extremely dangerous. Refer to an accredited weather research agency or meteorologist if you need to make serious decisions regarding an approaching storm.
I understand to an extent that there may be a push to lower numbers, but we should keep some things in mind:
1. It is not unusual for early and mid-August to be slow. 2. The bell at CSU is rung on August 20th, not August 1st. 3. Models sometimes overextend patterns. 4. The average 5th EPAC storm forms on July 23rd. We are only 5 days ahead of schedule. The average 6th storm forms on August 3rd and 7th is August 11. 5. The average first Atlantic hurricane does not form until August 11. The average first major is September 1.
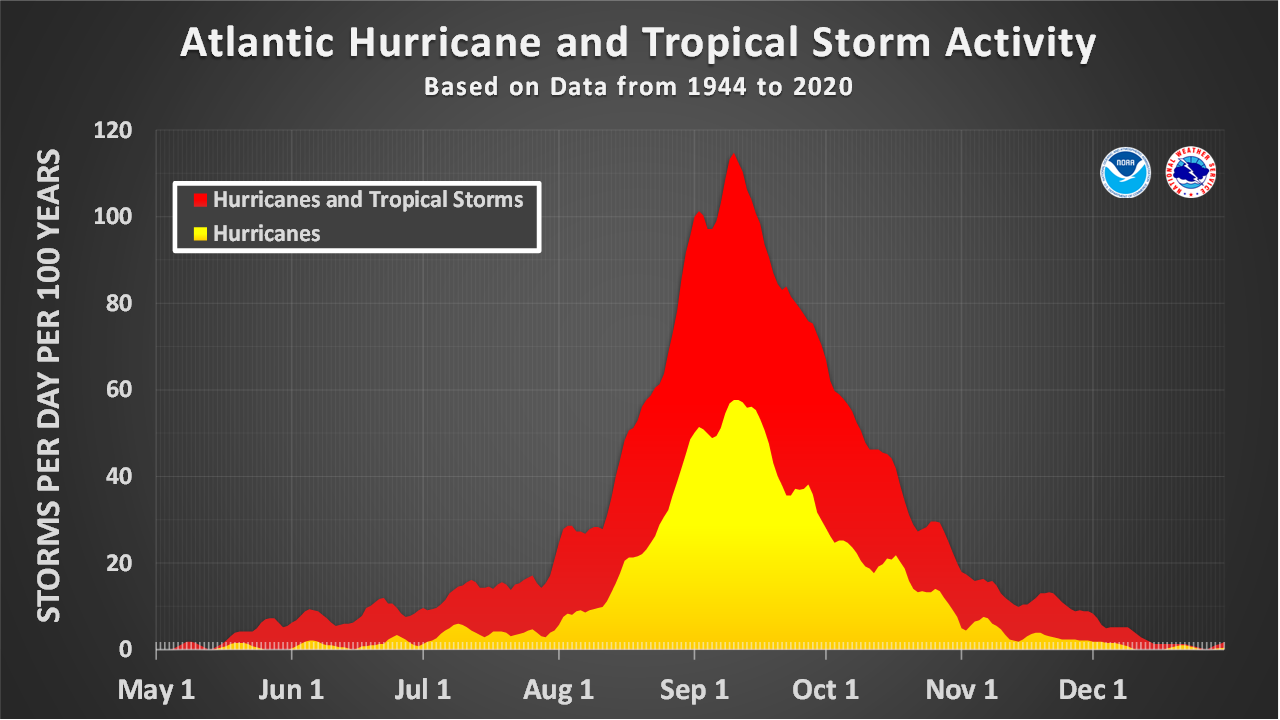
Here are some graphs from NOAA showing when we see upticks in seasonal activity:
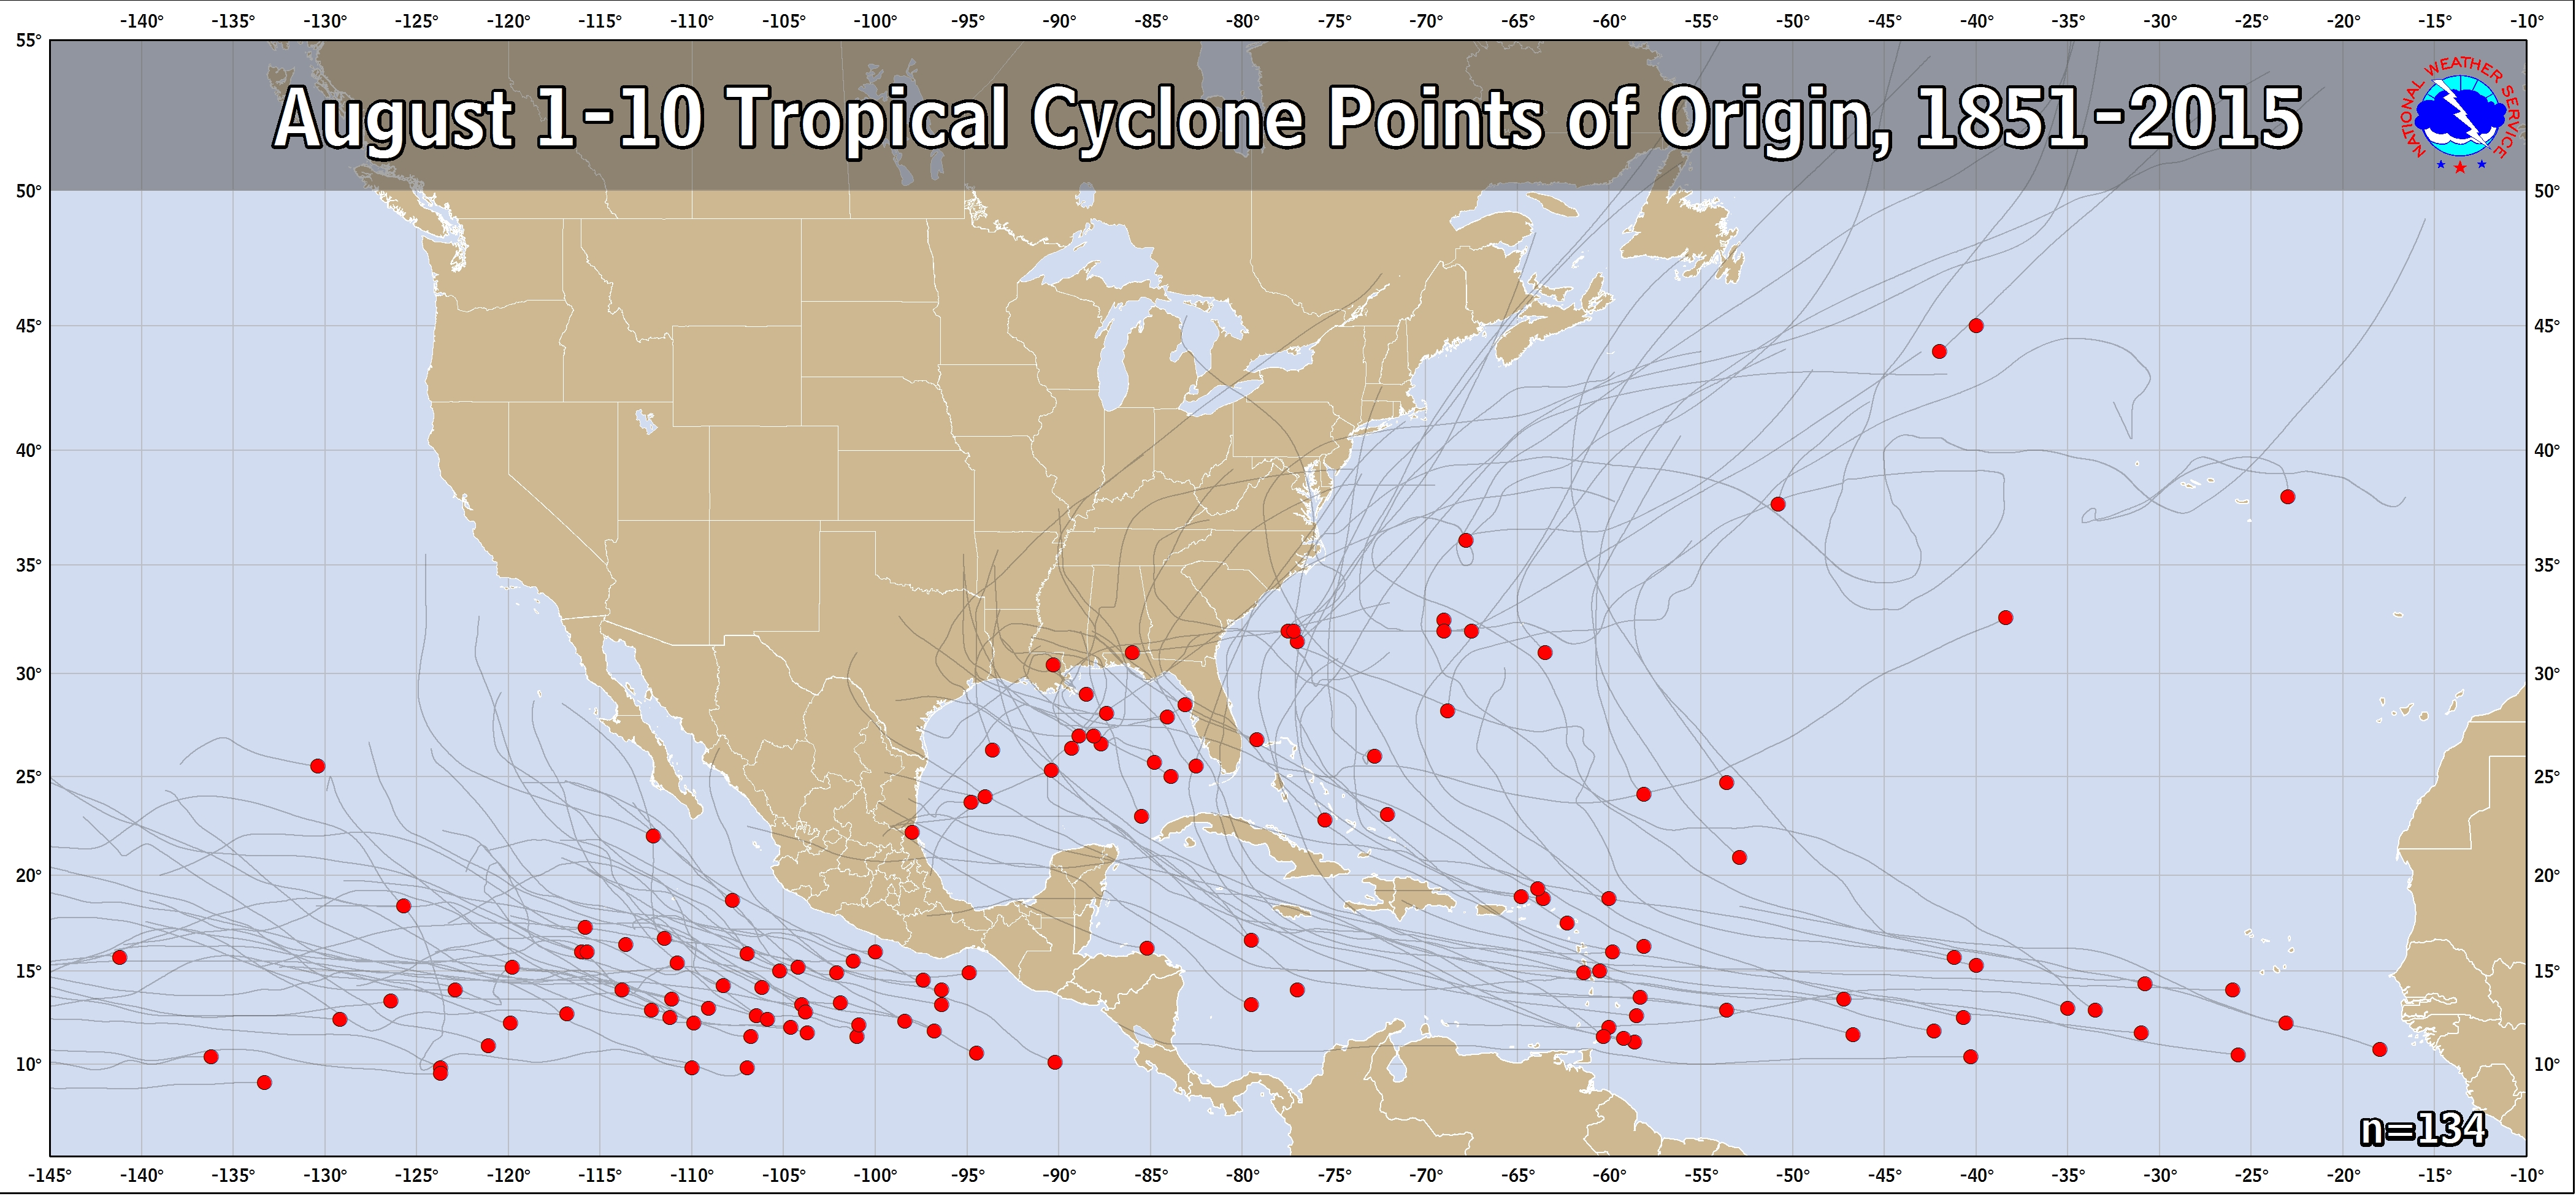
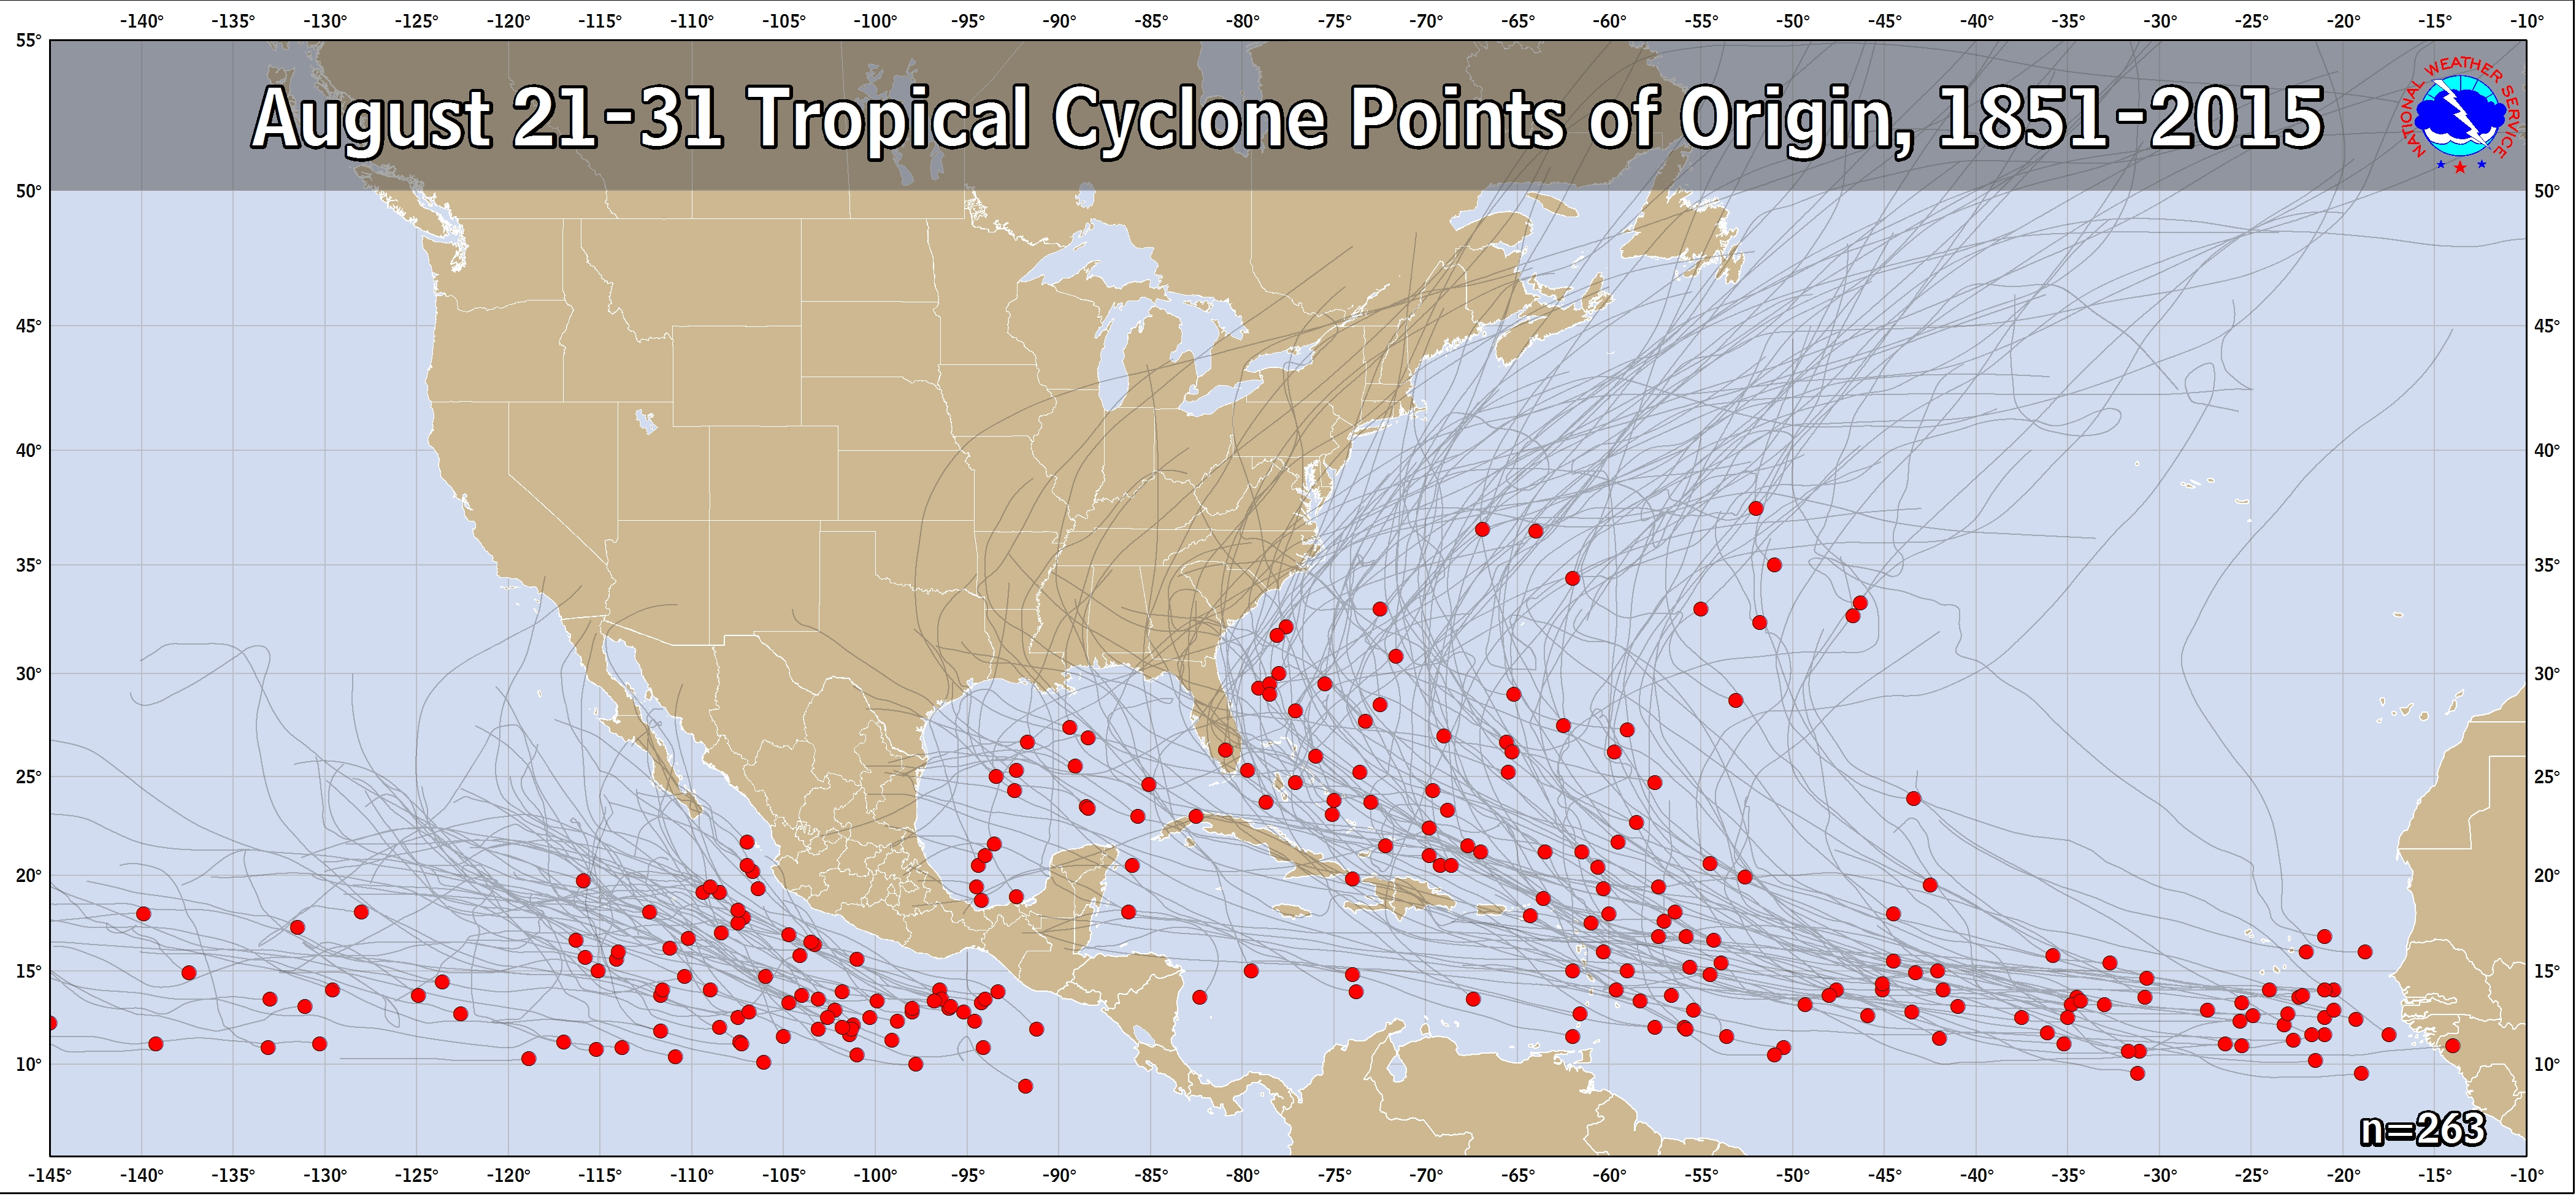
Notice just how many more TCs form in the August 21-31 period compared to August 1-10. Given this information, it is clear that the highest activity occurs later in August. Too often we get mixed signals about what to expect for next month, but I believe this is partly due to the rapid changes that occur in this period. One thing is certain--we will know much more around August 20th about the season than we do now.
captainbarbossa19 wrote:I understand to an extent that there may be a push to lower numbers, but we should keep some things in mind:
1. It is not unusual for early and mid-August to be slow. 2. The bell at CSU is rung on August 20th, not August 1st. 3. Models sometimes overextend patterns. 4. The average 5th EPAC storm forms on July 23rd. We are only 5 days ahead of schedule. The average 6th storm forms on August 3rd and 7th is August 11. 5. The average first Atlantic hurricane does not form until August 11. The average first major is September 1.
Notice just how many more TCs form in the August 21-31 period compared to August 1-10. Given this information, it is clear that the highest activity occurs later in August. Too often we get mixed signals about what to expect for next month, but I believe this is partly due to the rapid changes that occur in this period. One thing is certain--we will know much more around August 20th about the season than we do now.
I personally would not be shocked if the NS total prediction drops a bit (probably not like 19+ but rather 16-18, for example), but on the other hand, NS total does not mean anything if we still get like 8 hurricanes and 5 major hurricanes and with some of those hurricanes hitting land. I still do not see any conceivable reason why the peak months would feature less hurricanes and major hurricanes than predicted earlier; conditions seem to look to be generally favorable most likely
Last edited by Category5Kaiju on Mon Jul 18, 2022 3:49 pm, edited 1 time in total.
1 likes
Unless explicitly stated, all information in my posts is based on my own opinions and observations. Tropical storms and hurricanes can be extremely dangerous. Refer to an accredited weather research agency or meteorologist if you need to make serious decisions regarding an approaching storm.
Category5Kaiju wrote:How the heck is the EPAC expected to be that active while the Atlantic and even the WPAC remain suppressed (let alone in a third year La Niña and with the EPAC sst anomalies not glaringly warm) is my question lol
Guess it's the low-lat wave track maybe? EPAC will probably quiet down at some point though
Well I figure that at some point, the EPAC is going to inevitably die down and struggle; as we are seeing with Estelle (which at one point was supposed to become a major hurricane), it is clearly fighting La Nina-induced shear and dry air, and I would have to imagine that later on in the season (especially as we move into August), the EPAC is going to have to endure harsher conditions, with this La Nina base state clearly not going away anytime soon. It's climatology and the general rules of La Nina forcing that make me want to believe that the EPAC can't conceivably keep generating major storms and activity while suppressing the Atlantic.
It's also quite interesting how the WPAC is supposed to have a rather decent below average % chance of storms in that map you posted but the EPAC has above average. That's interesting to say the least; even in La Nina years, typically the WPAC gets more activity than the EPAC
You have to remember the Pacific is a huge basin/Ocean. There are some relationships but forcing isn't always black and white (one basin active others must be inactive etc etc). So far rising motion has been pretty good over Central America and they mature in the EPAC in what is a tame globe overall. This could easily be different if they had more time on the Atlantic side of the Carib. Perhaps South America/Central America is acting as a seed for waves just as Africa does and is favored there currently. Much is not understood about the southern hemisphere's oscillations since it is often a backstory to the NHEM.
0 likes
The above post and any post by Ntxw is NOT an official forecast and should not be used as such. It is just the opinion of the poster and may or may not be backed by sound meteorological data. It is NOT endorsed by any professional institution including Storm2k. For official information, please refer to NWS products.
Category5Kaiju wrote:How the heck is the EPAC expected to be that active while the Atlantic and even the WPAC remain suppressed (let alone in a third year La Niña and with the EPAC sst anomalies not glaringly warm) is my question lol
Guess it's the low-lat wave track maybe? EPAC will probably quiet down at some point though
Well I figure that at some point, the EPAC is going to inevitably die down and struggle; as we are seeing with Estelle (which at one point was supposed to become a major hurricane), it is clearly fighting La Nina-induced shear and dry air, and I would have to imagine that later on in the season (especially as we move into August), the EPAC is going to have to endure harsher conditions, with this La Nina base state clearly not going away anytime soon. It's climatology and the general rules of La Nina forcing that make me want to believe that the EPAC can't conceivably keep generating major storms and activity while suppressing the Atlantic.
It's also quite interesting how the WPAC is supposed to have a rather decent below average % chance of storms in that map you posted but the EPAC has above average. That's interesting to say the least; even in La Nina years, typically the WPAC gets more activity than the EPAC
Just an unusual year. We knew that. 3rd year -ENSO is rare and so far the signs aren't too great for the ATL.
This excessive ridging problem the Euro is showing for August has been in place ever since last October. If it persists, then deep tropics activity during ASO could be lower than currently forecast. It’s starting to feel more and more probable that a forecast bust season is coming.
The CFS has been flip-flopping a lot. Some runs show over half a dozen MDR systems and some long-tracking majors during August/September, other runs barely show any storms after August 20th with extended periods of inactivity in September.
I am only a meteorology enthusiast who knows a decent amount about tropical cyclones. Look to the professional mets, the NHC, or your local weather office for the best information.
captainbarbossa19 wrote:I understand to an extent that there may be a push to lower numbers, but we should keep some things in mind:
1. It is not unusual for early and mid-August to be slow. 2. The bell at CSU is rung on August 20th, not August 1st. 3. Models sometimes overextend patterns. 4. The average 5th EPAC storm forms on July 23rd. We are only 5 days ahead of schedule. The average 6th storm forms on August 3rd and 7th is August 11. 5. The average first Atlantic hurricane does not form until August 11. The average first major is September 1.
Notice just how many more TCs form in the August 21-31 period compared to August 1-10. Given this information, it is clear that the highest activity occurs later in August. Too often we get mixed signals about what to expect for next month, but I believe this is partly due to the rapid changes that occur in this period. One thing is certain--we will know much more around August 20th about the season than we do now.
Well put. I think a lot of people forget just how short of a period the Atlantic peak is compared to other basins. Quiet Julys (and even early August to an extent) aren't all that uncommon even in the busiest seasons. With that being said, however, I am starting to express skepticism towards a truly upper-echelon season. Hyperactive is still in play imo but on the lower end. If I were to guess, I think a range between 145-165 ACE is perhaps most reasonable to expect as of right now. I think it's a guarantee however that NS totals will likely be lower this year compared to 2020 and 2021 because we don't have the subtropical warmth this time around to spam "shortie" slop.
7 likes
Please note the thoughts expressed by this account are solely those of the user and are from a hobbyist perspective. For more comprehensive analysis, consult an actual professional meteorologist or meteorological agency.
aspen wrote:This excessive ridging problem the Euro is showing for August has been in place ever since last October. If it persists, then deep tropics activity during ASO could be lower than currently forecast. It’s starting to feel more and more probable that a forecast bust season is coming.
The CFS has been flip-flopping a lot. Some runs show over half a dozen MDR systems and some long-tracking majors during August/September, other runs barely show any storms after August 20th with extended periods of inactivity in September.
But this then begs the question, is this ridge record breaking in strength? Or maybe the question we should ask is, how does this ridge compare to other very active seasons such as 2004, 2005, 2010, and 2017 early on? Or perhaps our analog years of 1989, 1996, 1998, 1999, and 2011? Is it that unusual?
1 likes
Unless explicitly stated, all information in my posts is based on my own opinions and observations. Tropical storms and hurricanes can be extremely dangerous. Refer to an accredited weather research agency or meteorologist if you need to make serious decisions regarding an approaching storm.
aspen wrote:This excessive ridging problem the Euro is showing for August has been in place ever since last October. If it persists, then deep tropics activity during ASO could be lower than currently forecast. It’s starting to feel more and more probable that a forecast bust season is coming.
The CFS has been flip-flopping a lot. Some runs show over half a dozen MDR systems and some long-tracking majors during August/September, other runs barely show any storms after August 20th with extended periods of inactivity in September.
Next month’s SEAS5 forecast is going to be very interesting imo
I am only a meteorology enthusiast who knows a decent amount about tropical cyclones. Look to the professional mets, the NHC, or your local weather office for the best information.
aspen wrote:This excessive ridging problem the Euro is showing for August has been in place ever since last October. If it persists, then deep tropics activity during ASO could be lower than currently forecast. It’s starting to feel more and more probable that a forecast bust season is coming.
The CFS has been flip-flopping a lot. Some runs show over half a dozen MDR systems and some long-tracking majors during August/September, other runs barely show any storms after August 20th with extended periods of inactivity in September.
Next month’s SEAS5 forecast is going to be very interesting imo
What’s SEAS5?
The ECMWF seasonal forecast.
Last edited by skyline385 on Mon Jul 18, 2022 4:14 pm, edited 1 time in total.
Nimbus wrote:That SAL is a beautiful inhibiting factor that will take a few African waves to re-moisten in August.
I'm wondering if the higher SST's may actually create more TUTT's and shear? If the heat energy isn't used to power an efficient tightly packed cyclone doesn't nature have other ways of releasing it via troughs and upper air instability?
Yes, higher SST in the subtropics may create more TUTTs.
And this year, that does not seem to really be the case, considering the subtropics are much cooler normal, let alone the general warm subtropical pattern we've seen in the most recent hurricane seasons.
I wouldn’t say sea surface temperatures have a direct correlation to the formation or strength of a Tropical Upper Tropospheric Trough (TUTT), but it can have some influence (particularly on positioning and higher SSTa would increase the heights of the tropopause/gradient). Mid-latitude troughs have more of an influence from SSTs (due to instability/mixing layers) whereas upper-level troughs (such as a TUTT) are maintained by subsidence warming near the tropopause (which is balanced by radiational advection cooling). TUTT formation is generally the result of energy intrusion and winds from the mid-latitudes into the tropics, in particular the expansion of the trough of westerly winds into the tropics (such as energy released from the North American jet streams, particularly the North Atlantic polar jet stream):
TUTTs undergo different stages (essentially a lifecycle), and when TUTTs are matured, they present significant challenges to tropical cyclones and tropical cyclone genesis (TCG). Enhanced vertical wind shear is typically present across critical formation zones in the North Atlantic basin, and reduced convection is also typically seen. Since the North Atlantic jet stream and the African easterly jet stream are givens, the North Atlantic TUTT is almost always present as well. Positioning, strength, and lifecycle can vary (I’ll go a bit more into that below), but here is an analysis of the NA TUTT:
If you’ve been on this board during peak season (particularly heavy WPAC seasons), you’ve probably heard about recurving typhoons impacting downstream conditions (such as North American weather patterns). Essentially recurving typhoons act as anticyclonic wave breaking mechanisms, which can alter the North Atlantic polar jet stream through additional advection of energy and wind. As stated above, TUTTs are invigorated by additional mid-latitude energy and winds. Essentially think of this giant conveyor belt that extends from the NW Pacific to the N Atlantic (see image below), and the recurving energy hitches a ride to North America, some of that mid-latitude energy and winds will be translated to the north Atlantic TUTT:
One other point I want to make is TUTTs can assist in TCG through multiple scenarios. For one, when a TUTT reaches the end of its lifecycle, its typical to see the formation of what we refer to as TUTT cells (i.e., upper cold lows) at the base of the TUTT. These typically move towards the SW, and often are accompanied by a weak inverted wave in the easterlies. Downward development can increase convection and assist in the formation of a surface vortex. In other instances, the positional parameters of the TUTT itself can assist in TCG by creating additional forced ascent near the low-pressure area as well as provide enhanced outflow channels in the upper troposphere. See image below and the post from Webb on Dorian:
It's unclear what impacts the NA TUTT will have on this season, and those impacts are usually not presented until ASO. Due the usually strong subtropical ridge in May, June, July, African Easterly Waves (AEWs) typically propagate over South America, Central America, and into the Pacific:
As the subtropical ridge begins to relax in August and into September and October, AEWs will begin to increase in latitude and decrease in speed:
aspen wrote:This excessive ridging problem the Euro is showing for August has been in place ever since last October. If it persists, then deep tropics activity during ASO could be lower than currently forecast. It’s starting to feel more and more probable that a forecast bust season is coming.
The CFS has been flip-flopping a lot. Some runs show over half a dozen MDR systems and some long-tracking majors during August/September, other runs barely show any storms after August 20th with extended periods of inactivity in September.
Personally wouldn't call for a "bust season"...yet. Will this season live up to the 180= ACE hype of June? In all likelihood, no. But to suggest that the season may "bust" based off of one ECMWF weekly set is not particularly sound logic, made even less sound by the use of the long-range CFS (notoriously low resolution and wavering model). I'd definitely hold off on any significant forecast reductions until mid-August, as CSU does. Before then it is honestly too soon to tell.
Last edited by MHC Tracking on Mon Jul 18, 2022 4:27 pm, edited 1 time in total.
aspen wrote:This excessive ridging problem the Euro is showing for August has been in place ever since last October. If it persists, then deep tropics activity during ASO could be lower than currently forecast. It’s starting to feel more and more probable that a forecast bust season is coming.
The CFS has been flip-flopping a lot. Some runs show over half a dozen MDR systems and some long-tracking majors during August/September, other runs barely show any storms after August 20th with extended periods of inactivity in September.
Personally wouldn't call for a "bust season"...yet. Will this season live up to the 180= ACE hype of June? In all likelihood, no. But to suggest that the season may "busT2 based off of one ECMWF weekly set is not particularly sound logic, made even less sound by the use of the long-range CFS (notoriously low resolution and wavering model). I'd definitely hold off on any significant forecast reductions until mid-August, as CSU does. Before then it is honestly too soon to tell.
It’s not one weekly though, all of them have been on a downtrend for a while. The seasonal forecast too dropped numbers in July from June. But i agree with the rest of your points, particularly regarding the CFS.
skyline385 wrote:VP for last 15 days of August show rising air over Africa atleast which should get the activity going but Western Atlantic remains suppressed.
That’s actually a pretty favorable velocity pattern. I think one time Eric Webb shared a composite hyperactive/above average pattern VP map, and typically speaking you need sinking over the EPAC and W Atlantic but rising over the Indian Ocean and Africa to get those kinds of seasons. It’s when you have a rising cell over the EPAC where competition between the EPAC and Atlantic arises, causing the Atlantic to ultimately get hurt, but there does not seem to be a rising EPAC cell there
8 likes
Unless explicitly stated, all information in my posts is based on my own opinions and observations. Tropical storms and hurricanes can be extremely dangerous. Refer to an accredited weather research agency or meteorologist if you need to make serious decisions regarding an approaching storm.
skyline385 wrote:VP for last 15 days of August show rising air over Africa atleast which should get the activity going but Western Atlantic remains suppressed.
You actually don't want a -VP cell in the western Atlantic for NATL activity because that just aids TWs to develop in the EPAC. Having just a rising cell over Africa is one of the best possible configurations during ASO - it's only during early and late season where you would want the MJO in phase 8/1 because that's CAG season and it boosts tropical waves as they interact with the monsoon gyre.
3 likes
Please note the thoughts expressed by this account are solely those of the user and are from a hobbyist perspective. For more comprehensive analysis, consult an actual professional meteorologist or meteorological agency.
aspen wrote:This excessive ridging problem the Euro is showing for August has been in place ever since last October. If it persists, then deep tropics activity during ASO could be lower than currently forecast. It’s starting to feel more and more probable that a forecast bust season is coming.
The CFS has been flip-flopping a lot. Some runs show over half a dozen MDR systems and some long-tracking majors during August/September, other runs barely show any storms after August 20th with extended periods of inactivity in September.
I'm starting to think 1983 is a good analog this season
2 likes
This post was probably an opinion of mine, and in no way is official. Please refer to http://www.hurricanes.gov for official tropical analysis and advisories.
My website, with lots of tropical wx graphics, including satellite and recon: http://cyclonicwx.com