2023 Indicators (SST, SAL, MSLP, Wind shear, Steering, Instability) and Day 16+ Models
Moderator: S2k Moderators
Forum rules

The posts in this forum are NOT official forecasts and should not be used as such. They are just the opinion of the poster and may or may not be backed by sound meteorological data. They are NOT endorsed by any professional institution or STORM2K. For official information, please refer to products from the National Hurricane Center and National Weather Service.
-
gatorcane

- S2K Supporter

- Posts: 23708
- Age: 48
- Joined: Sun Mar 13, 2005 3:54 pm
- Location: Boca Raton, FL
Re: 2023 Indicators (SST, SAL, MSLP, Wind shear, Steering, Instability) and Day 16+ Models
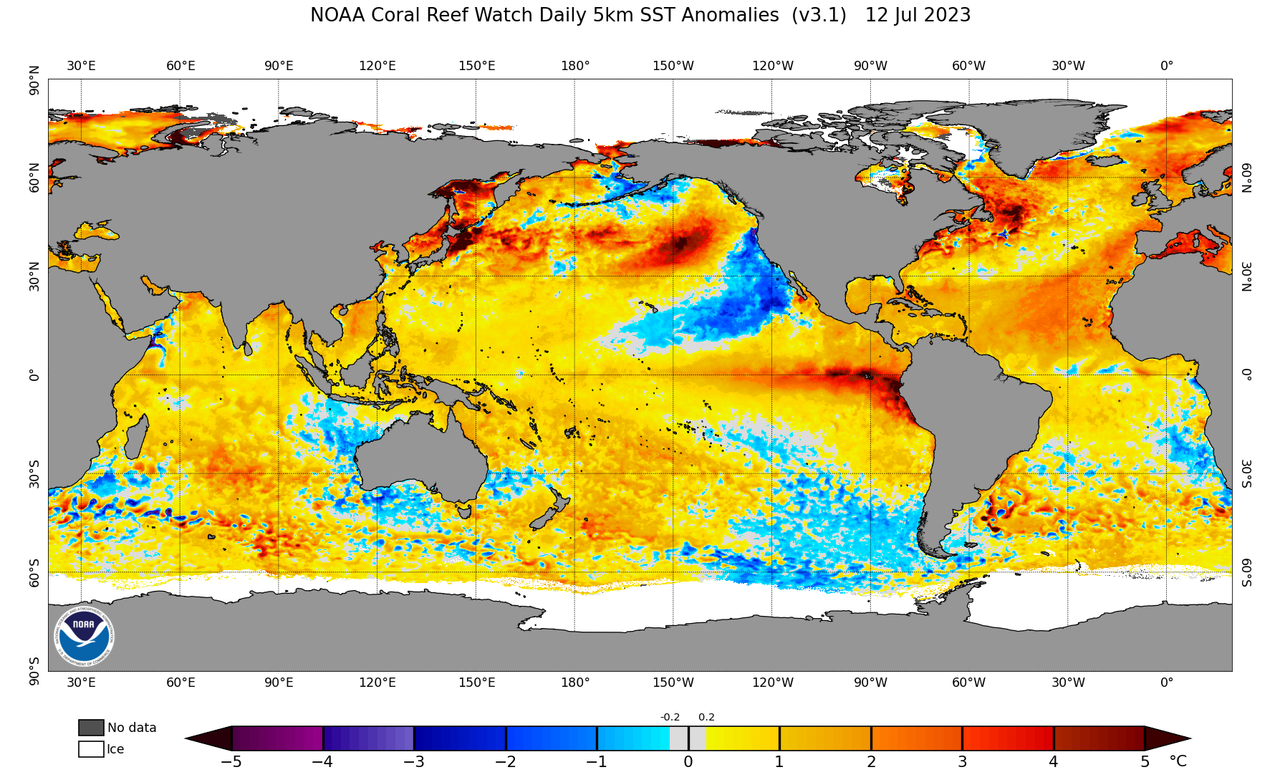
Those are some impressive anomalies near the equator south of Mexico in the Pacific. Still thinking even a strong El Niño is possible as the warming continues which should induce a lot of shear especially over the Caribbean:
2 likes
-
NotSparta

- Professional-Met

- Posts: 1676
- Age: 24
- Joined: Fri Aug 18, 2017 8:24 am
- Location: Naples, FL
- Contact:
Re: 2023 Indicators (SST, SAL, MSLP, Wind shear, Steering, Instability) and Day 16+ Models
Category5Kaiju wrote:We already have the D storm. Bye 2022!
We already had the D storm, that was Cindy since 01L went unnamed
1 likes
This post was probably an opinion of mine, and in no way is official. Please refer to http://www.hurricanes.gov for official tropical analysis and advisories.
My website, with lots of tropical wx graphics, including satellite and recon: http://cyclonicwx.com
My website, with lots of tropical wx graphics, including satellite and recon: http://cyclonicwx.com
-
Spacecoast

- Category 2

- Posts: 773
- Joined: Thu Aug 31, 2017 2:03 pm
Re: 2023 Indicators (SST, SAL, MSLP, Wind shear, Steering, Instability) and Day 16+ Models
What happens when anomalies are no longer anomalous?
There are only so many deeper shades of red available.
Its been a long time since NATL experienced anomalously low (or average) SST temperatures.
There has been fourteen consecutive years of anomalously high temps. Since the mid nineties, it's been rising at an fairly constant, and perhaps predictable rate.
This chart may never return to the mean, or below:

Question: Why does CCI/UM use 1971-2000, (or any prior, fixed date range) as the baseline for anomalies?
Is the mean meaningful, or arbitrary?
This chart shifts the baseline out a decade, making 1982-2011 the 'new normal' baseline...
Even so, 2023 is greater than 2σ above that mean. ..

Maybe it's time to make 1992-2022 the new, 'new normal'.
It's not clear what years NOAA Coral Watch uses as a baseline...("the long-term average +/- 5°C)."
Taking climate change into account, it seems more useful to quantify how anomalous SST temps are compared (above/below) to the long term linear trend:

There are only so many deeper shades of red available.
Its been a long time since NATL experienced anomalously low (or average) SST temperatures.
There has been fourteen consecutive years of anomalously high temps. Since the mid nineties, it's been rising at an fairly constant, and perhaps predictable rate.
This chart may never return to the mean, or below:
Question: Why does CCI/UM use 1971-2000, (or any prior, fixed date range) as the baseline for anomalies?
Is the mean meaningful, or arbitrary?
This chart shifts the baseline out a decade, making 1982-2011 the 'new normal' baseline...
Even so, 2023 is greater than 2σ above that mean. ..
Maybe it's time to make 1992-2022 the new, 'new normal'.
It's not clear what years NOAA Coral Watch uses as a baseline...("the long-term average +/- 5°C)."
Taking climate change into account, it seems more useful to quantify how anomalous SST temps are compared (above/below) to the long term linear trend:
5 likes
-
ScottNAtlanta

- Category 5

- Posts: 2535
- Joined: Sat May 25, 2013 3:11 pm
- Location: Atlanta, GA
Re: 2023 Indicators (SST, SAL, MSLP, Wind shear, Steering, Instability) and Day 16+ Models
It's important to look at actual SSTs in addition to anomalies. Generally, where the warmest water is...that's where the upward motion will be
While the eastern Pacific equatorial region is very warm compared to average, It is warmer in the Atlantic. It is also way warmer in the WPAC
While the eastern Pacific equatorial region is very warm compared to average, It is warmer in the Atlantic. It is also way warmer in the WPAC
5 likes
The posts in this forum are NOT official forecast and should not be used as such. They are just the opinion of the poster and may or may not be backed by sound meteorological data. They are NOT endorsed by any professional institution or storm2k.org. For official information, please refer to the NHC and NWS products.
Re: 2023 Indicators (SST, SAL, MSLP, Wind shear, Steering, Instability) and Day 16+ Models
1 likes

Re: 2023 Indicators (SST, SAL, MSLP, Wind shear, Steering, Instability) and Day 16+ Models
ScottNAtlanta wrote:It's important to look at actual SSTs in addition to anomalies. Generally, where the warmest water is...that's where the upward motion will be
https://www.ospo.noaa.gov/data/sst/contour/contour.small.gif
While the eastern Pacific equatorial region is very warm compared to average, It is warmer in the Atlantic. It is also way warmer in the WPAC
agreed!
0 likes
-
ScottNAtlanta
- Category 5
- Posts: 2535
- Joined: Sat May 25, 2013 3:11 pm
- Location: Atlanta, GA
Re: 2023 Indicators (SST, SAL, MSLP, Wind shear, Steering, Instability) and Day 16+ Models
zzzh wrote::uarrow: That's not how it works. If you just look at VP200 (not anomaly), the main rising branch will ALWAYS be in the maritime continent/IO-WPAC warm pool, with sinking branch over the Atlantic/Africa.
That's why the WPAC usually has the most activity and a season that goes almost year round. If you look at water temps, the EPAC isn't that much warmer than the Atlantic and the Atlantic is warmer overall than the EPAC. That's why just looking at anomalies can be deceiving. The MJO seems to just want to hang in the nul phase so one basin isn't really taking over. In an El Nino year with a cool Atlantic, the EPAC would be cranking out storms left and right. That has not been happening. The ones that have developed have had to work at it and the -PDO limits their range.
5 likes
The posts in this forum are NOT official forecast and should not be used as such. They are just the opinion of the poster and may or may not be backed by sound meteorological data. They are NOT endorsed by any professional institution or storm2k.org. For official information, please refer to the NHC and NWS products.
-
Category5Kaiju

- Category 5
- Posts: 4322
- Joined: Thu Dec 24, 2020 12:45 pm
- Location: Seattle and Phoenix
Re: 2023 Indicators (SST, SAL, MSLP, Wind shear, Steering, Instability) and Day 16+ Models
Of course it's very early, and nobody knows how exactly this season will pan out, but something tells me that it is somewhat in the realm of possibilities that we get a bunch of weak storms, with a select few ending up as strong, major hurricanes. 1969 and 2019 (both of which were affected to some extent by an El Nino) come to mind here.
So basically, a total NS count that is in the mid to upper 10s, but with 3 or so major hurricanes...something like that.
So basically, a total NS count that is in the mid to upper 10s, but with 3 or so major hurricanes...something like that.
0 likes
Unless explicitly stated, all info in my posts is based on my own opinions and observations. Tropical storms and hurricanes can be extremely dangerous. Refer to an accredited weather research agency or meteorologist if you need to make serious decisions regarding an approaching storm.
-
cycloneye

- Admin

- Posts: 149137
- Age: 69
- Joined: Thu Oct 10, 2002 10:54 am
- Location: San Juan, Puerto Rico
Re: 2023 Indicators (SST, SAL, MSLP, Wind shear, Steering, Instability) and Day 16+ Models
The wave that will emerge Africa next week will be the strongest so far in 2023 and will be a test of how conditions are in MDR with the battle between El NIño and warm sst's /+AMO..
https://twitter.com/AndyHazelton/status/1680255956159004672
https://twitter.com/AndyHazelton/status/1680255956159004672
@AndyHazelton
·
9m
It's probably just somewhat climatology, but dry air early season, El Niño late season doesn't seem like a ticket for a high end Atlantic year, even with very warm SST. Unless there's a ton of activity in a very short window near peak season.
·
9m
It's probably just somewhat climatology, but dry air early season, El Niño late season doesn't seem like a ticket for a high end Atlantic year, even with very warm SST. Unless there's a ton of activity in a very short window near peak season.
0 likes
Visit the Caribbean-Central America Weather Thread where you can find at first post web cams,radars
and observations from Caribbean basin members Click Here
and observations from Caribbean basin members Click Here


Re: 2023 Indicators (SST, SAL, MSLP, Wind shear, Steering, Instability) and Day 16+ Models
zzzh wrote::uarrow: That's not how it works. If you just look at VP200 (not anomaly), the main rising branch will ALWAYS be in the maritime continent/IO-WPAC warm pool, with sinking branch over the Atlantic/Africa.
For the Atlantic the closer the rising branch is to the MC the better. Thus why modoki El Ninos can sometimes feature big NATL seasons like 2004.
This year is odd in that the EQ rising motion is split between west of the IDL and the far eastern Nino regions.
2 likes
The above post and any post by Ntxw is NOT an official forecast and should not be used as such. It is just the opinion of the poster and may or may not be backed by sound meteorological data. It is NOT endorsed by any professional institution including Storm2k. For official information, please refer to NWS products.
Help support Storm2K!
-
Category5Kaiju
- Category 5
- Posts: 4322
- Joined: Thu Dec 24, 2020 12:45 pm
- Location: Seattle and Phoenix
Re: 2023 Indicators (SST, SAL, MSLP, Wind shear, Steering, Instability) and Day 16+ Models
cycloneye wrote:The wave that will emerge Africa next week will be the strongest so far in 2023 and will be a test of how conditions are in MDR with the battle between El NIño and warm sst's /+AMO..
https://twitter.com/AndyHazelton/status/1680255956159004672@AndyHazelton
·
9m
It's probably just somewhat climatology, but dry air early season, El Niño late season doesn't seem like a ticket for a high end Atlantic year, even with very warm SST. Unless there's a ton of activity in a very short window near peak season.
Since when was there an Atlantic season in recent times that didn't struggle with dry air and that stuff in late July/early August?
5 likes
Unless explicitly stated, all info in my posts is based on my own opinions and observations. Tropical storms and hurricanes can be extremely dangerous. Refer to an accredited weather research agency or meteorologist if you need to make serious decisions regarding an approaching storm.
-
Spacecoast
- Category 2
- Posts: 773
- Joined: Thu Aug 31, 2017 2:03 pm

Re: 2023 Indicators (SST, SAL, MSLP, Wind shear, Steering, Instability) and Day 16+ Models
Category5Kaiju wrote:cycloneye wrote:The wave that will emerge Africa next week will be the strongest so far in 2023 and will be a test of how conditions are in MDR with the battle between El NIño and warm sst's /+AMO..
https://twitter.com/AndyHazelton/status/1680255956159004672@AndyHazelton
·
9m
It's probably just somewhat climatology, but dry air early season, El Niño late season doesn't seem like a ticket for a high end Atlantic year, even with very warm SST. Unless there's a ton of activity in a very short window near peak season.
Since when was there an Atlantic season in recent times that didn't struggle with dry air and that stuff in late July/early August?
Right?!? Personally I’m surprised that even experts are (not openly canceling the season) but alluding to that this season is going to be dead non the less when even in 2015 we had 2 major hurricanes. It doesn’t make any sense to me honestly. Not to mention, yeah, since when hasn’t dry air been an issue this time of year in the Atlantic? If the wave next week doesn’t develop, oh well, really doesn’t mean anything in my opinion because that is simply just climatology. Think the assumption that El Nino = no hurricane season is just not the play to go by when forecasting an upcoming season like this one.
1 likes
-
WeatherBoy2000
- Category 1

- Posts: 459
- Joined: Mon Apr 10, 2023 9:29 am
Re: 2023 Indicators (SST, SAL, MSLP, Wind shear, Steering, Instability) and Day 16+ Models
One interesting thing about the two notably active el nino seasons of the satellite era (2004/1969) is that they started their peaks a bit sooner than normal. August 20th is the start of the peak of the hurricane season, and it's after that date where the first major hurricane typically occurs. 1969 had 3 major hurricanes with two of them becoming majors prior to August 20th. 2004 kicked off quickly on August 1st and had two majors by August 20th as well. Ever since 2010, all major hurricanes have occurred on or after this date, even in hyperactive seasons like 2010, 2017, and 2020. The Atlantic for the past decade has been relying on heavy peak to late season activity to be active. That might not be something that can happen this year as an el nino's negative influence increases by late September into October. If the very active season forecasts are going to verify, there's a good argument to be made that the Atlantic will have to be more frontloaded than normal.
3 likes

Re: 2023 Indicators (SST, SAL, MSLP, Wind shear, Steering, Instability) and Day 16+ Models
WiscoWx02 wrote:Category5Kaiju wrote:cycloneye wrote:The wave that will emerge Africa next week will be the strongest so far in 2023 and will be a test of how conditions are in MDR with the battle between El NIño and warm sst's /+AMO..
https://twitter.com/AndyHazelton/status/1680255956159004672@AndyHazelton
·
9m
It's probably just somewhat climatology, but dry air early season, El Niño late season doesn't seem like a ticket for a high end Atlantic year, even with very warm SST. Unless there's a ton of activity in a very short window near peak season.
Since when was there an Atlantic season in recent times that didn't struggle with dry air and that stuff in late July/early August?
Right?!? Personally I’m surprised that even experts are (not openly canceling the season) but alluding to that this season is going to be dead non the less when even in 2015 we had 2 major hurricanes. It doesn’t make any sense to me honestly. Not to mention, yeah, since when hasn’t dry air been an issue this time of year in the Atlantic? If the wave next week doesn’t develop, oh well, really doesn’t mean anything in my opinion because that is simply just climatology. Think the assumption that El Nino = no hurricane season is just not the play to go by when forecasting an upcoming season like this one.
I think I’ll side with the hurricane experts and their predictions of an above normal season over Andy. This year has been an odd year with surprises. I see no reason for that not to continue.
1 likes
-
Category5Kaiju
- Category 5
- Posts: 4322
- Joined: Thu Dec 24, 2020 12:45 pm
- Location: Seattle and Phoenix
Re: 2023 Indicators (SST, SAL, MSLP, Wind shear, Steering, Instability) and Day 16+ Models
WeatherBoy2000 wrote:One interesting thing about the two notably active el nino seasons of the satellite era (2004/1969) is that they started their peaks a bit sooner than normal. August 20th is the start of the peak of the hurricane season, and it's after that date where the first major hurricane typically occurs. 1969 had 3 major hurricanes with two of them becoming majors prior to August 20th. 2004 kicked off quickly on August 1st and had two majors by August 20th as well. Ever since 2010, all major hurricanes have occurred on or after this date, even in hyperactive seasons like 2010, 2017, and 2020. The Atlantic for the past decade has been relying on heavy peak to late season activity to be active. That might not be something that can happen this year as an el nino's negative influence increases by late September into October. If the very active season forecasts are going to verify, there's a good argument to be made that the Atlantic will have to be more frontloaded than normal.
Another interesting thing to note is 1899 and 1951 featured two very destructive and deadly Category 4 hurricanes in early to mid August. Now of course, it's been a hot while since we had a hurricane season that had a major hurricane before August 20, so I think a lot of trackers on here (yes, including me) may naturally be used to the idea of early-mid August = unfavorable. But who knows? Sometimes strange years (like what this year appears to be) leads to strange outcomes.
1 likes
Unless explicitly stated, all info in my posts is based on my own opinions and observations. Tropical storms and hurricanes can be extremely dangerous. Refer to an accredited weather research agency or meteorologist if you need to make serious decisions regarding an approaching storm.
-
Spacecoast
- Category 2
- Posts: 773
- Joined: Thu Aug 31, 2017 2:03 pm
Re: 2023 Indicators (SST, SAL, MSLP, Wind shear, Steering, Instability) and Day 16+ Models
I believe Andy is only alluding to the possibility that 2023 season may be less than 'high-end'.
Whether high-end means 18/9/4 (CSU), or 25/12/6 (Univ Az), is not clear, but I did not not read his tweet as alluding to a dead season, or no hurricane season.
In a normal season, with a historical distribution, we should the 1st Hurricane forming before Aug 13th. Otherwise, the 2023 season would be 'falling behind schedule' to achieve 9 Hurricanes. Certainly behind schedule to achieve 12. That doesn't mean the season won't be back-loaded, and make up for it in late Sept / Oct / Nov, but (by then), SST's should be on the decline, and El Nino should be on the rise.
I think this is what Andy was trying to convey by saying it may be just climatology.
There is a lot of uncertainty about how this will play out, for sure. I think 'above normal', but I am no expert.
2 likes
-
Hurricane2022

- Category 5
- Posts: 2011
- Joined: Tue Aug 23, 2022 11:38 pm
- Location: Araçatuba, Brazil
Re: 2023 Indicators (SST, SAL, MSLP, Wind shear, Steering, Instability) and Day 16+ Models
2 likes
Sorry for the bad English sometimes...!
For reliable and detailed information for any meteorological phenomenon, please consult the National Hurricane Center, Joint Typhoon Warning Center , or your local Meteo Center.
--------
ECCE OMNIA NOVA FACIAM (Ap 21,5).
For reliable and detailed information for any meteorological phenomenon, please consult the National Hurricane Center, Joint Typhoon Warning Center , or your local Meteo Center.
--------
ECCE OMNIA NOVA FACIAM (Ap 21,5).

Re: 2023 Indicators (SST, SAL, MSLP, Wind shear, Steering, Instability) and Day 16+ Models
Spacecoast wrote:What happens when anomalies are no longer anomalous?
There are only so many deeper shades of red available.
Its been a long time since NATL experienced anomalously low (or average) SST temperatures.
There has been fourteen consecutive years of anomalously high temps. Since the mid nineties, it's been rising at an fairly constant, and perhaps predictable rate.
This chart may never return to the mean, or below:
https://i.ibb.co/z27YTzt/ec7.jpg
Question: Why does CCI/UM use 1971-2000, (or any prior, fixed date range) as the baseline for anomalies?
Is the mean meaningful, or arbitrary?
This chart shifts the baseline out a decade, making 1982-2011 the 'new normal' baseline...
Even so, 2023 is greater than 2σ above that mean. ..
https://i.ibb.co/2FY4yNQ/ec14.jpg
Maybe it's time to make 1992-2022 the new, 'new normal'.
It's not clear what years NOAA Coral Watch uses as a baseline...("the long-term average +/- 5°C)."
Taking climate change into account, it seems more useful to quantify how anomalous SST temps are compared (above/below) to the long term linear trend:
https://i.ibb.co/W0yW5Xr/ec13.jpg
Is there a link to these graphs on another website, or are you generating from data and posting? Asking because I'd like to bookmark the source webpage.
0 likes
-
Spacecoast
- Category 2
- Posts: 773
- Joined: Thu Aug 31, 2017 2:03 pm
Re: 2023 Indicators (SST, SAL, MSLP, Wind shear, Steering, Instability) and Day 16+ Models
Texoz wrote:Is there a link to these graphs on another website, or are you generating from data and posting? Asking because I'd like to bookmark the source webpage.
https://climatereanalyzer.org/clim/sst_daily/
Also, https://coralreefwatch.noaa.gov/product/5km/index_5km_ssta.php
The last chart I generated myself from same site data order to perform calculations.
1 likes
Who is online
Users browsing this forum: No registered users and 47 guests