2024 Indicators: SST's, MSLP, Shear, SAL, Steering, Instability (Day 16+ Climate Models)
Moderator: S2k Moderators
Forum rules

The posts in this forum are NOT official forecasts and should not be used as such. They are just the opinion of the poster and may or may not be backed by sound meteorological data. They are NOT endorsed by any professional institution or STORM2K. For official information, please refer to products from the National Hurricane Center and National Weather Service.

Re: 2024 Indicators: SST's, MSLP, Shear, SAL, Steering, Instability (Day 16+ Climate Models) ECMWF is up
I believe there’s a good chance we see more storms than what NOAA is predicting. I don’t think 25-30 NS can be ruled out at all, as I see that being more likely than 15-20 NS. A lot of these forecast predictions for expected busy seasons end up busting low. Seen it happen a bunch of times.
1 likes
-
wxman57

- Moderator-Pro Met

- Posts: 23172
- Age: 68
- Joined: Sat Jun 21, 2003 8:06 pm
- Location: Houston, TX (southwest)
Re: 2024 Indicators: SST's, MSLP, Shear, SAL, Steering, Instability (Day 16+ Climate Models) ECMWF is up
Cpv17 wrote:I believe there’s a good chance we see more storms than what NOAA is predicting. I don’t think 25-30 NS can be ruled out at all, as I see that being more likely than 15-20 NS. A lot of these forecast predictions for expected busy seasons end up busting low. Seen it happen a bunch of times.
I'm starting to think that the total may be less than 20. At least I'm hopeful that's the case. Not to mention, I went 17/8/4 in the office contest.
1 likes
-
Mouton
- S2K Supporter

- Posts: 222
- Age: 80
- Joined: Sat Jul 30, 2011 8:13 am
- Location: Amelia Island Florida
Re: 2024 Indicators: SST's, MSLP, Shear, SAL, Steering, Instability (Day 16+ Climate Models) ECMWF is up
Never bet against NOAA as they have the ability to name just about at will. My chief concern is TC hitting the US especially above the 2 level. 
1 likes

Re: 2024 Indicators: SST's, MSLP, Shear, SAL, Steering, Instability (Day 16+ Climate Models) ECMWF is up
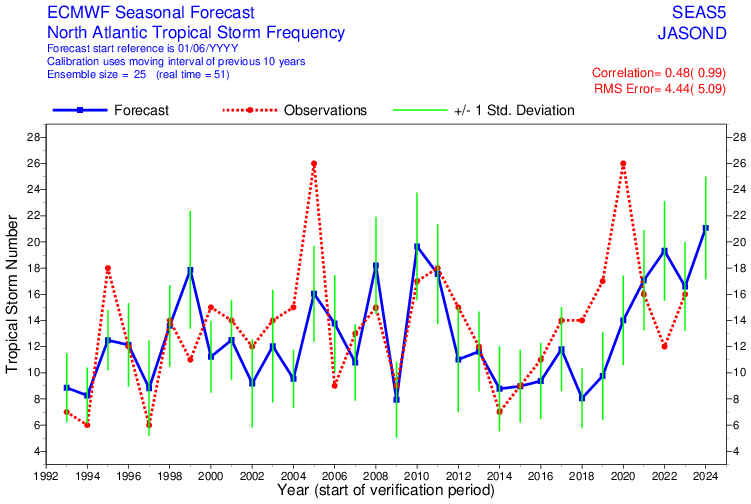
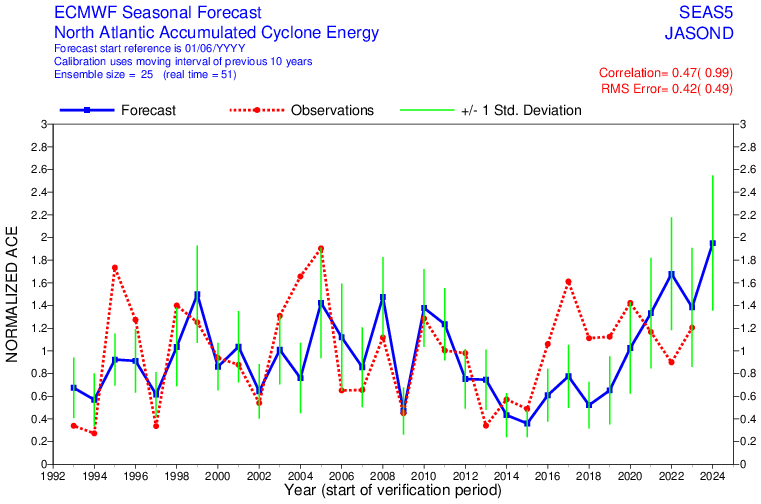
wxman57 wrote:SFLcane wrote:wxman57 wrote:June ECMWF seasonal forecast is in. Between July 1 and Dec 31, it is now predicting 21.1 NS, down from 22.8 in May. For hurricanes, 11.3, down from 12.8 in May. ACE still 200% of normal. I expected a decrease in NS over May, since June is no longer considered. However, I think the fewer hurricanes is significant, indicating that it's a bit less bullish on activity this season. Also, the track density has less Caribbean and Gulf activity.
Caribbean looks very active in my opinion actually. Hotspot could be SW atlantic this yr. Most will recurve as they do every yr but a few could make it through.
https://i.postimg.cc/ydc3w5bs/hhhhhm.jpg
https://i.postimg.cc/HW07zqMt/hkhkh.jpg
As for the Caribbean, I only noted the decrease (removal) of any red track density from the Caribbean in the June forecast. Everything indicates less dry, sinking air there this year. However, I'm beginning to think that predicted numbers will be going down over the next month or so.
Just saying: The April seasonal models showed a dip in activity, and people started saying the same thing by extrapolating the "trend" for the upcoming months. However, the "trends" were reversed in the May forecasts.
1 likes
TC naming lists: retirements and intensity
Most aggressive Advisory #1's in North Atlantic (cr. kevin for starting the list)
Most aggressive Advisory #1's in North Atlantic (cr. kevin for starting the list)
-
skyline385

- Category 5

- Posts: 2728
- Age: 35
- Joined: Wed Aug 26, 2020 11:15 pm
- Location: Houston TX
Re: 2024 Indicators: SST's, MSLP, Shear, SAL, Steering, Instability (Day 16+ Climate Models) ECMWF is up
Teban54 wrote:wxman57 wrote:SFLcane wrote:
Caribbean looks very active in my opinion actually. Hotspot could be SW atlantic this yr. Most will recurve as they do every yr but a few could make it through.
https://i.postimg.cc/ydc3w5bs/hhhhhm.jpg
https://i.postimg.cc/HW07zqMt/hkhkh.jpg
As for the Caribbean, I only noted the decrease (removal) of any red track density from the Caribbean in the June forecast. Everything indicates less dry, sinking air there this year. However, I'm beginning to think that predicted numbers will be going down over the next month or so.
Just saying: The April seasonal models showed a dip in activity, and people started saying the same thing by extrapolating the "trend" for the upcoming months. However, the "trends" were reversed in the May forecasts.
Hmm why are we talking about "dip in activity" when the estimated ACE has remained unchanged on the seasonal Euro from last month? And April's forecast (which only ran upto October) had 21 NS predicted while March's forecast (which only ran upto September) understandably had 17 NS predicted. The ACE between March and April remained unchanged at 1.7 X Normalized ACE so I am not seeing where there was a "dip in activity" from Match to April which got reversed in May.
Additionally, this is a seasonal model which depends on the initialization parameters. The closer you are to the hurricane season, the better the initialization will be compared to something in March or April so naturally model runs in June or July carry more weight than earlier model runs when there can be changes in the configuration not forecasted by the model.
Finally, this is just one seasonal model which is very coarse in resolution and just like all other seasonal models, it is very inconsistent as can be seen in the verification plots below. We should be discussing their outputs but definitely remember that they are prone to change.
Last edited by skyline385 on Wed Jun 05, 2024 2:35 pm, edited 3 times in total.
7 likes
Re: 2024 Indicators: SST's, MSLP, Shear, SAL, Steering, Instability (Day 16+ Climate Models) ECMWF is up
skyline385 wrote:Teban54 wrote:wxman57 wrote:
As for the Caribbean, I only noted the decrease (removal) of any red track density from the Caribbean in the June forecast. Everything indicates less dry, sinking air there this year. However, I'm beginning to think that predicted numbers will be going down over the next month or so.
Just saying: The April seasonal models showed a dip in activity, and people started saying the same thing by extrapolating the "trend" for the upcoming months. However, the "trends" were reversed in the May forecasts.
Hmm why are we talking about "dip in activity" when the estimated ACE has remained unchanged on the seasonal Euro from last month? And April's forecast (which only ran upto October) had 21 NS predicted while March's forecast (which only ran upto September) understandably had 17 NS predicted. The ACE between March and April remained unchanged at 17 X ACE so I am not seeing where there was a "dip in activity" was from Match to April which got reversed in May.
Additionally, this is a seasonal model which depends on the initialization parameters. The closer you are to the hurricane season, the better the initialization will be compared to something in March or April so naturally model runs in June or July carry more weight than earlier model runs when there can be changes in the configuration not forecasted by the model.
Finally, this is just one seasonal model which is very coarse in resolution and just like all other seasonal models, it is very inconsistent as can be seen in the verification plots below. We should be discussing their outputs but definitely remember that they are prone to change.
Excellent post!
1 likes
-
Deshaunrob17
- Tropical Storm

- Posts: 211
- Joined: Tue Aug 18, 2020 7:49 am
Re: 2024 Indicators: SST's, MSLP, Shear, SAL, Steering, Instability (Day 16+ Climate Models) ECMWF is up
12 z GFS has the western Atlantic looking like the West Pac with a big old gyre… Flooding rains looking likely in the coming weeks.
0 likes
-
cycloneye

- Admin

- Posts: 149276
- Age: 69
- Joined: Thu Oct 10, 2002 10:54 am
- Location: San Juan, Puerto Rico
Re: 2024 Indicators: SST's, MSLP, Shear, SAL, Steering, Instability (Day 16+ Climate Models) ECMWF is up
1 likes
Visit the Caribbean-Central America Weather Thread where you can find at first post web cams,radars
and observations from Caribbean basin members Click Here
and observations from Caribbean basin members Click Here
-
Stratton23
- Category 5
- Posts: 3525
- Joined: Fri Jul 21, 2023 10:59 pm
- Location: Katy, Tx
Re: 2024 Indicators: SST's, MSLP, Shear, SAL, Steering, Instability (Day 16+ Climate Models) ECMWF is up
The numbers are not going down, im predicting 27/10/ 5, low SAL, shear will be going down, record warm waters, I really dont see this season producing anything less than 20 named storms,
1 likes

Re: 2024 Indicators: SST's, MSLP, Shear, SAL, Steering, Instability (Day 16+ Climate Models) ECMWF is up
wxman57 wrote:Cpv17 wrote:I believe there’s a good chance we see more storms than what NOAA is predicting. I don’t think 25-30 NS can be ruled out at all, as I see that being more likely than 15-20 NS. A lot of these forecast predictions for expected busy seasons end up busting low. Seen it happen a bunch of times.
I'm starting to think that the total may be less than 20. At least I'm hopeful that's the case. Not to mention, I went 17/8/4 in the office contest.
Interestingly enough, the 17/8/4 is roughly the most recent 10-year average of the 2014-2023 seasons!
I went with 25/11/7 which might be overly aggressive, hopefully it does end up lower.
0 likes
Georges '98, Irene '99, Frances '04, Jeanne '04, Katrina '05, Wilma '05, Gustav '08, Isaac '12, Matthew '16, Florence '18, Michael '18, Ian '22
-
toad strangler

- S2K Supporter
- Posts: 4546
- Joined: Sun Jul 28, 2013 3:09 pm
- Location: Earth
- Contact:
Re: 2024 Indicators: SST's, MSLP, Shear, SAL, Steering, Instability (Day 16+ Climate Models) ECMWF is up
wxman57 wrote:Cpv17 wrote:I believe there’s a good chance we see more storms than what NOAA is predicting. I don’t think 25-30 NS can be ruled out at all, as I see that being more likely than 15-20 NS. A lot of these forecast predictions for expected busy seasons end up busting low. Seen it happen a bunch of times.
I'm starting to think that the total may be less than 20. At least I'm hopeful that's the case. Not to mention, I went 17/8/4 in the office contest.
I went with 21. Mainly thinking about late season with La Nina not quitting until very late. May / June / and July are baked in meager numbers for me.
0 likes
My Weather Station
https://www.wunderground.com/dashboard/pws/KFLPORTS603
https://www.wunderground.com/dashboard/pws/KFLPORTS603
-
skyline385
- Category 5
- Posts: 2728
- Age: 35
- Joined: Wed Aug 26, 2020 11:15 pm
- Location: Houston TX
Re: 2024 Indicators: SST's, MSLP, Shear, SAL, Steering, Instability (Day 16+ Climate Models) ECMWF is up
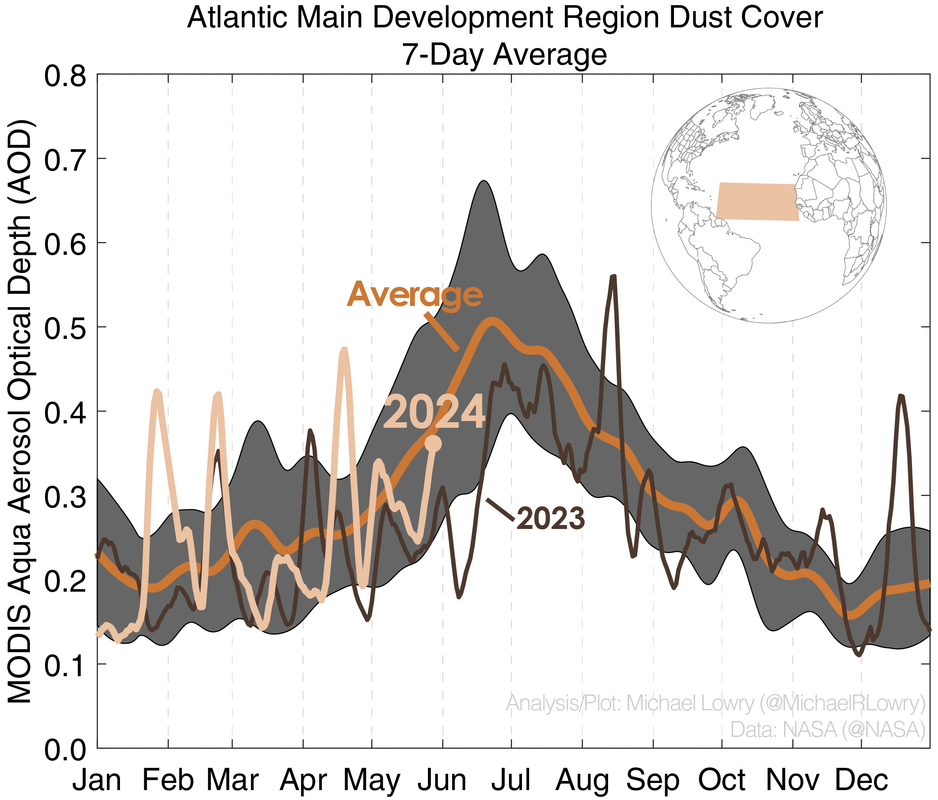
I would say SAL looks pretty much near average with 3 major spikes already earlier this season. The article linked by him also says the same
"So far things have been fairly normal in the dust department. Overall levels of dust are running about average, but we haven’t had a significant dust outbreak since mid-April and we also haven’t hit the dustiest part of the year."
Additionally, an active SAL season also generally means an active AEJ since it is the one transporting dust particles in the mid-level westward into the NATL. 2020 also had some of the largest SAL outbreaks because of it.
0 likes
-
Stratton23
- Category 5
- Posts: 3525
- Joined: Fri Jul 21, 2023 10:59 pm
- Location: Katy, Tx
Re: 2024 Indicators: SST's, MSLP, Shear, SAL, Steering, Instability (Day 16+ Climate Models) ECMWF is up
12z EPS has gotten my attention for middle june and beyond, the 500 mb height pattern showing up is a little bit concerning, strong ridging over the continental US- North atlantic, favorable steering pattern could be setting up for gulf landfalls mid month, we will just have to see about anything developing
2 likes
-
Category5Kaiju

- Category 5
- Posts: 4331
- Joined: Thu Dec 24, 2020 12:45 pm
- Location: Seattle and Phoenix
Re: 2024 Indicators: SST's, MSLP, Shear, SAL, Steering, Instability (Day 16+ Climate Models)

This has got to be the most fearsome +AMO look I've ever seen. At this rate, even if the subtropics were to warm, it would simply pale in comparison to the tropical warmth.
3 likes
Unless explicitly stated, all info in my posts is based on my own opinions and observations. Tropical storms and hurricanes can be extremely dangerous. Refer to an accredited weather research agency or meteorologist if you need to make serious decisions regarding an approaching storm.
Re: 2024 Indicators: SST's, MSLP, Shear, SAL, Steering, Instability (Day 16+ Climate Models)
Category5Kaiju wrote:https://www.star.nesdis.noaa.gov/pub/sod/mecb/crw/data/5km/v3.1_op/image_browse/daily/ssta/png/2024/ct5km_ssta_v3.1_global_20240604.png
This has got to be the most fearsome +AMO look I've ever seen. At this rate, even if the subtropics were to warm, it would simply pale in comparison to the tropical warmth.
Also interesting to note that both the Atlantic Nino earlier and the warmth in tropical South Atlantic have been fading. Earlier this year, there had been some opinions that the South Atlantic warmth would be a hinderance to the NATL season.
0 likes
TC naming lists: retirements and intensity
Most aggressive Advisory #1's in North Atlantic (cr. kevin for starting the list)
Most aggressive Advisory #1's in North Atlantic (cr. kevin for starting the list)
-
cycloneye
- Admin
- Posts: 149276
- Age: 69
- Joined: Thu Oct 10, 2002 10:54 am
- Location: San Juan, Puerto Rico
Re: 2024 Indicators: SST's, MSLP, Shear, SAL, Steering, Instability (Day 16+ Climate Models)
0 likes
Visit the Caribbean-Central America Weather Thread where you can find at first post web cams,radars
and observations from Caribbean basin members Click Here
and observations from Caribbean basin members Click Here
-
tolakram
- Admin
- Posts: 20179
- Age: 62
- Joined: Sun Aug 27, 2006 8:23 pm
- Location: Florence, KY (name is Mark)
Re: 2024 Indicators: SST's, MSLP, Shear, SAL, Steering, Instability (Day 16+ Climate Models)
I give up on anyone ever fixing this plot. I think we can assume instability is jumping up and down around normal at the moment.

Shear is still at June levels, even if below normal. Seems like a lot of social media posters are completely ignoring the fact that warm waters are just one part of the equation.

Shear is still at June levels, even if below normal. Seems like a lot of social media posters are completely ignoring the fact that warm waters are just one part of the equation.
2 likes
M a r k
- - - - -
Join us in chat: Storm2K Chatroom Invite. Android and IOS apps also available.
The posts in this forum are NOT official forecasts and should not be used as such. Posts are NOT endorsed by any professional institution or STORM2K.org. For official information and forecasts, please refer to NHC and NWS products.

Re: 2024 Indicators: SST's, MSLP, Shear, SAL, Steering, Instability (Day 16+ Climate Models)
tolakram wrote:Shear is still at June levels, even if below normal. Seems like a lot of social media posters are completely ignoring the fact that warm waters are just one part of the equation.
https://i.imgur.com/zKdpq7c.png
I think we're still going into La-Nina. As of now we're in Neutral so when La-Nina comes into full play in the next month or so, shear conditions should generally improve for hurricane development. For now, though the Pacific is still set up so it's not favorable for shear.
0 likes
Large Signatures are for losers.
The posts in this forum are NOT official forecasts and should not be used as such. They are just the opinion of the poster and may or may not be backed by sound meteorological data. They are NOT endorsed by any professional institution or STORM2K. For official information, please refer to products from the NHC and NWS.
-
Category5Kaiju
- Category 5
- Posts: 4331
- Joined: Thu Dec 24, 2020 12:45 pm
- Location: Seattle and Phoenix
Re: 2024 Indicators: SST's, MSLP, Shear, SAL, Steering, Instability (Day 16+ Climate Models)
Just a friendly reminder that one of the most active NS seasons on record (most active ACE-wise) didn't really get going until late June/early July. In fact, assuming the talks that it could've produced more than 20 NSs given spotty records are true, then even if we were to get discount the May storm, then this season would've still ended up with at least 20 NSs.
TL;DR: even if we don't really see June activity this year, that wouldn't really tell us anything about how active the season will be later on. And given the -ENSO state, I'd wager that this season will extend into October and November.
TL;DR: even if we don't really see June activity this year, that wouldn't really tell us anything about how active the season will be later on. And given the -ENSO state, I'd wager that this season will extend into October and November.
4 likes
Unless explicitly stated, all info in my posts is based on my own opinions and observations. Tropical storms and hurricanes can be extremely dangerous. Refer to an accredited weather research agency or meteorologist if you need to make serious decisions regarding an approaching storm.
-
jlauderdal
- S2K Supporter
- Posts: 7240
- Joined: Wed May 19, 2004 5:46 am
- Location: NE Fort Lauderdale
- Contact:
Re: 2024 Indicators: SST's, MSLP, Shear, SAL, Steering, Instability (Day 16+ Climate Models)
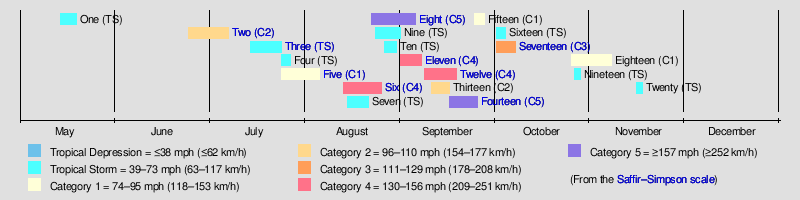
Category5Kaiju wrote:Just a friendly reminder that one of the most active NS seasons on record (most active ACE-wise) didn't really get going until late June/early July. In fact, assuming the talks that it could've produced more than 20 NSs given spotty records are true, then even if we were to get discount the May storm, then this season would've still ended up with at least 20 NSs.
https://upload.wikimedia.org/wikipedia/en/timeline/iwgq1m7qsr8z45t28iy0uk9g3fbxaex.png
TL;DR: even if we don't really see June activity this year, that wouldn't really tell us anything about how active the season will be later on. And given the -ENSO state, I'd wager that this season will extend into October and November.
There is little, if any, correlation between June activity and the final numbers. What we have is a discussion board about hurricanes, and naturally, the members want to see HURRICANES, especially intense hurricanes. So, every year, we get anxious about seasonal activity. Be patient; it will happen this year. It is a very different setup than last season. If SE Florida gets hit and you are looking for excitement, come over and help me prepare the house, be the last time you wish for a a hurricane after sweltering in the heat and hanging 63 panels. Seriously, it's going to be active, look at the analogs they are using to get their numbers; I think it's too high, but regardless, even a 25% reduction in the the total is a big season.
3 likes
Who is online
Users browsing this forum: JaviT and 170 guests