2024 Indicators: SST's, MSLP, Shear, SAL, Steering, Instability (Day 16+ Climate Models)
Moderator: S2k Moderators
Forum rules

The posts in this forum are NOT official forecasts and should not be used as such. They are just the opinion of the poster and may or may not be backed by sound meteorological data. They are NOT endorsed by any professional institution or STORM2K. For official information, please refer to products from the National Hurricane Center and National Weather Service.
-
Stratton23
- Category 5

- Posts: 3517
- Joined: Fri Jul 21, 2023 10:59 pm
- Location: Katy, Tx
Re: 2024 Indicators: SST's, MSLP, Shear, SAL, Steering, Instability (Day 16+ Climate Models)
Quality over quantity folks, less names but more powerful storms, im also expecting more activity to be focused in the western part of the basin with the MDR staying hostile , I could easily see several US threats, east coast but especially the gulf of mexico, I don’t think we are going to see many recurves from this point forward, we will just have to watch and see how it plays out
Last edited by Stratton23 on Mon Aug 19, 2024 4:34 pm, edited 1 time in total.
0 likes
-
weeniepatrol

- Category 5
- Posts: 1340
- Joined: Sat Aug 22, 2020 5:30 pm
- Location: WA State
Re: 2024 Indicators: SST's, MSLP, Shear, SAL, Steering, Instability (Day 16+ Climate Models)
Atlantic now has more hurricane days than the west and east pacific COMBINED btw.
4 likes
-
toad strangler

- S2K Supporter

- Posts: 4546
- Joined: Sun Jul 28, 2013 3:09 pm
- Location: Earth
- Contact:
Re: 2024 Indicators: SST's, MSLP, Shear, SAL, Steering, Instability (Day 16+ Climate Models)
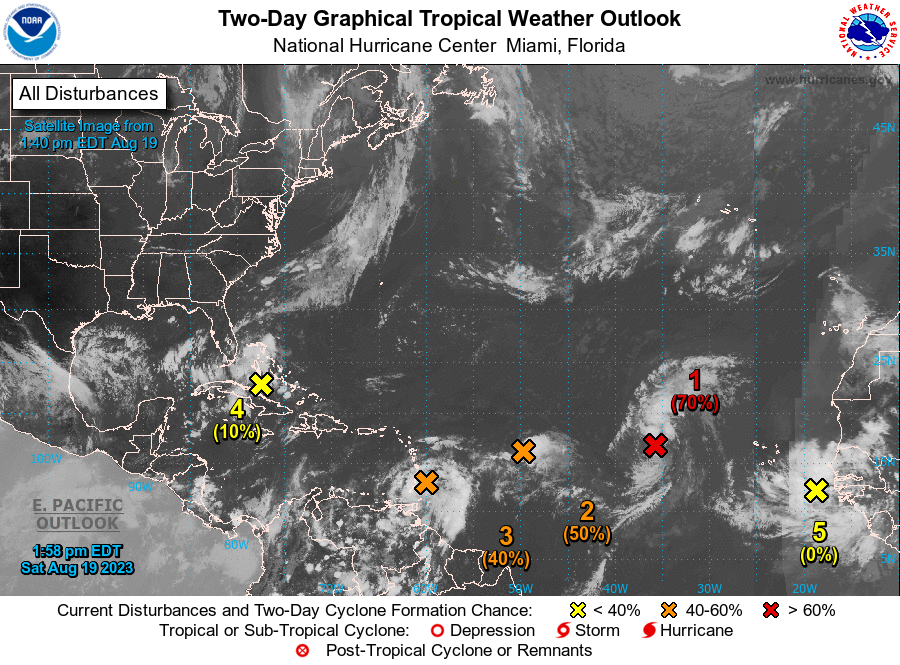
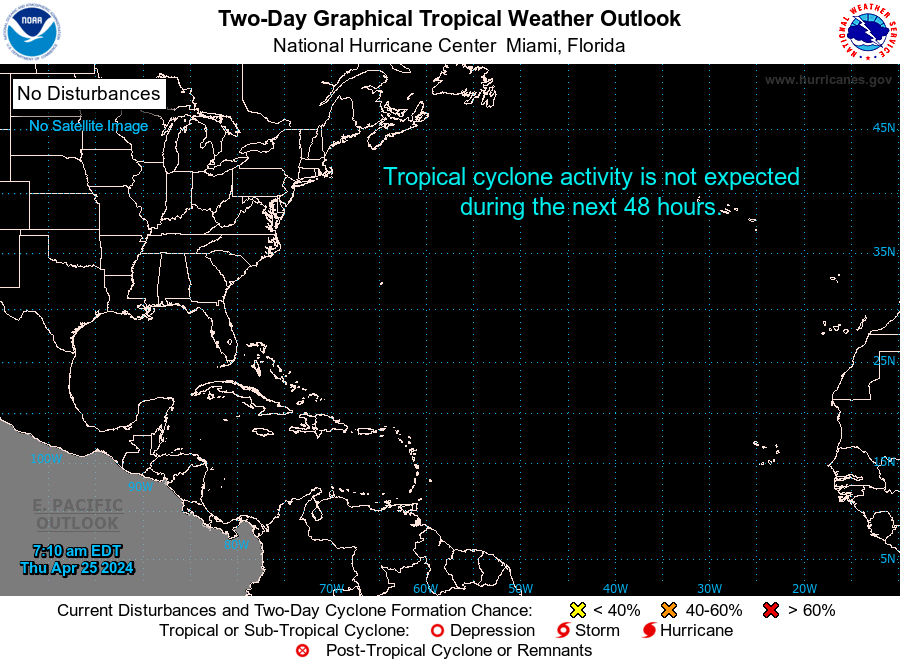
WiscoWx02 wrote:https://www.nhc.noaa.gov/archive/xgtwo/atl/202308191759/two_atl_2d0.png
https://www.nhc.noaa.gov/archive/xgtwo/atl/latest/two_atl_2d0.png
Hmmm....makes you wonder doesn't it? Of course we have Ernesto but if we didn't, talk about being tropically depressed!
No it doesn’t make me wonder at all. Tropical seasons do the snowflake thing. Never one like the other.
4 likes
My Weather Station
https://www.wunderground.com/dashboard/pws/KFLPORTS603
https://www.wunderground.com/dashboard/pws/KFLPORTS603

Re: 2024 Indicators: SST's, MSLP, Shear, SAL, Steering, Instability (Day 16+ Climate Models)
https://x.com/weatherman_aaa/status/1825581542996934882
https://x.com/SkyeW04/status/1825586698245321181
https://x.com/weatherman_aaa/status/1825032032281301129
https://x.com/SkyeW04/status/1825586698245321181
https://x.com/weatherman_aaa/status/1825032032281301129
0 likes
TC naming lists: retirements and intensity
Most aggressive Advisory #1's in North Atlantic (cr. kevin for starting the list)
Most aggressive Advisory #1's in North Atlantic (cr. kevin for starting the list)
-
Category5Kaiju

- Category 5
- Posts: 4330
- Joined: Thu Dec 24, 2020 12:45 pm
- Location: Seattle and Phoenix
Re: 2024 Indicators: SST's, MSLP, Shear, SAL, Steering, Instability (Day 16+ Climate Models)
Great post. Pretty much sums up my sentiments too.
0 likes
Unless explicitly stated, all info in my posts is based on my own opinions and observations. Tropical storms and hurricanes can be extremely dangerous. Refer to an accredited weather research agency or meteorologist if you need to make serious decisions regarding an approaching storm.
Re: 2024 Indicators: SST's, MSLP, Shear, SAL, Steering, Instability (Day 16+ Climate Models)
Here's what an NHC forecaster has to say.
https://x.com/EricBlake12/status/1825546425926902225
Also, as discussed in this thread, high-latitude waves can easily set the stage to help later waves - not just by moistening the tropics, but also warming it up:
https://x.com/EricBlake12/status/1825550118810222663
https://x.com/EricBlake12/status/1825546425926902225
Also, as discussed in this thread, high-latitude waves can easily set the stage to help later waves - not just by moistening the tropics, but also warming it up:
https://x.com/EricBlake12/status/1825550118810222663
2 likes
TC naming lists: retirements and intensity
Most aggressive Advisory #1's in North Atlantic (cr. kevin for starting the list)
Most aggressive Advisory #1's in North Atlantic (cr. kevin for starting the list)
Re: 2024 Indicators: SST's, MSLP, Shear, SAL, Steering, Instability (Day 16+ Climate Models)
I'll make this the last of my Twitter spams, but:
Here's a really interesting theory about the MDR so far in August. Apparently, conditions may be too favorable for their own good: there's so much anomalous easterlies that we're seeing easterly shear issues in the MDR, particularly in the southern regions that are less affected by SAL.
https://x.com/MichaelRLowry/status/1825653074066587868
But it doesn't end there -- Eric Blake and Andy Hazelton suggested that perhaps what's needed is for the MJO to move away! Furthermore, in recent hyperactive seasons, activity often picked up when the MJO moves from the "usually favorable" Phase 2 to the "usually unfavorable" Phase 4-5:
Of the hyperactive years I checked, only 2004 had MJO patterns in line with what you'd expect. It went from Phase 6-7 in mid-August (Charley) to Phase 8 by 8/23 or so (Frances), then Phase 1-2 in early September (Ivan) and Phase 2 by around 9/20 (Jeanne, Karl).
https://x.com/AndyHazelton/status/1825655284792008988
Here's a really interesting theory about the MDR so far in August. Apparently, conditions may be too favorable for their own good: there's so much anomalous easterlies that we're seeing easterly shear issues in the MDR, particularly in the southern regions that are less affected by SAL.
https://x.com/MichaelRLowry/status/1825653074066587868
But it doesn't end there -- Eric Blake and Andy Hazelton suggested that perhaps what's needed is for the MJO to move away! Furthermore, in recent hyperactive seasons, activity often picked up when the MJO moves from the "usually favorable" Phase 2 to the "usually unfavorable" Phase 4-5:
- 2010: MJO went from Phase 2 on 8/19 to Phase 5 on 8/26. Danielle and Earl formed on 8/21 and 8/25 respectively, and achieved Cat 4 intensity on 8/27 and 8/30 respectively.
- 2005: MJO was in Phase 1-2 in mid-August, but came back into the circle near the end of August, basically when Katrina formed. It then went very far in Phase 4-5 for at least the first half of September. When Rita formed, it was in Phase 6-7 quickly transitioning to Phase 8. (Between Katrina and Rita were a Cat 3 in the subtropics, three short-lived Cat 1s and a TS.)
- 2017: MJO was emerging slightly over Phase 2 during 8/24-28, during which Harvey bombed out. However, by the end of August, it had moved to Phase 4-5 though just within the circle. That's when Irma formed. During the subsequent period when MDR went into full action, the MJO went back into the circle and then Phase 4 again.
- 2020: MJO was in Phase 8-1 from 8/15 to the end of the month, coinciding with Laura. But during the outbreak between Paulette (9/7) and Beta (9/17), it was emerging over Phase 4.
Of the hyperactive years I checked, only 2004 had MJO patterns in line with what you'd expect. It went from Phase 6-7 in mid-August (Charley) to Phase 8 by 8/23 or so (Frances), then Phase 1-2 in early September (Ivan) and Phase 2 by around 9/20 (Jeanne, Karl).
https://x.com/AndyHazelton/status/1825655284792008988
Last edited by Teban54 on Mon Aug 19, 2024 6:05 pm, edited 3 times in total.
7 likes
TC naming lists: retirements and intensity
Most aggressive Advisory #1's in North Atlantic (cr. kevin for starting the list)
Most aggressive Advisory #1's in North Atlantic (cr. kevin for starting the list)

Re: 2024 Indicators: SST's, MSLP, Shear, SAL, Steering, Instability (Day 16+ Climate Models)
Even if you would completely take away Beryl, the Atlantic would still be 1 ACE point ahead of recent climatology. Ernesto and Debby on their own is a **normal** hurricane season start. Seasons take breaks sometimes. If we make it to Sep 1st with no real systems on the pipeline and the same look, then it'll be time to question what's happening.psyclone wrote:Category5Kaiju wrote:We’re at 54 ACE. The average for the Atlantic by now is 18. We also had a record breaking, Cape Verde-born Category 5 hurricane in early July.
That’s all I’m going to say for now.
I think the issue at this point becomes a question of
What have you done for me lately? As impressive as Beryl was it's fading into the rear view mirror and what's front and center now is a relative dearth of activity when we're entitled to plenty. The questions aren't absent merit. I remain a bull on the season but open to the idea of a downside surprise...which would still likely yield above normal activity.

6 likes
-
CyclonicFury

- Category 5
- Posts: 2032
- Age: 27
- Joined: Sun Jul 02, 2017 12:32 pm
- Location: NC
- Contact:
Re: 2024 Indicators: SST's, MSLP, Shear, SAL, Steering, Instability (Day 16+ Climate Models)
Teban54 wrote:I'll make this the last of my Twitter spams, but:
Here's a really interesting theory about the MDR so far in August. Apparently, conditions may be too favorable for their own good: there's so much anomalous easterlies that we're seeing easterly shear issues in the MDR, particularly in the southern regions that are less affected by SAL.
https://x.com/MichaelRLowry/status/1825653074066587868
But it doesn't end there -- Eric Blake and Andy Hazelton suggested that perhaps what's needed is for the MJO to move away! Furthermore, in recent hyperactive seasons, activity often picked up when the MJO moves from the "usually favorable" Phase 2 to the "usually unfavorable" Phase 4-5:I also checked 1995 due to that year's heavy MDR activity. It had a "standalone" early MDR storm Felix that formed on 8/8, when the MJO was in Phase 1-2; however, during the main MDR outbreak between Humberto (8/22) and Luis (8/28), the MJO was in the process of moving from the circle to Phase 3-4.
- 2010: MJO went from Phase 2 on 8/19 to Phase 5 on 8/26. Danielle and Earl formed on 8/21 and 8/25 respectively, and achieved Cat 4 intensity on 8/27 and 8/30 respectively.
- 2005: MJO was in Phase 1-2 in mid-August, but came back into the circle near the end of August, basically when Katrina formed. It then went very far in Phase 4-5 for at least the first half of September. When Rita formed, it was in Phase 6-7 quickly transitioning to Phase 8. (Between Katrina and Rita were a Cat 3 in the subtropics, three short-lived Cat 1s and a TS.)
- 2017: MJO was emerging slightly over Phase 2 during 8/24-28, during which Harvey bombed out. However, by the end of August, it had moved to Phase 4-5 though just within the circle. That's when Irma formed. During the subsequent period when MDR went into full action, the MJO went back into the circle and then Phase 4 again.
- 2020: MJO was in Phase 8-1 from 8/15 to the end of the month, coinciding with Laura. But during the outbreak between Paulette (9/7) and Beta (9/17), it was emerging over Phase 4.
Of the hyperactive years I checked, only 2004 had MJO patterns in line with what you'd expect. It went from Phase 6-7 in mid-August (Charley) to Phase 8 by 8/23 or so (Frances), then Phase 1-2 in early September (Ivan) and Phase 2 by around 9/20 (Jeanne, Karl).
https://x.com/AndyHazelton/status/1825655284792008988
With how strong easterly shear has been and how far north the African monsoon trough has been so far this season, it makes me wonder if the CV season could be delayed compared to normal, with the potential of Cape Verde type hurricanes into October. As the AEJ weakens and the shear vector transitions to more westerly, the MDR could become more favorable later than normal. As we saw with Sean and Tammy last year, MDR TCG during October is a legit possibility. The issue in the MDR during October has always been upper-level winds, not thermodynamics - in fact, October's thermodynamics are arguably the most favorable in the MDR with practically no SAL, and the climo peak of SSTs and instability.
4 likes
NCSU B.S. in Meteorology Class of 2021. Tropical weather blogger at http://www.cyclonicfury.com. My forecasts and thoughts are NOT official, for official forecasts please consult the National Hurricane Center.
-
Category5Kaiju
- Category 5
- Posts: 4330
- Joined: Thu Dec 24, 2020 12:45 pm
- Location: Seattle and Phoenix
Re: 2024 Indicators: SST's, MSLP, Shear, SAL, Steering, Instability (Day 16+ Climate Models)
CyclonicFury wrote:Teban54 wrote:I'll make this the last of my Twitter spams, but:
Here's a really interesting theory about the MDR so far in August. Apparently, conditions may be too favorable for their own good: there's so much anomalous easterlies that we're seeing easterly shear issues in the MDR, particularly in the southern regions that are less affected by SAL.
https://x.com/MichaelRLowry/status/1825653074066587868
But it doesn't end there -- Eric Blake and Andy Hazelton suggested that perhaps what's needed is for the MJO to move away! Furthermore, in recent hyperactive seasons, activity often picked up when the MJO moves from the "usually favorable" Phase 2 to the "usually unfavorable" Phase 4-5:I also checked 1995 due to that year's heavy MDR activity. It had a "standalone" early MDR storm Felix that formed on 8/8, when the MJO was in Phase 1-2; however, during the main MDR outbreak between Humberto (8/22) and Luis (8/28), the MJO was in the process of moving from the circle to Phase 3-4.
- 2010: MJO went from Phase 2 on 8/19 to Phase 5 on 8/26. Danielle and Earl formed on 8/21 and 8/25 respectively, and achieved Cat 4 intensity on 8/27 and 8/30 respectively.
- 2005: MJO was in Phase 1-2 in mid-August, but came back into the circle near the end of August, basically when Katrina formed. It then went very far in Phase 4-5 for at least the first half of September. When Rita formed, it was in Phase 6-7 quickly transitioning to Phase 8. (Between Katrina and Rita were a Cat 3 in the subtropics, three short-lived Cat 1s and a TS.)
- 2017: MJO was emerging slightly over Phase 2 during 8/24-28, during which Harvey bombed out. However, by the end of August, it had moved to Phase 4-5 though just within the circle. That's when Irma formed. During the subsequent period when MDR went into full action, the MJO went back into the circle and then Phase 4 again.
- 2020: MJO was in Phase 8-1 from 8/15 to the end of the month, coinciding with Laura. But during the outbreak between Paulette (9/7) and Beta (9/17), it was emerging over Phase 4.
Of the hyperactive years I checked, only 2004 had MJO patterns in line with what you'd expect. It went from Phase 6-7 in mid-August (Charley) to Phase 8 by 8/23 or so (Frances), then Phase 1-2 in early September (Ivan) and Phase 2 by around 9/20 (Jeanne, Karl).
https://x.com/AndyHazelton/status/1825655284792008988
With how strong easterly shear has been and how far north the African monsoon trough has been so far this season, it makes me wonder if the CV season could be delayed compared to normal, with the potential of Cape Verde type hurricanes into October. As the AEJ weakens and the shear vector transitions to more westerly, the MDR could become more favorable later than normal. As we saw with Sean and Tammy last year, MDR TCG during October is a legit possibility. The issue in the MDR during October has always been upper-level winds, not thermodynamics - in fact, October's thermodynamics are arguably the most favorable in the MDR with practically no SAL, and the climo peak of SSTs and instability.
Legit possibility imho, Sam, Georges, and Inez have happened after all.
0 likes
Unless explicitly stated, all info in my posts is based on my own opinions and observations. Tropical storms and hurricanes can be extremely dangerous. Refer to an accredited weather research agency or meteorologist if you need to make serious decisions regarding an approaching storm.

Re: 2024 Indicators: SST's, MSLP, Shear, SAL, Steering, Instability (Day 16+ Climate Models)
CyclonicFury wrote:Teban54 wrote:I'll make this the last of my Twitter spams, but:
Here's a really interesting theory about the MDR so far in August. Apparently, conditions may be too favorable for their own good: there's so much anomalous easterlies that we're seeing easterly shear issues in the MDR, particularly in the southern regions that are less affected by SAL.
https://x.com/MichaelRLowry/status/1825653074066587868
But it doesn't end there -- Eric Blake and Andy Hazelton suggested that perhaps what's needed is for the MJO to move away! Furthermore, in recent hyperactive seasons, activity often picked up when the MJO moves from the "usually favorable" Phase 2 to the "usually unfavorable" Phase 4-5:I also checked 1995 due to that year's heavy MDR activity. It had a "standalone" early MDR storm Felix that formed on 8/8, when the MJO was in Phase 1-2; however, during the main MDR outbreak between Humberto (8/22) and Luis (8/28), the MJO was in the process of moving from the circle to Phase 3-4.
- 2010: MJO went from Phase 2 on 8/19 to Phase 5 on 8/26. Danielle and Earl formed on 8/21 and 8/25 respectively, and achieved Cat 4 intensity on 8/27 and 8/30 respectively.
- 2005: MJO was in Phase 1-2 in mid-August, but came back into the circle near the end of August, basically when Katrina formed. It then went very far in Phase 4-5 for at least the first half of September. When Rita formed, it was in Phase 6-7 quickly transitioning to Phase 8. (Between Katrina and Rita were a Cat 3 in the subtropics, three short-lived Cat 1s and a TS.)
- 2017: MJO was emerging slightly over Phase 2 during 8/24-28, during which Harvey bombed out. However, by the end of August, it had moved to Phase 4-5 though just within the circle. That's when Irma formed. During the subsequent period when MDR went into full action, the MJO went back into the circle and then Phase 4 again.
- 2020: MJO was in Phase 8-1 from 8/15 to the end of the month, coinciding with Laura. But during the outbreak between Paulette (9/7) and Beta (9/17), it was emerging over Phase 4.
Of the hyperactive years I checked, only 2004 had MJO patterns in line with what you'd expect. It went from Phase 6-7 in mid-August (Charley) to Phase 8 by 8/23 or so (Frances), then Phase 1-2 in early September (Ivan) and Phase 2 by around 9/20 (Jeanne, Karl).
https://x.com/AndyHazelton/status/1825655284792008988
With how strong easterly shear has been and how far north the African monsoon trough has been so far this season, it makes me wonder if the CV season could be delayed compared to normal, with the potential of Cape Verde type hurricanes into October. As the AEJ weakens and the shear vector transitions to more westerly, the MDR could become more favorable later than normal. As we saw with Sean and Tammy last year, MDR TCG during October is a legit possibility. The issue in the MDR during October has always been upper-level winds, not thermodynamics - in fact, October's thermodynamics are arguably the most favorable in the MDR with practically no SAL, and the climo peak of SSTs and instability.
If that’s the case, then I could see the “hyper MDR season” and “200+ ACE” forecasts busting. Maybe we may end up with numbers closer to 2010 thanks to the wave train currently handicapping itself. Heck, maybe we “only” get 15-18 NS with a very high ACE-per-storm like 1996, since the background state this year doesn’t seem to favor shorties.
If the issues we’re seeing now persist into September and the season falls well below NS and ACE forecasts, it’ll be interesting to go back and re-assess how favorable an indicator can be before it ends up starting to inhibit activity. Or this is nothing but a typical pre-September dry spell that gets people antsy before the basin lights up and we end up with yet another active year close to or exceeding forecasts.
2 likes
Irene '11 Sandy '12 Hermine '16 5/15/2018 Derecho Fay '20 Isaias '20 Elsa '21 Henri '21 Ida '21
I am only a meteorology enthusiast who knows a decent amount about tropical cyclones. Look to the professional mets, the NHC, or your local weather office for the best information.
I am only a meteorology enthusiast who knows a decent amount about tropical cyclones. Look to the professional mets, the NHC, or your local weather office for the best information.
-
toad strangler
- S2K Supporter
- Posts: 4546
- Joined: Sun Jul 28, 2013 3:09 pm
- Location: Earth
- Contact:
Re: 2024 Indicators: SST's, MSLP, Shear, SAL, Steering, Instability (Day 16+ Climate Models)
aspen wrote:CyclonicFury wrote:Teban54 wrote:I'll make this the last of my Twitter spams, but:
Here's a really interesting theory about the MDR so far in August. Apparently, conditions may be too favorable for their own good: there's so much anomalous easterlies that we're seeing easterly shear issues in the MDR, particularly in the southern regions that are less affected by SAL.
https://x.com/MichaelRLowry/status/1825653074066587868
But it doesn't end there -- Eric Blake and Andy Hazelton suggested that perhaps what's needed is for the MJO to move away! Furthermore, in recent hyperactive seasons, activity often picked up when the MJO moves from the "usually favorable" Phase 2 to the "usually unfavorable" Phase 4-5:I also checked 1995 due to that year's heavy MDR activity. It had a "standalone" early MDR storm Felix that formed on 8/8, when the MJO was in Phase 1-2; however, during the main MDR outbreak between Humberto (8/22) and Luis (8/28), the MJO was in the process of moving from the circle to Phase 3-4.
- 2010: MJO went from Phase 2 on 8/19 to Phase 5 on 8/26. Danielle and Earl formed on 8/21 and 8/25 respectively, and achieved Cat 4 intensity on 8/27 and 8/30 respectively.
- 2005: MJO was in Phase 1-2 in mid-August, but came back into the circle near the end of August, basically when Katrina formed. It then went very far in Phase 4-5 for at least the first half of September. When Rita formed, it was in Phase 6-7 quickly transitioning to Phase 8. (Between Katrina and Rita were a Cat 3 in the subtropics, three short-lived Cat 1s and a TS.)
- 2017: MJO was emerging slightly over Phase 2 during 8/24-28, during which Harvey bombed out. However, by the end of August, it had moved to Phase 4-5 though just within the circle. That's when Irma formed. During the subsequent period when MDR went into full action, the MJO went back into the circle and then Phase 4 again.
- 2020: MJO was in Phase 8-1 from 8/15 to the end of the month, coinciding with Laura. But during the outbreak between Paulette (9/7) and Beta (9/17), it was emerging over Phase 4.
Of the hyperactive years I checked, only 2004 had MJO patterns in line with what you'd expect. It went from Phase 6-7 in mid-August (Charley) to Phase 8 by 8/23 or so (Frances), then Phase 1-2 in early September (Ivan) and Phase 2 by around 9/20 (Jeanne, Karl).
https://x.com/AndyHazelton/status/1825655284792008988
With how strong easterly shear has been and how far north the African monsoon trough has been so far this season, it makes me wonder if the CV season could be delayed compared to normal, with the potential of Cape Verde type hurricanes into October. As the AEJ weakens and the shear vector transitions to more westerly, the MDR could become more favorable later than normal. As we saw with Sean and Tammy last year, MDR TCG during October is a legit possibility. The issue in the MDR during October has always been upper-level winds, not thermodynamics - in fact, October's thermodynamics are arguably the most favorable in the MDR with practically no SAL, and the climo peak of SSTs and instability.
If that’s the case, then I could see the “hyper MDR season” and “200+ ACE” forecasts busting. Maybe we may end up with numbers closer to 2010 thanks to the wave train currently handicapping itself. Heck, maybe we “only” get 15-18 NS with a very high ACE-per-storm like 1996, since the background state this year doesn’t seem to favor shorties.
If the issues we’re seeing now persist into September and the season falls well below NS and ACE forecasts, it’ll be interesting to go back and re-assess how favorable an indicator can be before it ends up starting to inhibit activity. Or this is nothing but a typical pre-September dry spell that gets people antsy before the basin lights up and we end up with yet another active year close to or exceeding forecasts.
Growing up in the North East I fondly recall wide ranging thoughts like this as equal to a dusting to a foot snowfall forecast
With all that has been hand wrung about the past week we still find ourselves just now about to enter the beginning of climatological peak season. Either way we will all know pretty soon. Many of us have tried to stress that it will take just normal activity here on out to reach the minimum hyperactive threshold. That realistic possibility is getting lost in the noise!
0 likes
My Weather Station
https://www.wunderground.com/dashboard/pws/KFLPORTS603
https://www.wunderground.com/dashboard/pws/KFLPORTS603

Re: 2024 Indicators: SST's, MSLP, Shear, SAL, Steering, Instability (Day 16+ Climate Models)
It's the CFS but it's within the 16 day frame so not sure where to best put this, but since I'm talking about the longer run I'll put it here
00z CFS (the 12z is confusingly less active on a consistent basis and this doesn't seem new) has at least six storms in the map area, along with a possible seventh in the Gulf near the end of the month (it's closed and doesn't move so could be picking up something) which would put no less than two active storms by month's end.
To summarize Pivotal Weather's run, there is a storm that enters the map on the 29th north of the Caribbean, and the GoM low; a second near the Caribbean on Sep 3, a storm in the central Atlantic on Sep 7, and two more storms in the NE Atlantic that enter from the south (think Ivan-1998 type track) on Sep 16 and 20. This is in addition to a storm in the eastern Gulf around mid-September. IF this run plays out (these change run to run of course, but this can be a good indicator) that would put us at 12 by the end of September--only one storm off from 2017's numbers by then. And this model doesn't pick up smaller or weaker storms very well (the resolution seems low, the strongest storms don't usually go below the mid-990s, Ernesto is 994mb on this model for instance)
Weather Online isn't loading at the moment but checking it last night (the same 00z model) had 3-4 MDR storms forming after the 26th
5 likes
The above post is not official and should not be used as such. It is the opinion of the poster and may or may not be backed by sound meteorological data. It is not endorsed by any professional institution or storm2k.org. For official information, please refer to the NHC and NWS products.
-
MarioProtVI
- Category 5
- Posts: 1034
- Age: 24
- Joined: Sun Sep 29, 2019 7:33 pm
- Location: New Jersey
Re: 2024 Indicators: SST's, MSLP, Shear, SAL, Steering, Instability (Day 16+ Climate Models)
aspen wrote:
<snip>
If that’s the case, then I could see the “hyper MDR season” and “200+ ACE” forecasts busting. Maybe we may end up with numbers closer to 2010 thanks to the wave train currently handicapping itself. Heck, maybe we “only” get 15-18 NS with a very high ACE-per-storm like 1996, since the background state this year doesn’t seem to favor shorties.
If the issues we’re seeing now persist into September and the season falls well below NS and ACE forecasts, it’ll be interesting to go back and re-assess how favorable an indicator can be before it ends up starting to inhibit activity. Or this is nothing but a typical pre-September dry spell that gets people antsy before the basin lights up and we end up with yet another active year close to or exceeding forecasts.
If we repeated 2010 here on out we’d still end up over 200 ACE (we’re at 55 right now and 2010’s ACE was like ~155 post-8/19). So even if we have a 2010 repeat instead of 2017 the forecasts would still pretty much verify ACE wise (named storms maybe not so).
1 likes
Re: 2024 Indicators: SST's, MSLP, Shear, SAL, Steering, Instability (Day 16+ Climate Models)
MarioProtVI wrote:aspen wrote:
<snip>
If that’s the case, then I could see the “hyper MDR season” and “200+ ACE” forecasts busting. Maybe we may end up with numbers closer to 2010 thanks to the wave train currently handicapping itself. Heck, maybe we “only” get 15-18 NS with a very high ACE-per-storm like 1996, since the background state this year doesn’t seem to favor shorties.
If the issues we’re seeing now persist into September and the season falls well below NS and ACE forecasts, it’ll be interesting to go back and re-assess how favorable an indicator can be before it ends up starting to inhibit activity. Or this is nothing but a typical pre-September dry spell that gets people antsy before the basin lights up and we end up with yet another active year close to or exceeding forecasts.
If we repeated 2010 here on out we’d still end up over 200 ACE (we’re at 55 right now and 2010’s ACE was like ~155 post-8/19). So even if we have a 2010 repeat instead of 2017 the forecasts would still pretty much verify ACE wise (named storms maybe not so).
You’re right, I didn’t realize we already flew past 50 ACE. But I was mainly thinking of 2010-like numbers for the season as a whole, including our current 55 ACE. However, our head start should mean ~150-160 ACE (close to 1996/2010) is the lowest we could possibly go unless we see a fairly tame September.
Last edited by aspen on Mon Aug 19, 2024 9:06 pm, edited 1 time in total.
0 likes
Irene '11 Sandy '12 Hermine '16 5/15/2018 Derecho Fay '20 Isaias '20 Elsa '21 Henri '21 Ida '21
I am only a meteorology enthusiast who knows a decent amount about tropical cyclones. Look to the professional mets, the NHC, or your local weather office for the best information.
I am only a meteorology enthusiast who knows a decent amount about tropical cyclones. Look to the professional mets, the NHC, or your local weather office for the best information.
-
AnnularCane
- S2K Supporter
- Posts: 2957
- Joined: Thu Jun 08, 2006 9:18 am
- Location: Wytheville, VA
Re: 2024 Indicators: SST's, MSLP, Shear, SAL, Steering, Instability (Day 16+ Climate Models)
It's probably not quite the same situation, but lately this season is giving me May 31, 1985 vibes.
1 likes
"But it never rained rain. It never snowed snow. And it never blew just wind. It rained things like soup and juice. It snowed mashed potatoes and green peas. And sometimes the wind blew in storms of hamburgers." -- Judi Barrett, Cloudy with a Chance of Meatballs

Re: 2024 Indicators: SST's, MSLP, Shear, SAL, Steering, Instability (Day 16+ Climate Models)
Hmmm, i'm trying to remember exactly how dry January 8, 2024 CANNSIPS Atlantic Precip Anomaly August forecast was depicted for the MDR, Caribbean and Greater Antilles 
0 likes
Andy D
(For official information, please refer to the NHC and NWS products.)
(For official information, please refer to the NHC and NWS products.)
Re: 2024 Indicators: SST's, MSLP, Shear, SAL, Steering, Instability (Day 16+ Climate Models)
chaser1 wrote:Hmmm, i'm trying to remember exactly how dry January 8, 2024 CANNSIPS Atlantic Precip Anomaly August forecast was depicted for the MDR, Caribbean and Greater Antilles
Found the end of the month one, it's still up

0 likes
The above post is not official and should not be used as such. It is the opinion of the poster and may or may not be backed by sound meteorological data. It is not endorsed by any professional institution or storm2k.org. For official information, please refer to the NHC and NWS products.
Re: 2024 Indicators: SST's, MSLP, Shear, SAL, Steering, Instability (Day 16+ Climate Models)
Hammy wrote:chaser1 wrote:Hmmm, i'm trying to remember exactly how dry January 8, 2024 CANNSIPS Atlantic Precip Anomaly August forecast was depicted for the MDR, Caribbean and Greater Antilles
Found the end of the month one, it's still up https://i.imgur.com/xGgx13e.png
Thanks Hammy. Whelp, I'd say that it's somewhat debatable as to whether "that" forecast verified.
0 likes
Andy D
(For official information, please refer to the NHC and NWS products.)
(For official information, please refer to the NHC and NWS products.)
-
Hurricane2022

- Category 5
- Posts: 2016
- Joined: Tue Aug 23, 2022 11:38 pm
- Location: Araçatuba, Brazil
Re: 2024 Indicators: SST's, MSLP, Shear, SAL, Steering, Instability (Day 16+ Climate Models)
chaser1 wrote:Hammy wrote:chaser1 wrote:Hmmm, i'm trying to remember exactly how dry January 8, 2024 CANNSIPS Atlantic Precip Anomaly August forecast was depicted for the MDR, Caribbean and Greater Antilles
Found the end of the month one, it's still up https://i.imgur.com/xGgx13e.png
Thanks Hammy. Whelp, I'd say that it's somewhat debatable as to whether "that" forecast verified.
Yeah but August hasn't ended yet!
1 likes
Sorry for the bad English sometimes...!
For reliable and detailed information for any meteorological phenomenon, please consult the National Hurricane Center, Joint Typhoon Warning Center , or your local Meteo Center.
--------
ECCE OMNIA NOVA FACIAM (Ap 21,5).
For reliable and detailed information for any meteorological phenomenon, please consult the National Hurricane Center, Joint Typhoon Warning Center , or your local Meteo Center.
--------
ECCE OMNIA NOVA FACIAM (Ap 21,5).
Who is online
Users browsing this forum: ljmac75 and 158 guests