

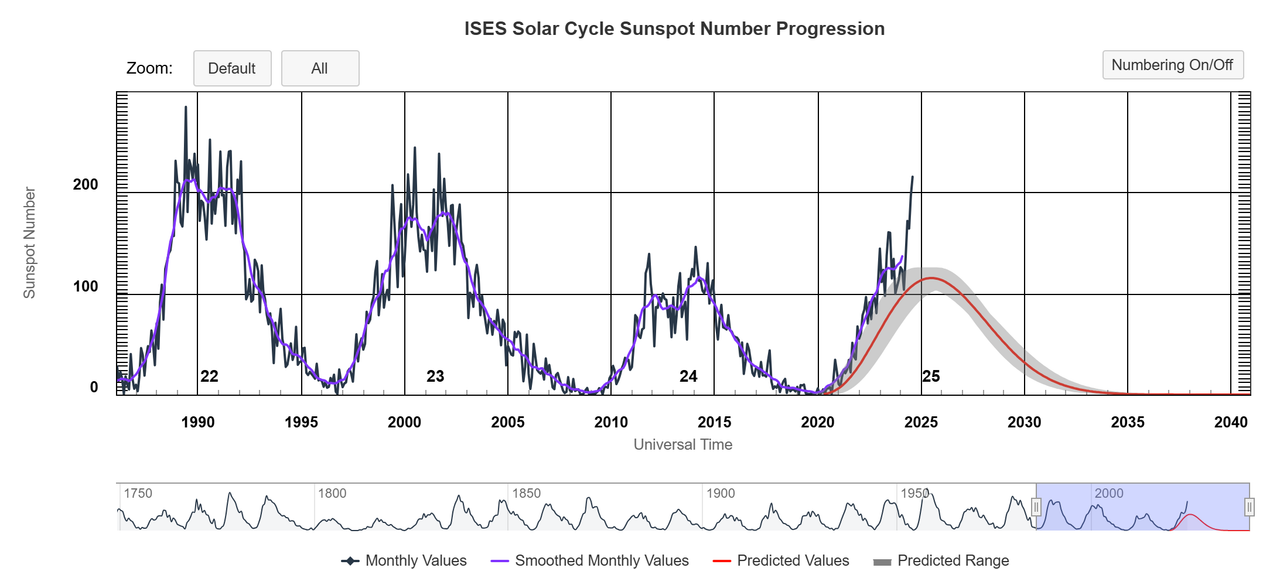
IcyTundra wrote:LarryWx wrote:What about the current very active sunspots and a possible lag to consider as possibly one of the main factors keeping things quiet recently? Aug of 2024 had a 216, the highest mean sunspots in Aug since 1991. That means that this Aug had the highest mean for Aug of the current active era so far.
https://www.sidc.be/SILSO/DATA/SN_m_tot_V2.0.txt
Per met. Joe D’Aleo:
“We have mentioned the strong solar spike which research has shown can suppress hurricane activity.”
“One negative may be the big spike in solar in cycle 25. Most cycles have had a dual max and recent ones had the second one higher. This warms the upper atmosphere and hampers development.”
Is there any papers that discuss any potential connection between solar activity and hurricane seasons? I've seen a few people mention this as a possibility but it seems like most mets believe there is no connection. I am personally skeptical but would be interesting to hear an argument that supports it.
D’Aleo seems to know of something. Regardless, I decided to look at the data, myself:
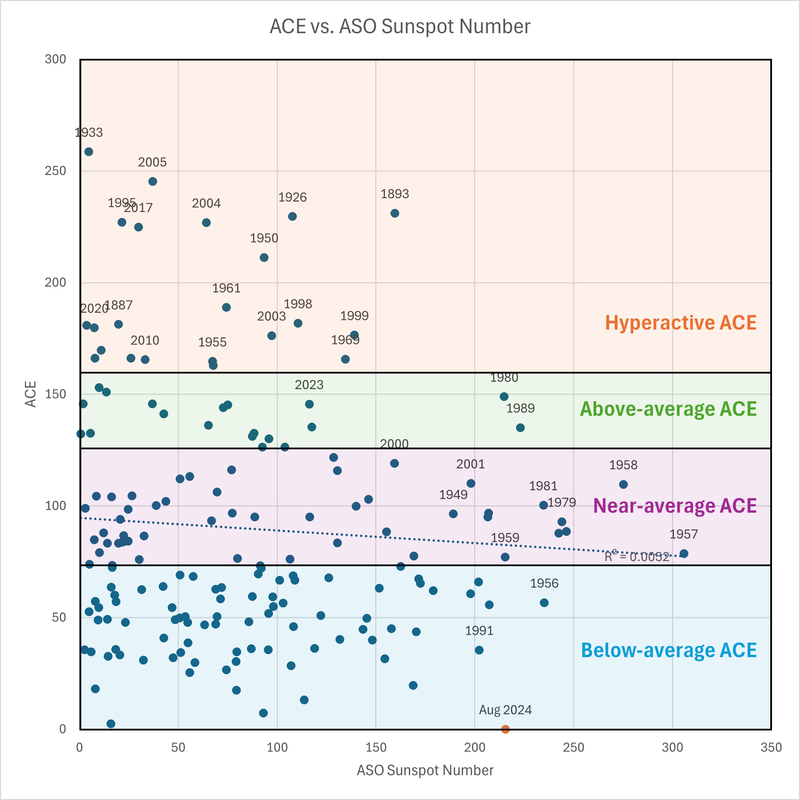
Here are the 13 ATL seasons since 1851 with 180+ ACE along with ASO averaged monthly sunspots:
1878: 5 (solar min)
1887: 20 (quiet)
1893: 160 (solar max)
1926: 110 (1.5 yrs before max)
1933: 5 (min)
1950: 95 (halfway from max to min)
1961: 75 (halfway from max to min)
1995: 20 (nearing min)
1998: 110 (2 years after min)
2004: 65 (3 years after max)
2005: 35 (quiet/3 years before min)
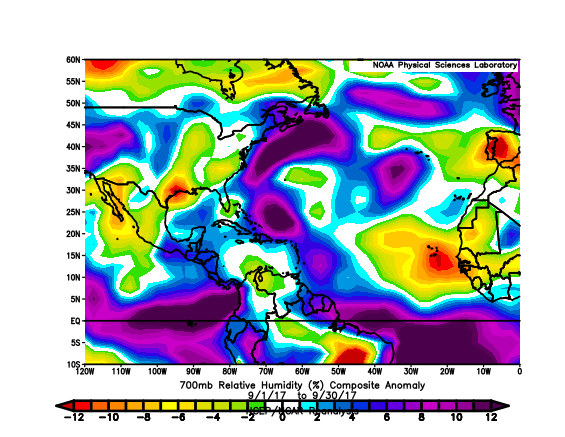
2017: 30 (quiet/2 years before min)
2020: 10 (just after min)
So, of the 13 180+ ACE seasons, 7 had low sunspots, 3 had near avg, and 3 had above avg. though only one of those 3 had well above avg (1893) like 2024. And 2024 has an excellent shot at exceeding the 160 of 1893 since Aug was 215. It could end up near 200 for all we know now. I’d say 175+ is pretty safe. Only 1 in 9 seasons have had 175+ ASO sunspots.
The avg monthly of these 13 seasons’ ASO sunspots was only ~55, which is well under the 1900-2022 avg of ~85 for all months. So, this at least suggests the possibility that very high ACE seasons really do prefer a not so overly active sun unlike what we have now.
Also consider this: Whereas none of the 15 non-El Nino seasons with 175+ ASO sunspots had 150+ ACE, five of the 13 non-El Nino (38%) 10- sunspot seasons had 150+ ACE.
That may mean it is going to be difficult for 2024 or a typical future year with ASO sunspots >175 to get to 175+ ACE (or maybe even just 150+ ACE) despite other very favorable factors like La Niña and near record warm Atlantic MDR SSTs.
Thus I think the research that D’Aleo mentioned about the tendency for a strong solar spike to hamper hurricane activity via a lowering of instability due to warming of the upper atmosphere should be investigated further as quite possibly being one of the main reasons for the recent quiet. I read elsewhere about the upper atmosphere being quite warm.
Solar data: https://www.sidc.be/SILSO/DATA/SN_m_tot_V2.0.txt
ACE: https://en.m.wikipedia.org/wiki/Accumul ... one_energy
@chaser1


