2024 Indicators: SST's, MSLP, Shear, SAL, Steering, Instability (Day 16+ Climate Models)

This is the general tropical discussion area. Anyone can take their shot at predicting a storms path.

Moderator: S2k Moderators

Forum rules

The posts in this forum are NOT official forecasts and should not be used as such. They are just the opinion of the poster and may or may not be backed by sound meteorological data. They are NOT endorsed by any professional institution or STORM2K. For official information, please refer to products from the National Hurricane Center and National Weather Service.

Help Support Storm2K
Message
Author
al78
Professional-Met
Professional-Met
Posts: 332
Joined: Thu Nov 01, 2018 12:20 pm

Re: 2024 Indicators: SST's, MSLP, Shear, SAL, Steering, Instability (Day 16+ Climate Models)

#2401 Postby al78 » Wed Sep 04, 2024 10:47 am

jlauderdal wrote:
chaser1 wrote:


Thank you for the heads-up! Will enjoy the read in the morning (well, the part of the morning that includes daylight :wink: )

They are doing everything but raising the white flag, they are throwing out the same ideas we have already been hearing for a few weeks now, but honestly, they are educated guesses at best. It will take far more analysis than anything that can be done during the season and we may never see complete answer. This season will affect yearly forecasts for the foreseeable future, expect something very conservative next year regardless of what their analysis leads them to put out. It's embarrassing to the research community, and those looking for funding will have some serious explaining to do for the next round. See something, say something for the rest of the season, keep looking at models but until you see something actually developing, there isnt anything regardless of model agreement.


If that attitude is widespread I find it very disappointing. If anything, a major forecast bust should increase the incentive for further research to reduce the chance of it happening again. In the UK in October 1987 our Met Office failed to predict an extremely damaging billion pound loss windstorm and they were heavily vilified for it. That forecast bust, however, led to further research on cyclogenesis and extreme winds and the phenomena known as sting jets was discovered, and now forecasters know what to look for in a developing windstorm to identify the formation of a sting jet and the likelihood of extreme near-surface gusts.

https://theconversation.com/sting-jet-t ... inds-85620

Ultimately meteorology is not an exact science and expecting superb predictions all the time is unrealistic. Forecasts are probabilistic by nature, the deterministic forecast can be viewed as the most-likely outcome, but inherent uncertainty means the actual outcome may be better or worse than predicted, the probability decreasing the further away from the deterministic forecast you go. With the 2024 hurricane season forecasts, even though all agencies were predicting a hyper-active season, there was never a zero probability of an above-average but not hyper-active, or even a near average season, it is just these outcomes were much less likely given the known teleconnections prior to peak season. If I see the same Nino state and tropical Atlantic SSTs next year and we have a hurricane in the MDR in June/July I will almost certainly make the same prediction as I did this year, and I will make the same statement in the confidence/uncertainties section of the forecast document that unpredictable intra-seasonal factors may result in a less active season.
1 likes   

User avatar
toad strangler
S2K Supporter
S2K Supporter
Posts: 4543
Joined: Sun Jul 28, 2013 3:09 pm
Location: Earth
Contact:

Re: 2024 Indicators: SST's, MSLP, Shear, SAL, Steering, Instability (Day 16+ Climate Models)

#2402 Postby toad strangler » Thu Sep 05, 2024 12:25 pm

For those keeping score on ACE this weirdo season.. CREDIT: Weather Tiger .... The model as fallen off to ABOVE NORMAL best chance from hyperactive.

Image
0 likes   

User avatar
Spacecoast
Category 2
Category 2
Posts: 758
Joined: Thu Aug 31, 2017 2:03 pm

Re: 2024 Indicators: SST's, MSLP, Shear, SAL, Steering, Instability (Day 16+ Climate Models)

#2403 Postby Spacecoast » Thu Sep 05, 2024 4:39 pm

EPS Weekly for Oct showing that 'October' pattern.....
Image
Coincidentally...
Image
2 likes   

User avatar
Teban54
Category 5
Category 5
Posts: 3204
Joined: Sat May 19, 2018 1:19 pm

Re: 2024 Indicators: SST's, MSLP, Shear, SAL, Steering, Instability (Day 16+ Climate Models)

#2404 Postby Teban54 » Thu Sep 05, 2024 7:24 pm

 https://x.com/dmorris9661/status/1831796309034221830


Several Euro weeklies follow in the thread. The 4th week seems particularly interesting, as it not only shows a very late CV season, but also tracks that are much further south than you'd expect for late September:

 https://x.com/dmorris9661/status/1831796309034221830

0 likes   

LarryWx
S2K Supporter
S2K Supporter
Posts: 6304
Joined: Sun Sep 07, 2003 2:04 pm
Location: GA

Re: 2024 Indicators: SST's, MSLP, Shear, SAL, Steering, Instability (Day 16+ Climate Models)

#2405 Postby LarryWx » Thu Sep 05, 2024 9:05 pm

Spacecoast wrote:EPS Weekly for Oct showing that 'October' pattern.....
https://i.ibb.co/9cYXgXQ/ecprobb.jpg
Coincidentally...
https://i.ibb.co/jrjVr8W/clim.jpg


The mean ACE prog for that week, Sep 30-Oct 6, is for a whopping 160% of 2004-2023 climo! That’s the highest % for any week in quite awhile. That equates to an ACE that week of 15, which is just one below the 2004-23 averaged ACE at the peak week of 9/9-15. The week prior (Sep 23-29) also is progged at 15 (120% of climo). So, this run is essentially predicting the equivalent of peak climo during a period who’s actual climo is already well under peak climo.
0 likes   
Personal Forecast Disclaimer:
The posts in this forum are NOT official forecasts and should not be used as such. They are just the opinion of the poster and may or may not be backed by sound meteorological data. They are NOT endorsed by any professional institution or storm2k.org. For official information, please refer to the NHC and NWS products.

LarryWx
S2K Supporter
S2K Supporter
Posts: 6304
Joined: Sun Sep 07, 2003 2:04 pm
Location: GA

Re: 2024 Indicators: SST's, MSLP, Shear, SAL, Steering, Instability (Day 16+ Climate Models)

#2406 Postby LarryWx » Thu Sep 05, 2024 9:52 pm

Followup: CPC Aug NAO came in at +0.63, about where I expected it. So, despite that other version of Aug NAO being at a record high for it (over +3!), this one was only moderately positive. Many have been much higher with the Aug record high way up at +1.97.

https://www.cpc.ncep.noaa.gov/products/ ... scii.table
1 likes   
Personal Forecast Disclaimer:
The posts in this forum are NOT official forecasts and should not be used as such. They are just the opinion of the poster and may or may not be backed by sound meteorological data. They are NOT endorsed by any professional institution or storm2k.org. For official information, please refer to the NHC and NWS products.

User avatar
Teban54
Category 5
Category 5
Posts: 3204
Joined: Sat May 19, 2018 1:19 pm

Re: 2024 Indicators: SST's, MSLP, Shear, SAL, Steering, Instability (Day 16+ Climate Models)

#2407 Postby Teban54 » Thu Sep 05, 2024 9:58 pm

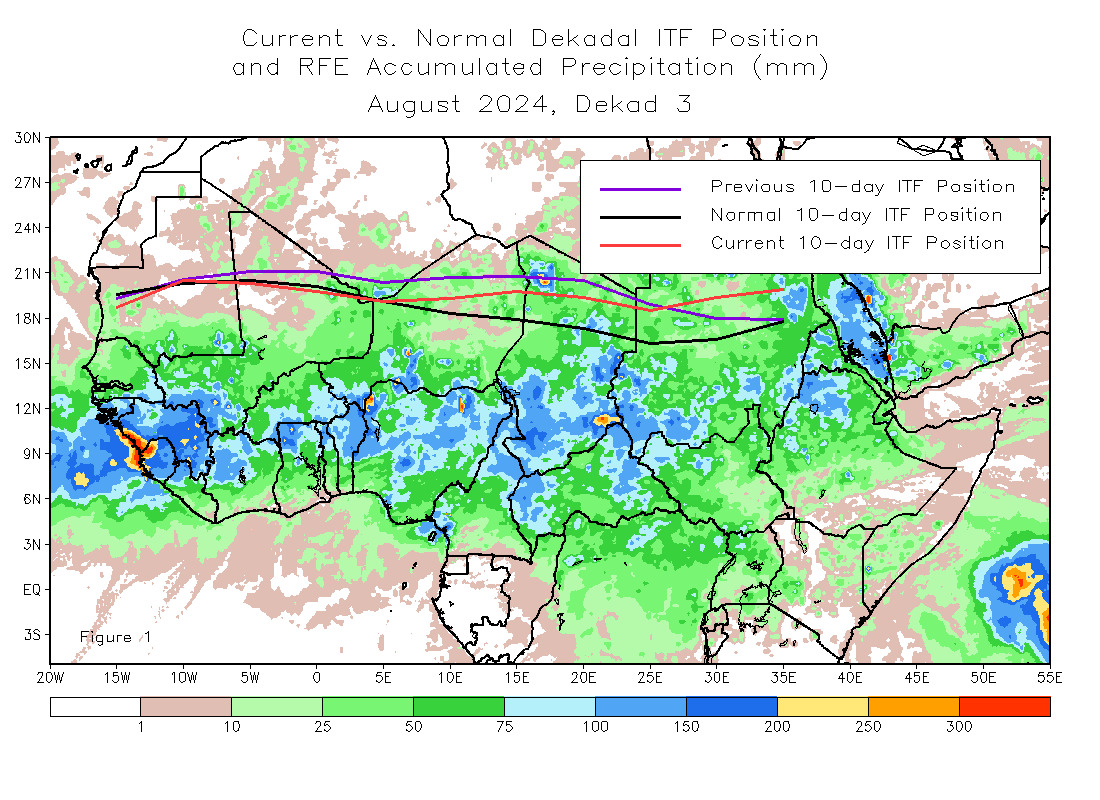
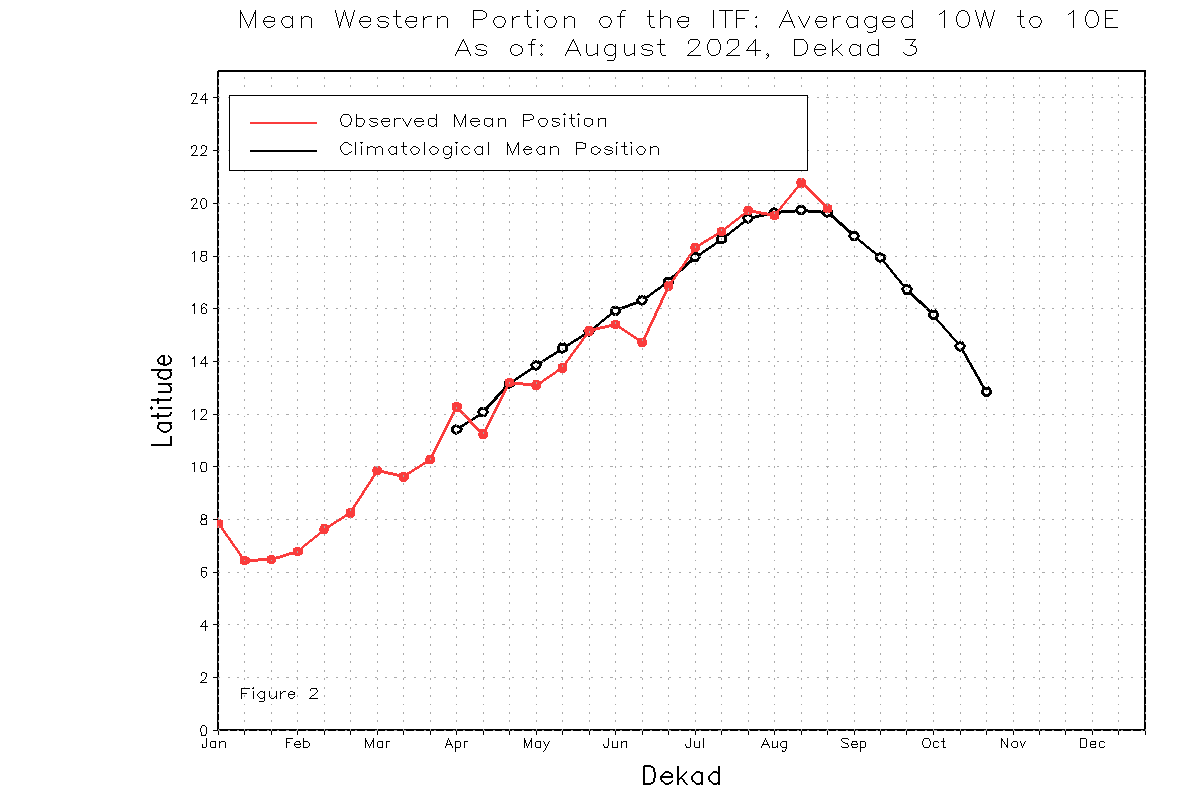
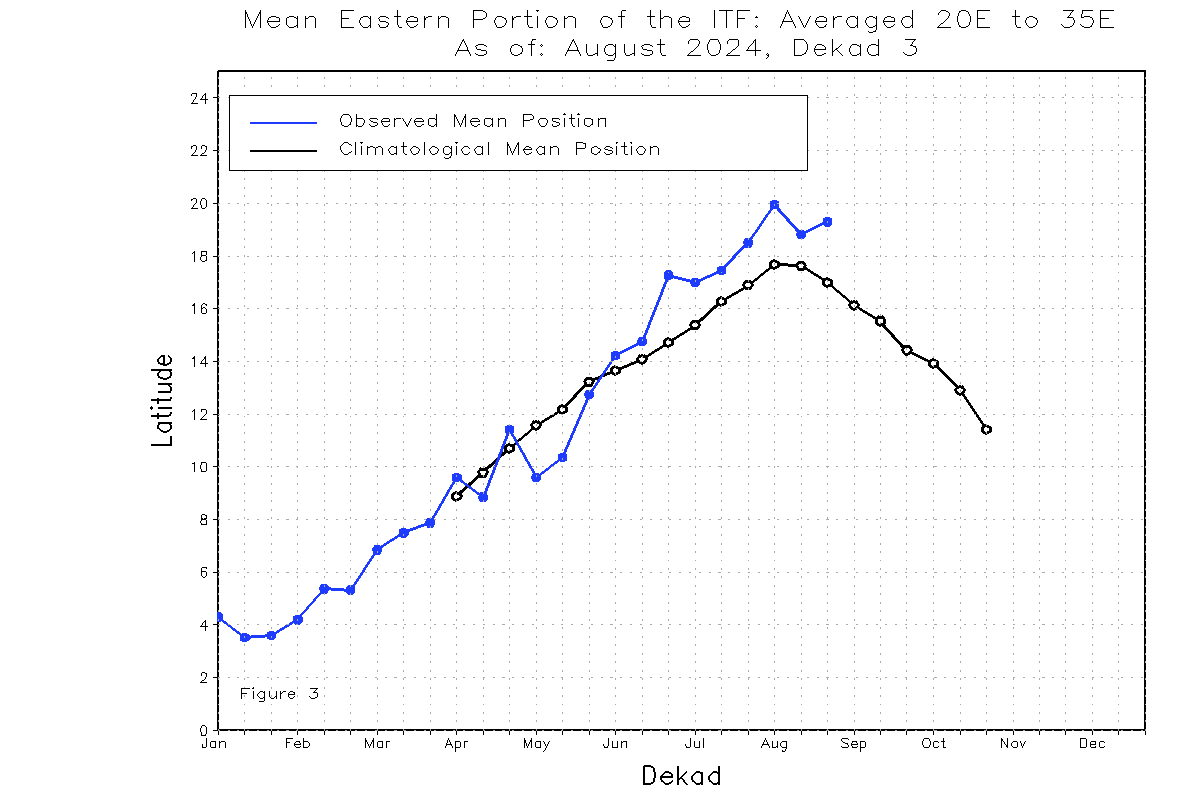
CPC has also released their analysis of the Intertropical Front (ITF) position during August 21-31. The western ITCZ is mostly in line with climo now, though the eastern ITCZ remains anomalously north (and parts of it actually shifted further north compared to August 11-20).

Image

Image

Image
2 likes   

User avatar
gatorcane
S2K Supporter
S2K Supporter
Posts: 23691
Age: 47
Joined: Sun Mar 13, 2005 3:54 pm
Location: Boca Raton, FL

Re: 2024 Indicators: SST's, MSLP, Shear, SAL, Steering, Instability (Day 16+ Climate Models)

#2408 Postby gatorcane » Fri Sep 06, 2024 9:03 am

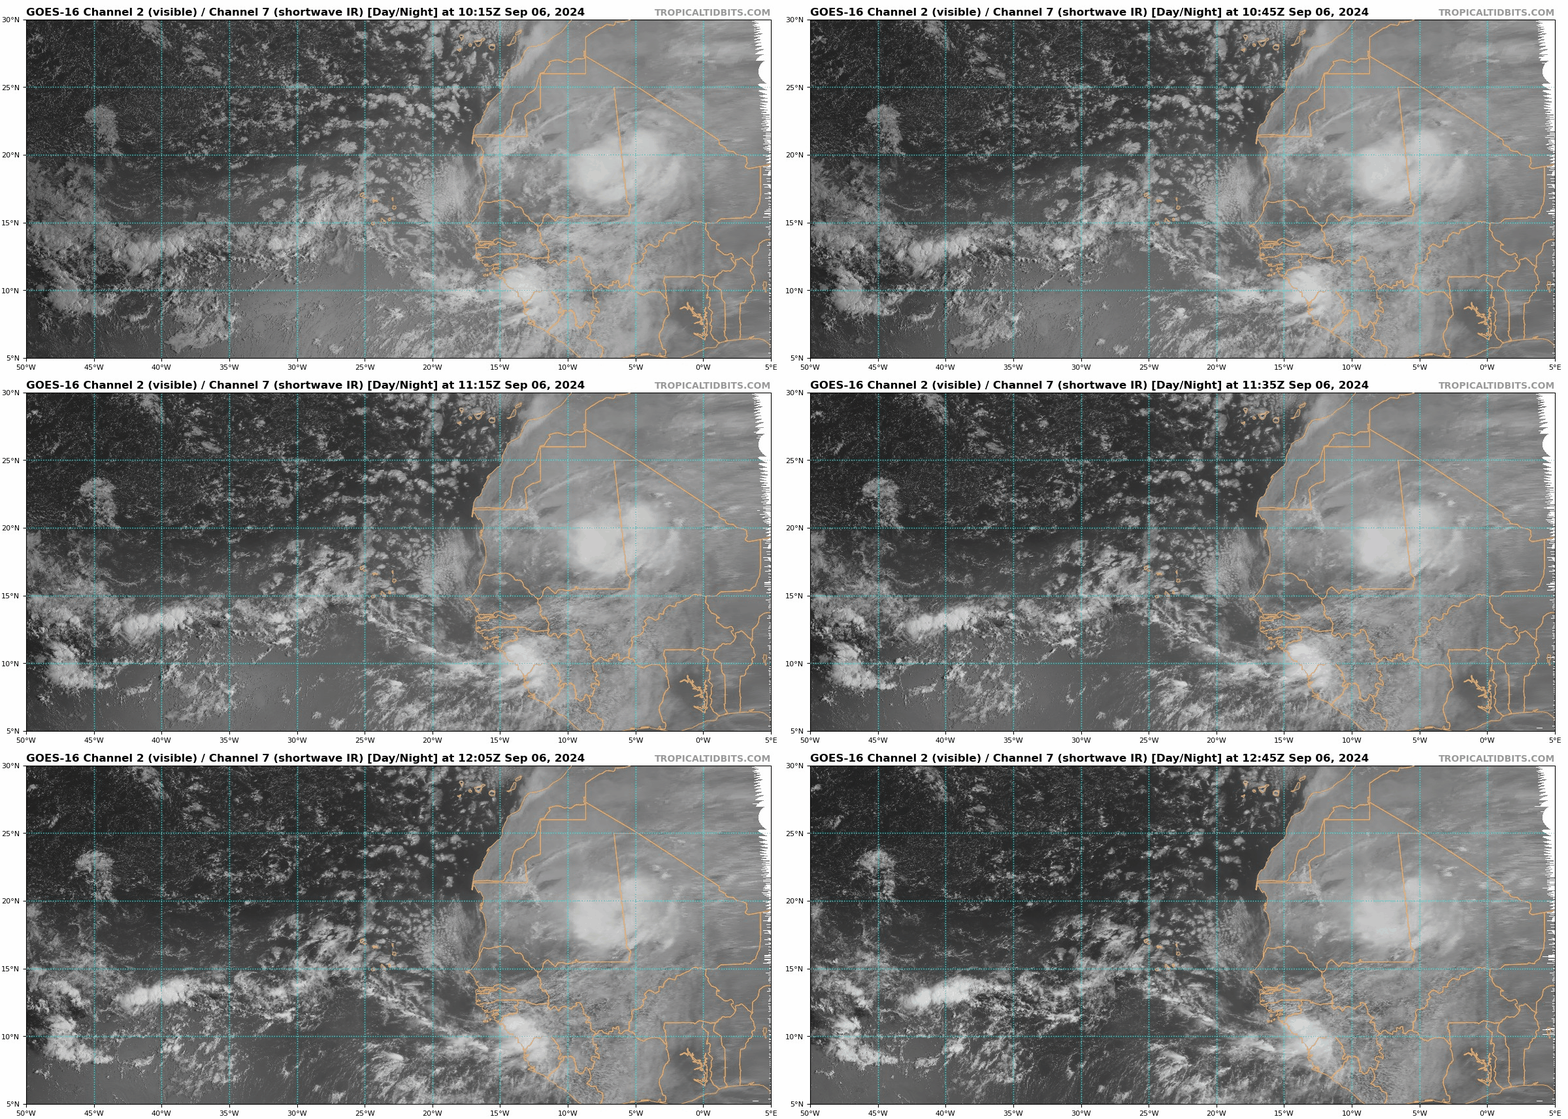
Ironically, the disturbance over Mali/Mauritania looks better than anything we have seen over the Atlantic in the past couple of weeks. I also don't recall seeing anything like this so far north in Africa before, it's not normal right?

Image
5 likes   

User avatar
aspen
Category 5
Category 5
Posts: 8818
Joined: Sat Oct 12, 2019 7:10 pm
Location: Connecticut, USA

Re: 2024 Indicators: SST's, MSLP, Shear, SAL, Steering, Instability (Day 16+ Climate Models)

#2409 Postby aspen » Fri Sep 06, 2024 2:36 pm

gatorcane wrote:Ironically, the disturbance over Mali/Mauritania looks better than anything we have seen over the Atlantic in the past couple of weeks. I also don't recall seeing anything like this so far north in Africa before, it's not normal right?

https://i.postimg.cc/900kGpN7/goes16-vis-swir-eatl.gif

I remember the Euro was showing a disturbance in late Aug/early Sept quite similar to what we’re seeing right now, being anomalously far north into the Sahara. It’s ridiculous how far north the ITCZ/AEJ is.
0 likes   
Irene '11 Sandy '12 Hermine '16 5/15/2018 Derecho Fay '20 Isaias '20 Elsa '21 Henri '21 Ida '21

I am only a meteorology enthusiast who knows a decent amount about tropical cyclones. Look to the professional mets, the NHC, or your local weather office for the best information.

User avatar
Ubuntwo
Category 5
Category 5
Posts: 1406
Age: 31
Joined: Thu Oct 05, 2017 10:41 pm

Re: 2024 Indicators: SST's, MSLP, Shear, SAL, Steering, Instability (Day 16+ Climate Models)

#2410 Postby Ubuntwo » Fri Sep 06, 2024 2:54 pm

gatorcane wrote:Ironically, the disturbance over Mali/Mauritania looks better than anything we have seen over the Atlantic in the past couple of weeks. I also don't recall seeing anything like this so far north in Africa before, it's not normal right?

It is associated with a huge batch of 6-sigma PWAT anomalies over the Sahara, so no, this is not normal.
Image
5 likes   
Kendall -> SLO -> PBC

Memorable Storms: Katrina (for its Florida landfall...) Wilma Matthew Irma

User avatar
REDHurricane
Category 1
Category 1
Posts: 396
Age: 27
Joined: Sun Jul 03, 2022 2:36 pm
Location: Northeast Pacific Ocean

Re: 2024 Indicators: SST's, MSLP, Shear, SAL, Steering, Instability (Day 16+ Climate Models)

#2411 Postby REDHurricane » Fri Sep 06, 2024 9:40 pm

Ubuntwo wrote:
gatorcane wrote:Ironically, the disturbance over Mali/Mauritania looks better than anything we have seen over the Atlantic in the past couple of weeks. I also don't recall seeing anything like this so far north in Africa before, it's not normal right?

It is associated with a huge batch of 6-sigma PWAT anomalies over the Sahara, so no, this is not normal.
https://i.imgur.com/bkCCPUw.png


For context, the probability of a 6-sigma event occurring (in a normal distribution) is somewhere around 1 in 500 million according to the interwebs
3 likes   

USTropics
Professional-Met
Professional-Met
Posts: 2650
Joined: Sun Aug 12, 2007 3:45 am
Location: Florida State University

Re: 2024 Indicators: SST's, MSLP, Shear, SAL, Steering, Instability (Day 16+ Climate Models)

#2412 Postby USTropics » Sat Sep 07, 2024 2:31 am

I can't share the graphics since its ongoing research, but we have a professor here at FSU (Dr. Wing) who is currently on a field mission in the eastern Atlantic. Her research group is releasing various daily soundings from a ship in tropical waves/convection to assess the vertical profile. I can tell you (especially around the 3rd/4th week of August) some of the mid-upper level air soundings are astonishing (as in, large presence of dry air and terrible lapse rates).
7 likes   

User avatar
aspen
Category 5
Category 5
Posts: 8818
Joined: Sat Oct 12, 2019 7:10 pm
Location: Connecticut, USA

Re: 2024 Indicators: SST's, MSLP, Shear, SAL, Steering, Instability (Day 16+ Climate Models)

#2413 Postby aspen » Sat Sep 07, 2024 5:42 am

We’re a week into September with no imminent development on the horizon, and models keep pushing back any significant TC activity. I think now it’s safe to say we’re confidently in historic bust territory. While this probably won’t be among the lowest-ACE seasons by virtue of having Beryl, this will likely be the biggest bust in Atlantic history relative to the forecasts being put out.

I think the totals may be 7-11 NS, 3-5 H, 1-2 MH, and 70-100 ACE once all is said and done. While this exceeds 2013 in every metric except NS, it’s a far cry from the numerous 20+ NS and hyperactive ACE forecasts. I do expect we’ll see at least a few more storms this season, but probably not any significant peak in activity like in a normal ASO.

Edit: and I just noticed the models ticked up this morning and the wave we’ve been watching for 2 weeks might actually develop soon, my bad lol. Still not expecting much more than 100-110 ACE, though.
Last edited by aspen on Sat Sep 07, 2024 7:03 am, edited 1 time in total.
1 likes   
Irene '11 Sandy '12 Hermine '16 5/15/2018 Derecho Fay '20 Isaias '20 Elsa '21 Henri '21 Ida '21

I am only a meteorology enthusiast who knows a decent amount about tropical cyclones. Look to the professional mets, the NHC, or your local weather office for the best information.

User avatar
REDHurricane
Category 1
Category 1
Posts: 396
Age: 27
Joined: Sun Jul 03, 2022 2:36 pm
Location: Northeast Pacific Ocean

Re: 2024 Indicators: SST's, MSLP, Shear, SAL, Steering, Instability (Day 16+ Climate Models)

#2414 Postby REDHurricane » Sat Sep 07, 2024 6:23 am

aspen wrote:We’re a week into September with no imminent development on the horizon, and models keep pushing back any significant TC activity. I think now it’s safe to say we’re confidently in historic bust territory. While this probably won’t be among the lowest-ACE seasons by virtue of having Beryl, this will likely be the biggest bust in Atlantic history relative to the forecasts being put out.

I think the totals may be 7-11 NS, 3-5 H, 1-2 MH, and 70-100 ACE once all is said and done. While this exceeds 2013 in every metric except NS, it’s a far cry from the numerous 20+ NS and hyperactive ACE forecasts. I do expect we’ll see at least a few more storms this season, but probably not any significant peak in activity like in a normal ASO.


Still way too early, my friend. I'd be willing to bet semi-significant money that the Atlantic will reach 100 ACE, even if the season ends up being a bust overall... it would be legitimately shocking if the same Atlantic that produced Beryl in June goes the entirety of September/October/November producing less than 45 ACE total, like I get the conservative outlook but it really only would take one or two more decent hurricanes to exceed 45 ACE, and let's remember that the hurricanes don't care about our human calendar-based expectations of how a normal year should play out. It's certainly possible that you're right (and for the sake of Atlantic coastal areas I hope you are), but I feel like this might end up being one of those comments that people pull up after the season is over to illustrate the pitfalls of assuming that present conditions predict future performance. There are still 7 weeks left in September/October plus all of November, and we're entering a weak La Niña in a tropical Atlantic + Caribbean/Gulf that's still hitting record or near-record SSTs and OHC -- as we have witnessed time and time again in previous seasons, things can and often do change very quickly when these kinds of conditions are in place.
8 likes   

User avatar
Teban54
Category 5
Category 5
Posts: 3204
Joined: Sat May 19, 2018 1:19 pm

Re: 2024 Indicators: SST's, MSLP, Shear, SAL, Steering, Instability (Day 16+ Climate Models)

#2415 Postby Teban54 » Sat Sep 07, 2024 1:22 pm

aspen wrote:We’re a week into September with no imminent development on the horizon, and models keep pushing back any significant TC activity. I think now it’s safe to say we’re confidently in historic bust territory. While this probably won’t be among the lowest-ACE seasons by virtue of having Beryl, this will likely be the biggest bust in Atlantic history relative to the forecasts being put out.

I think the totals may be 7-11 NS, 3-5 H, 1-2 MH, and 70-100 ACE once all is said and done. While this exceeds 2013 in every metric except NS, it’s a far cry from the numerous 20+ NS and hyperactive ACE forecasts. I do expect we’ll see at least a few more storms this season, but probably not any significant peak in activity like in a normal ASO.

Edit: and I just noticed the models ticked up this morning and the wave we’ve been watching for 2 weeks might actually develop soon, my bad lol. Still not expecting much more than 100-110 ACE, though.

If anything, there's a significantly increased chance that we won't be looking at an empty TWO map on September 10. I'd even say we'll probably have at least two entities on the map, if not two TCs.
2 likes   

User avatar
Hammy
Category 5
Category 5
Posts: 5849
Age: 41
Joined: Fri May 25, 2012 5:25 pm
Contact:

Re: 2024 Indicators: SST's, MSLP, Shear, SAL, Steering, Instability (Day 16+ Climate Models)

#2416 Postby Hammy » Sat Sep 07, 2024 5:39 pm

Now that I've figured out how to both find the wind (rather than just pressure map) and also the expanded view on pivotal, it looks like the CFS is showing potentially 12 storms roughly, through early October, and this doesn't seem like it's out of the question now that the model signal is there that the issues are finally beginning to resolve.

Interestingly, while it doesn't show the current GFS solution (more than likely given the real time monsoon trough is causing issues for all the models--especially a lower resolution one like the CFS)--it shows a nearly identical, but stronger, scenario so that particular run setting up near the end of September
1 likes   
The above post is not official and should not be used as such. It is the opinion of the poster and may or may not be backed by sound meteorological data. It is not endorsed by any professional institution or storm2k.org. For official information, please refer to the NHC and NWS products.

Cachondo23
Tropical Depression
Tropical Depression
Posts: 75
Joined: Wed May 25, 2022 5:56 am

Re: 2024 Indicators: SST's, MSLP, Shear, SAL, Steering, Instability (Day 16+ Climate Models)

#2417 Postby Cachondo23 » Sat Sep 07, 2024 5:51 pm

aspen wrote:We’re a week into September with no imminent development on the horizon, and models keep pushing back any significant TC activity. I think now it’s safe to say we’re confidently in historic bust territory. While this probably won’t be among the lowest-ACE seasons by virtue of having Beryl, this will likely be the biggest bust in Atlantic history relative to the forecasts being put out.

I think the totals may be 7-11 NS, 3-5 H, 1-2 MH, and 70-100 ACE once all is said and done. While this exceeds 2013 in every metric except NS, it’s a far cry from the numerous 20+ NS and hyperactive ACE forecasts. I do expect we’ll see at least a few more storms this season, but probably not any significant peak in activity like in a normal ASO.

Edit: and I just noticed the models ticked up this morning and the wave we’ve been watching for 2 weeks might actually develop soon, my bad lol. Still not expecting much more than 100-110 ACE, though.

1 more MH for the rest of the season?
2 likes   

User avatar
Hammy
Category 5
Category 5
Posts: 5849
Age: 41
Joined: Fri May 25, 2012 5:25 pm
Contact:

Re: 2024 Indicators: SST's, MSLP, Shear, SAL, Steering, Instability (Day 16+ Climate Models)

#2418 Postby Hammy » Sat Sep 07, 2024 6:06 pm

aspen wrote:We’re a week into September with no imminent development on the horizon, and models keep pushing back any significant TC activity. I think now it’s safe to say we’re confidently in historic bust territory. While this probably won’t be among the lowest-ACE seasons by virtue of having Beryl, this will likely be the biggest bust in Atlantic history relative to the forecasts being put out.

I think the totals may be 7-11 NS, 3-5 H, 1-2 MH, and 70-100 ACE once all is said and done. While this exceeds 2013 in every metric except NS, it’s a far cry from the numerous 20+ NS and hyperactive ACE forecasts. I do expect we’ll see at least a few more storms this season, but probably not any significant peak in activity like in a normal ASO.

Edit: and I just noticed the models ticked up this morning and the wave we’ve been watching for 2 weeks might actually develop soon, my bad lol. Still not expecting much more than 100-110 ACE, though.


The models have been showing imminent development (within five days) for the last couple. The bolded is a fair estimate for the rest of the season but I highly doubt this is going to be the season total.

The 20+ numbers and peak ACE forecasts always seemed unachievable once we went all of July without any new storms--any extreme high or low forecast I've always doubted.
2 likes   
The above post is not official and should not be used as such. It is the opinion of the poster and may or may not be backed by sound meteorological data. It is not endorsed by any professional institution or storm2k.org. For official information, please refer to the NHC and NWS products.

User avatar
Hurricane2022
Category 5
Category 5
Posts: 1541
Joined: Tue Aug 23, 2022 11:38 pm
Location: Araçatuba, Brazil

Re: 2024 Indicators: SST's, MSLP, Shear, SAL, Steering, Instability (Day 16+ Climate Models)

#2419 Postby Hurricane2022 » Sat Sep 07, 2024 6:21 pm

Inb4 the switch flip was just delayed by 20 days and then from this next GOM system we're going to see the Atlantic producing hurricanes in an absurd hurry until December :lol: :spam:
2 likes   
Sorry for the bad English sometimes...!
For reliable and detailed information for any meteorological phenomenon, please consult the National Hurricane Center, Joint Typhoon Warning Center , or your local Meteo Center.

--------

Una cvm Christo, pro Christo, et in Christo. Sit nomen Domini benedictvm.

User avatar
Teban54
Category 5
Category 5
Posts: 3204
Joined: Sat May 19, 2018 1:19 pm

Re: 2024 Indicators: SST's, MSLP, Shear, SAL, Steering, Instability (Day 16+ Climate Models)

#2420 Postby Teban54 » Sat Sep 07, 2024 8:24 pm

Within the last 24 hours, we have three concurrent orange or cherry AOIs, two concurrent invests that were newly declared, as well as GFS and Euro runs with significant hurricanes.

The first thing this reminds me of is the classic Captain Barbossa's Tropical Cyclone Timeline. So here's my attempt at a 2024 edition (based on Category5Kaiju's version earlier):


1. June 1st: Everyone is excited about the upcoming season. Many are anticipating upcoming action later in the month, but most know that the real action will most likely start in August.

2. June 30th: A Category 4 hurricane rampages through the MDR. Many are absolutely stunned at the sight.

3. July 2nd: That Category 4 hurricane is now a Category 5 hurricane in the Eastern Caribbean. Many begin to greatly worry about the future of the season.

4. July 15th: Lots of SAL is present in the Atlantic basin. However, most people are not surprised by this, as they were expecting it, althouh a select few see nothing in the models and begin to question if hyperactivity is on the table after all.

5. July 28th: Atlantic is still slow. Dry, stable air is present in the tropics. However, models are beginning to suggest things will be changing within a few days.

6. August 15th: Models show nothing in the near-future (other than Ernesto). Many are becoming skeptical about the season amounting to anything significant.

7. August 23rd: Normally, there should be multiple invests in the Atlantic and conditions are rapidly beginning to change. But this year the Atlantic fell asleep, as Ernesto was gone and nothing else was on the horizon. Models still show nothing. There are long debates about whether conditions will change or not.

8. September 3rd: Somehow, the Atlantic is still dead. No storms seem likely to form (aside from a failed model storm) leading up to the climo peak. Experts and fans start desperate attempts at explaining why that's the case, and CSU had to issue a special discussion explaining why the Atlantic is quiet. Many are calling the season a bust and think it will finish like 2013, while some still expect a heavily back-loaded season.

9. September 7th: There are multiple invests in the Atlantic and conditions are rapidly beginning to change. The models begin to show cyclogenesis. Many quickly change their minds about a quieter season (?). (Typically on August 23rd)

Will the following happen?

10. ???: Some experts continue to doubt signs of the Atlantic awakening. These experts issue outlooks that support original ideas of a quieter season. (Typically on August 24th)

11. ???: There is now at least one active TC. There is a potential that at least one TC could become a hurricane. Many people appear shocked by the increased activity. (Typically on August 31st)

12. ???: Several TCs have already formed and dissipated. A few who suggested that the season would be quiet now state that they always knew the Atlantic would spring to life. (Typically on September 30th)

13. ???: The last storm probably has dissipated by this point. Many look back at the season and state that they are surprised with the outcome. (Typically on November 30th)


(Aside: I found last year's discussions about Captain Barbossa's timeline. Of course, people were saying "2023 isn't a normal year because El Nino". We know how that turned out.)
Last edited by Teban54 on Sat Sep 07, 2024 8:37 pm, edited 1 time in total.
3 likes   


Return to “Talkin' Tropics”

Who is online

Users browsing this forum: gib, Google Adsense [Bot], Hurricane2022, HurricaneFan, RomP, Stormybajan and 53 guests