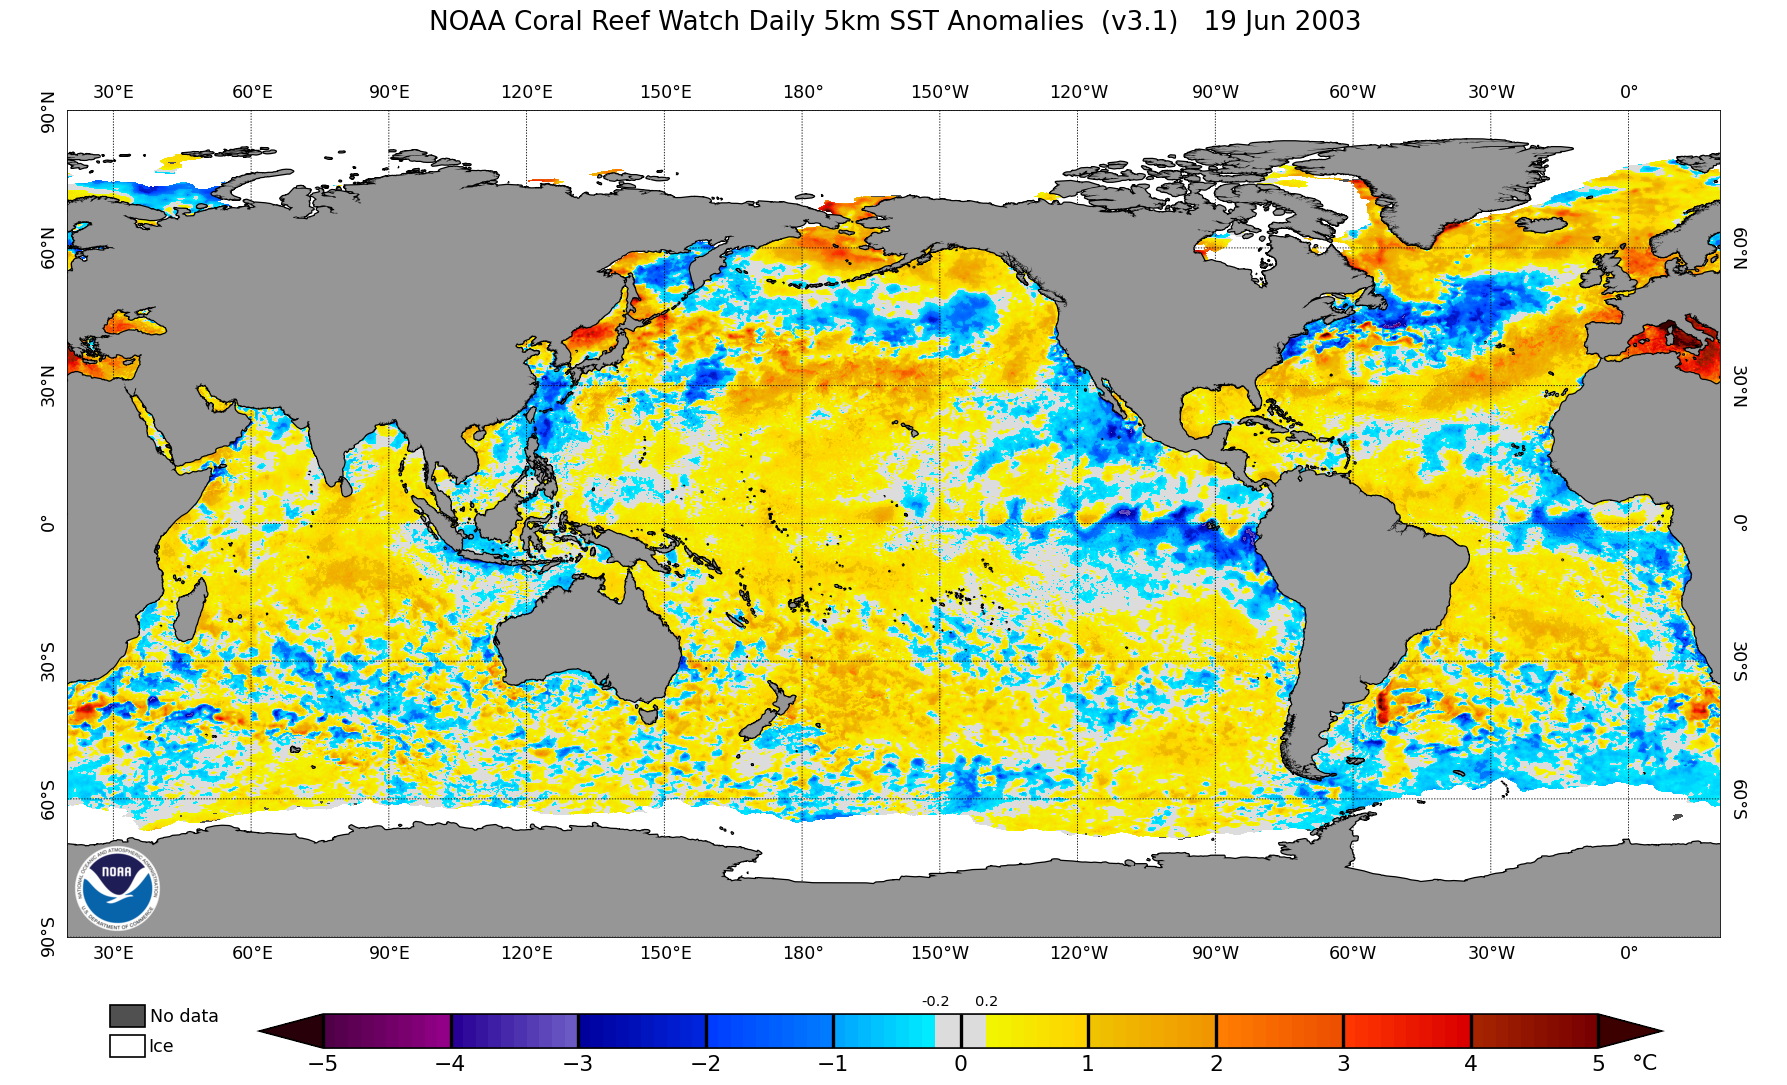
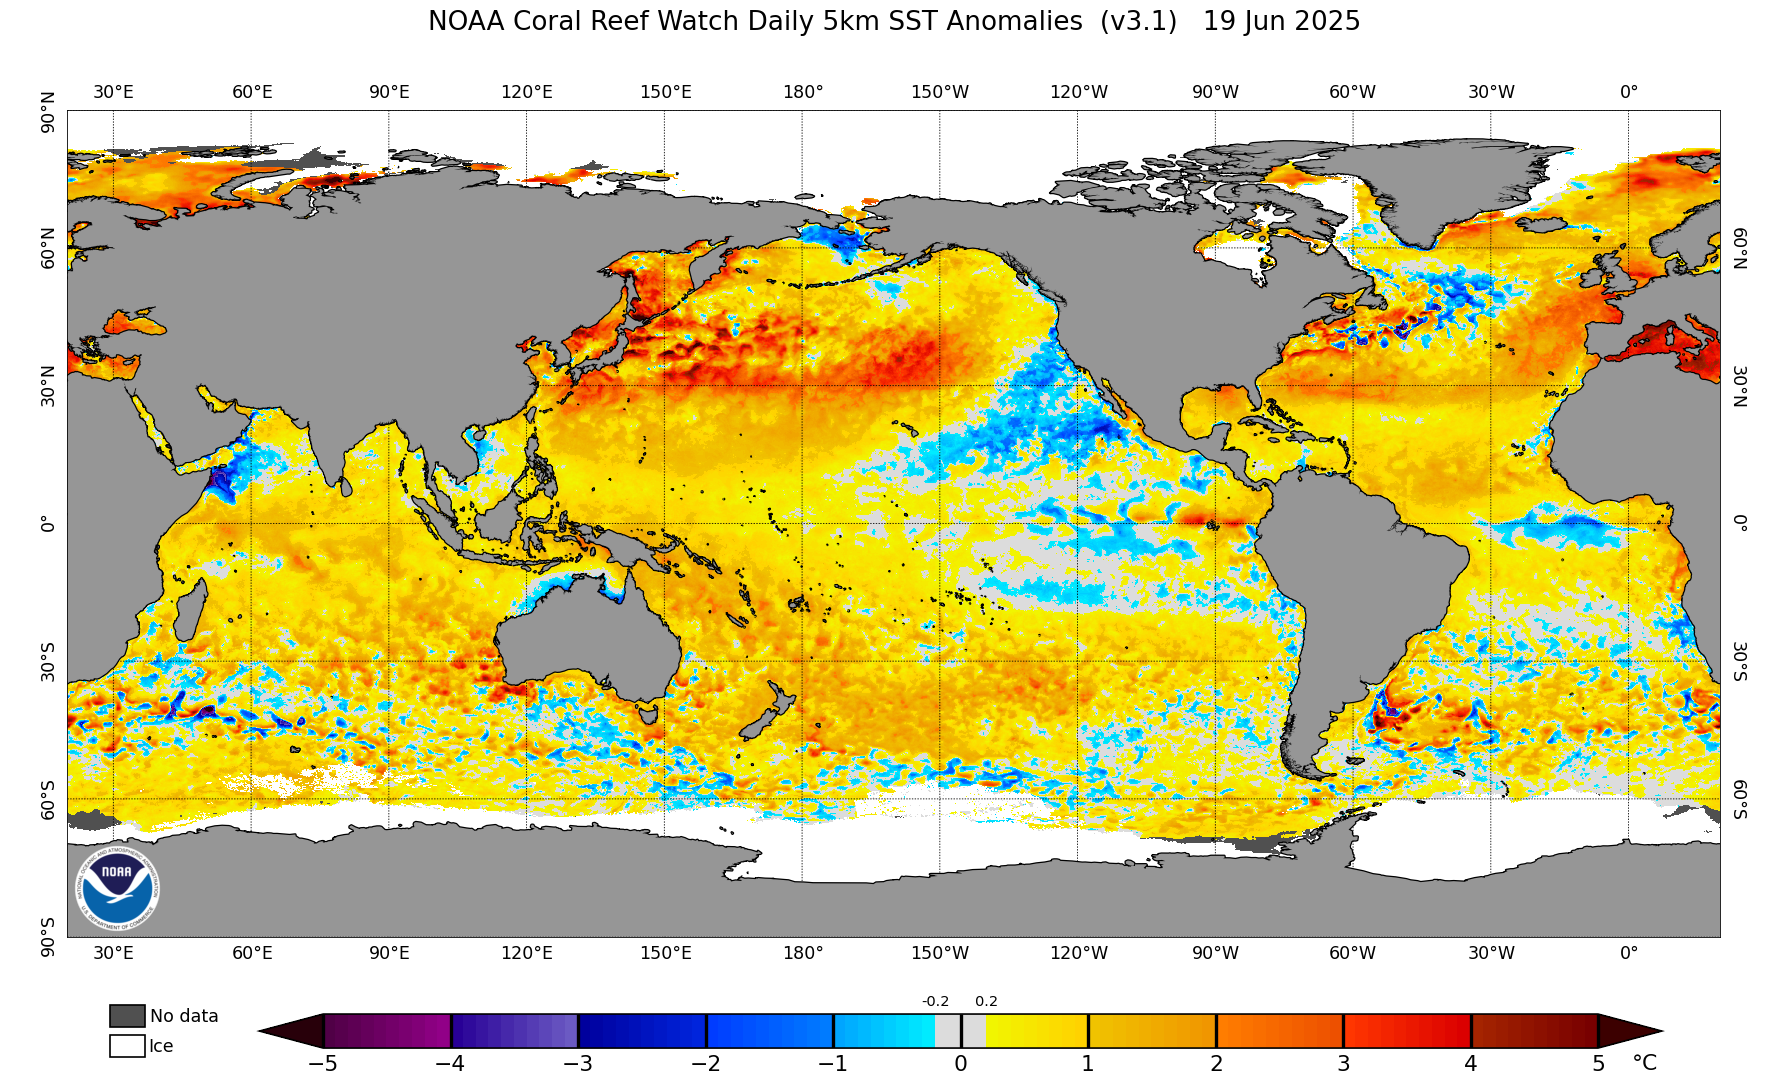
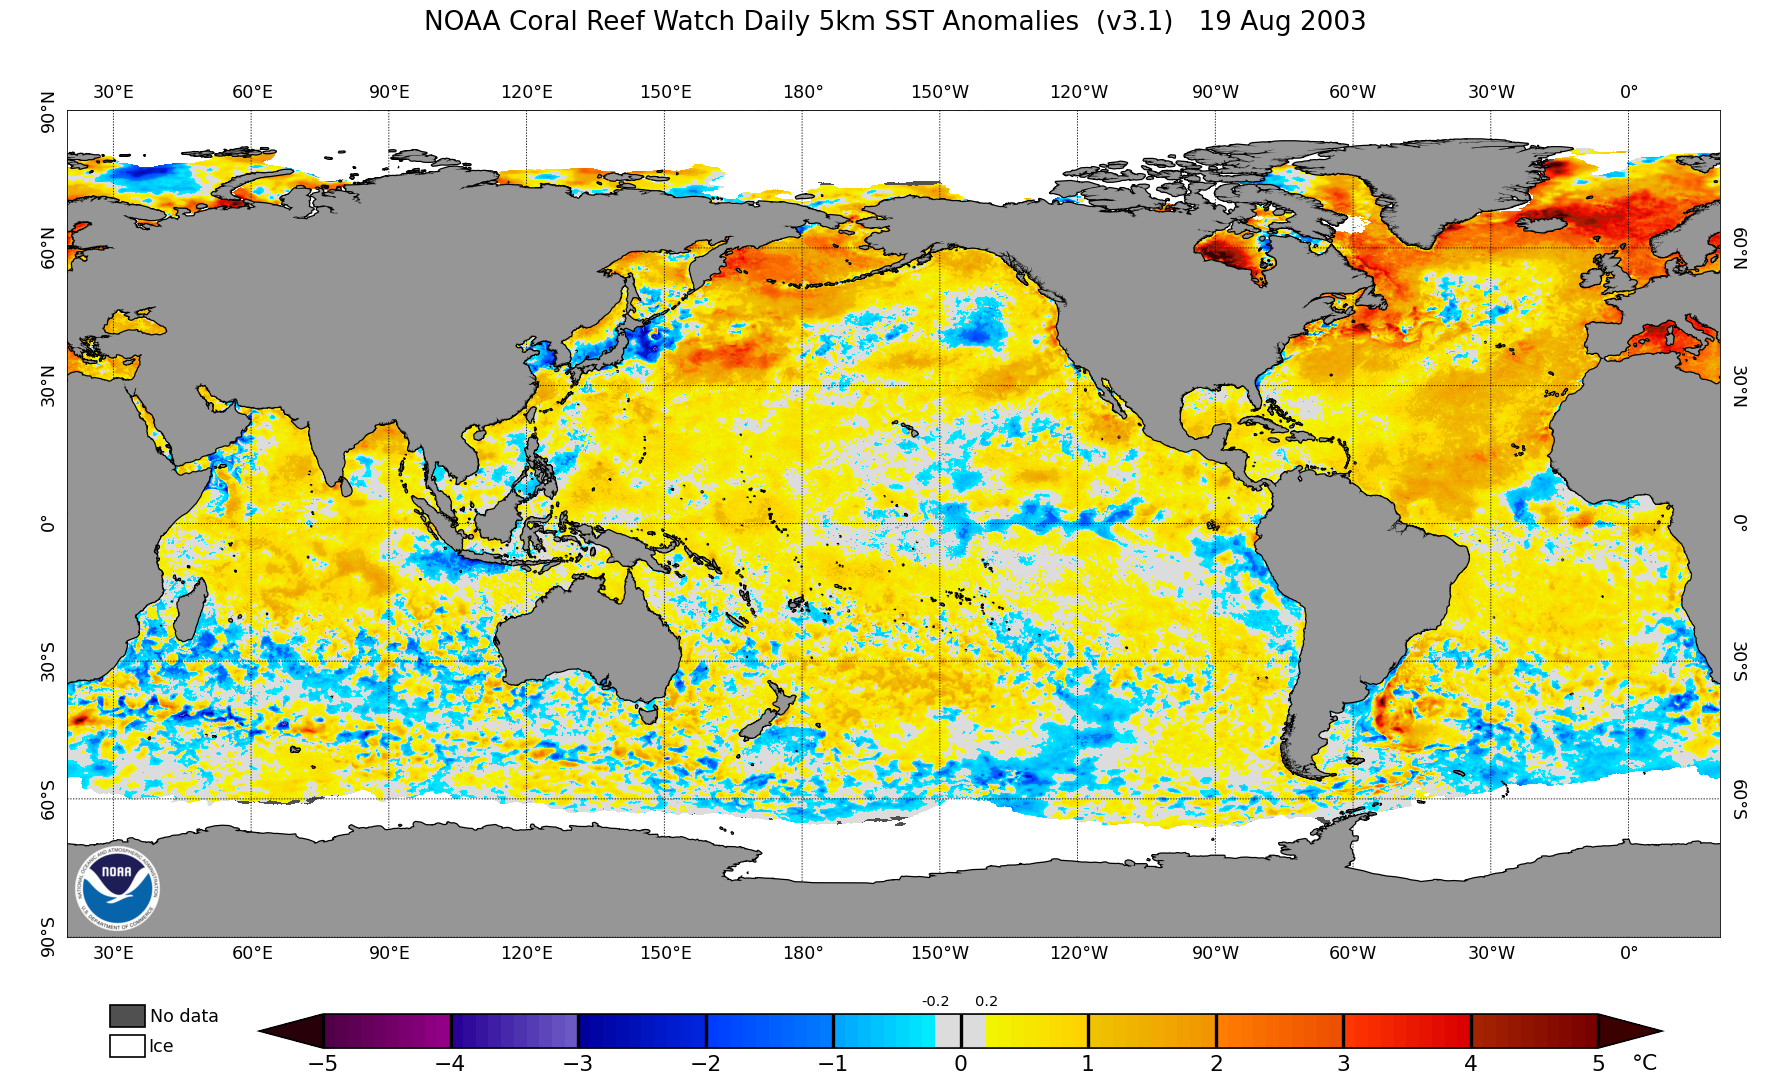
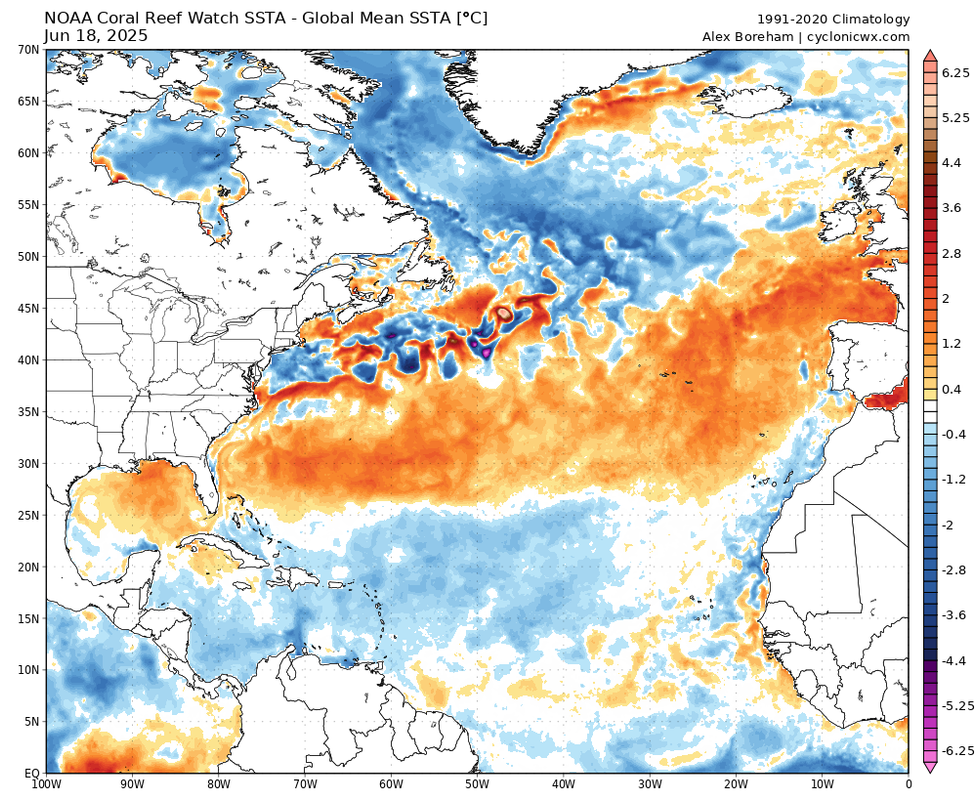
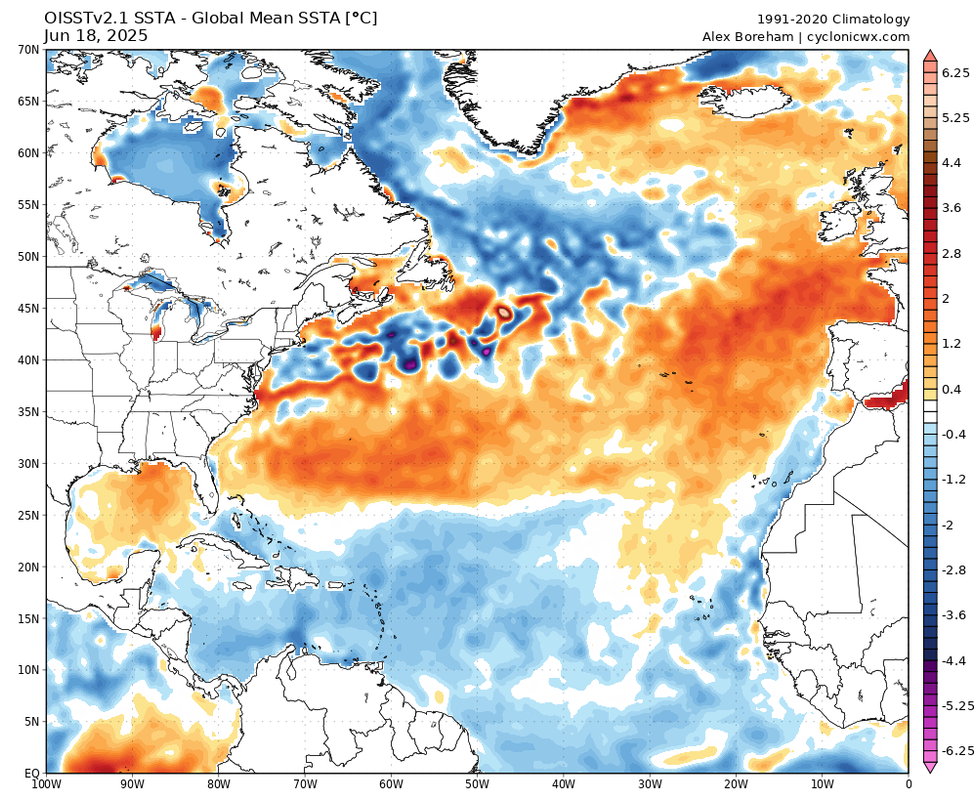
2025 Indicators: SST's, MSLP, Shear, SAL, Steering, Instability (Day 16+ Climate Models)

This is the general tropical discussion area. Anyone can take their shot at predicting a storms path.

Moderator: S2k Moderators

Forum rules

The posts in this forum are NOT official forecasts and should not be used as such. They are just the opinion of the poster and may or may not be backed by sound meteorological data. They are NOT endorsed by any professional institution or STORM2K. For official information, please refer to products from the National Hurricane Center and National Weather Service.

Help Support Storm2K
Message
Author
WeatherBoy2000
Category 1
Category 1
Posts: 344
Joined: Mon Apr 10, 2023 9:29 am

Re: 2025 Indicators: SST's, MSLP, Shear, SAL, Steering, Instability (Day 16+ Climate Models)

#321 Postby WeatherBoy2000 » Fri Jun 20, 2025 12:58 pm

USTropics wrote:
WeatherBoy2000 wrote:
Teban54 wrote:The OISST data (as Andy tweeted) actually looks somewhat different with Coral Reef Watch when it comes to the "southern MDR" near 10N:

https://i.postimg.cc/6q8GppQn/image.png

https://i.postimg.cc/zXRgmv61/image.png


Don't know what's up with the discrepancy between the two. The Coral Reef watch still shows a slightly above normal mdr while the OISST has had the mdr tank below normal in the past couple days:

https://cyclonicwx.com/data/sst/crw_ssta_graph_atlmdr.png

https://cyclonicwx.com/data/sst/oisst_ssta_graph_atlmdr.png


This is something I looked into a few years ago, and there are primarily three factors in the differences: (1) variability in data input, (2) gridded resolution, and (3) interpolation used to determine missing gridded values/correction algorithms to biases.

Coral Reef Watch (CRW)
Data input - This is derived using primarily SST data from thermal infrared sensors on nine polar-orbiting satellites (also known as the real-time Geo-Polar Blended SST) and all of the in situ data contained within the the International Comprehensive Ocean-Atmosphere Data Set (ICOADS).

Resolution - The CRW product has a 5km resolution (0.05 degree spatial resolution).

Processing/algorithms - Gaps are filled using optimal interpolation, with bias corrections based on the OSTIA (Operational Sea Surface Temperature and Sea Ice Analysis) dataset.

This is also only a nighttime product, from NOAA's methodology section:

The CoralTemp SST provides a measurement of the nighttime ocean temperature at the sea surface, calibrated to 0.2 meters depth. Nighttime-only satellite SST observations are used to reduce the influence of daytime warming caused by solar heating at and near the sea surface and to avoid contamination from solar glare. Furthermore, at night, water temperatures at and near the sea surface are more vertically uniform.

https://coralreefwatch.noaa.gov/product/5km/methodology.php#sst


Optimum Interpolation Sea Surface Temperature (OISST)
Data input - OISST employs optimal interpolation to combine satellite data (primarily AVHRR), in situ measurements (ships, buoys, Argo floats), and proxy SSTs from sea ice concentrations. Essentially, it uses a more comprehensive range of data sources.

Resolution - OISST uses a much coarser resolution at 25km (0.25 degree spatial resolution).

Processing/algorithms - OISST incorporates both daytime and nighttime observations, which can introduce differences due to diurnal warming effects. It uses a broader range of data sources and applies bias corrections relative to buoy data, with monthly adjustments to ship and satellite data.

https://i.imgur.com/vweDfr3.png

TL;DR
OISST’s inclusion of in situ data and broader interpolation techniques may smooth out anomalies over larger areas, while CRW’s higher-resolution, satellite-focused approach captures finer-scale variations. CRW focuses heavily on resolution since the product was designed to examine abrupt SST departures/thermal stresses and coral reef monitoring. OISST is considered a more general-purpose climate data product; its coarser resolution and broader data integration prioritize global consistency over localized precision (like ENSO monitoring).

Official documentation
CRW - https://coastwatch.noaa.gov/cwn/products/noaa-geo-polar-blended-global-sea-surface-temperature-analysis-level-4.html
OISST - https://www.ncei.noaa.gov/products/optimum-interpolation-sst


Thanks for the info. I just found it odd given that up until a few days ago they were similar.
0 likes   

USTropics
Professional-Met
Professional-Met
Posts: 2646
Joined: Sun Aug 12, 2007 3:45 am
Location: Florida State University

Re: 2025 Indicators: SST's, MSLP, Shear, SAL, Steering, Instability (Day 16+ Climate Models)

#322 Postby USTropics » Fri Jun 20, 2025 1:21 pm

WeatherBoy2000 wrote:
USTropics wrote:
WeatherBoy2000 wrote:
Don't know what's up with the discrepancy between the two. The Coral Reef watch still shows a slightly above normal mdr while the OISST has had the mdr tank below normal in the past couple days:

https://cyclonicwx.com/data/sst/crw_ssta_graph_atlmdr.png

https://cyclonicwx.com/data/sst/oisst_ssta_graph_atlmdr.png


This is something I looked into a few years ago, and there are primarily three factors in the differences: (1) variability in data input, (2) gridded resolution, and (3) interpolation used to determine missing gridded values/correction algorithms to biases.

Coral Reef Watch (CRW)
Data input - This is derived using primarily SST data from thermal infrared sensors on nine polar-orbiting satellites (also known as the real-time Geo-Polar Blended SST) and all of the in situ data contained within the the International Comprehensive Ocean-Atmosphere Data Set (ICOADS).

Resolution - The CRW product has a 5km resolution (0.05 degree spatial resolution).

Processing/algorithms - Gaps are filled using optimal interpolation, with bias corrections based on the OSTIA (Operational Sea Surface Temperature and Sea Ice Analysis) dataset.

This is also only a nighttime product, from NOAA's methodology section:

The CoralTemp SST provides a measurement of the nighttime ocean temperature at the sea surface, calibrated to 0.2 meters depth. Nighttime-only satellite SST observations are used to reduce the influence of daytime warming caused by solar heating at and near the sea surface and to avoid contamination from solar glare. Furthermore, at night, water temperatures at and near the sea surface are more vertically uniform.

https://coralreefwatch.noaa.gov/product/5km/methodology.php#sst


Optimum Interpolation Sea Surface Temperature (OISST)
Data input - OISST employs optimal interpolation to combine satellite data (primarily AVHRR), in situ measurements (ships, buoys, Argo floats), and proxy SSTs from sea ice concentrations. Essentially, it uses a more comprehensive range of data sources.

Resolution - OISST uses a much coarser resolution at 25km (0.25 degree spatial resolution).

Processing/algorithms - OISST incorporates both daytime and nighttime observations, which can introduce differences due to diurnal warming effects. It uses a broader range of data sources and applies bias corrections relative to buoy data, with monthly adjustments to ship and satellite data.

https://i.imgur.com/vweDfr3.png

TL;DR
OISST’s inclusion of in situ data and broader interpolation techniques may smooth out anomalies over larger areas, while CRW’s higher-resolution, satellite-focused approach captures finer-scale variations. CRW focuses heavily on resolution since the product was designed to examine abrupt SST departures/thermal stresses and coral reef monitoring. OISST is considered a more general-purpose climate data product; its coarser resolution and broader data integration prioritize global consistency over localized precision (like ENSO monitoring).

Official documentation
CRW - https://coastwatch.noaa.gov/cwn/products/noaa-geo-polar-blended-global-sea-surface-temperature-analysis-level-4.html
OISST - https://www.ncei.noaa.gov/products/optimum-interpolation-sst


Thanks for the info. I just found it odd given that up until a few days ago they were similar.


Yea I would say there is probably some localized resolution issues that the OISST 'smooths' out and it runs just slightly cooler than the CRW product (particularly along those areas in the southern MDR like you stated earlier). If you look at raw SSTs for eastern Atlantic, they are about ~0.2 degrees STD difference.

Image
Image

I've been working with COWVR-TEMPEST data the past few months and can state there are definitely contamination issues with heavy precip/SAL in these high-res polar orbiting instruments. I don't believe that is the case here, but when we do get an active ITCZ/WAM or significant dust/SAL outbreak, I would lean more towards the in situ data from OISST. Essentially, if the satellite data is flagged as rain/SAL contaminated, it's ignored (and CRW defaults to ICOADS data, which is not nearly as good as the in situ data for OISST). Otherwise, I think the resolution on the CRW product will give a more accurate measurement for localized areas.
0 likes   

TomballEd
Category 2
Category 2
Posts: 683
Age: 61
Joined: Wed Aug 16, 2023 4:52 pm
Location: Spring/Klein area, not Tomball

Re: 2025 Indicators: SST's, MSLP, Shear, SAL, Steering, Instability (Day 16+ Climate Models)

#323 Postby TomballEd » Fri Jun 20, 2025 2:47 pm

I saw a Facebook post, going off (I think Euro) there should be an 850 mb wind anomaly that should warm the MDR back up, which would mean things would be generally favorable for an active ASO heart of the season but I'll believe weaker/reversed trades when I see it although CFS and CanSIPS surface pressure anomalies would seem to support Euro longer range ensembles.

I have to ask my wife for permission to pay for Giphy. My free trial has expired.
1 likes   

WeatherBoy2000
Category 1
Category 1
Posts: 344
Joined: Mon Apr 10, 2023 9:29 am

Re: 2025 Indicators: SST's, MSLP, Shear, SAL, Steering, Instability (Day 16+ Climate Models)

#324 Postby WeatherBoy2000 » Fri Jun 20, 2025 4:02 pm

TomballEd wrote:I saw a Facebook post, going off (I think Euro) there should be an 850 mb wind anomaly that should warm the MDR back up, which would mean things would be generally favorable for an active ASO heart of the season but I'll believe weaker/reversed trades when I see it although CFS and CanSIPS surface pressure anomalies would seem to support Euro longer range ensembles.

I have to ask my wife for permission to pay for Giphy. My free trial has expired.


Image

Looks like around the turn of the month might be when things start to warm up.
1 likes   

mixedDanilo.E
Tropical Depression
Tropical Depression
Posts: 86
Joined: Sun Nov 21, 2021 8:00 am
Location: NY

Re: 2025 Indicators: SST's, MSLP, Shear, SAL, Steering, Instability (Day 16+ Climate Models)

#325 Postby mixedDanilo.E » Fri Jun 20, 2025 8:57 pm

I think Andy Hazelton might have mentioned it but this year we have a pretty similar look currently to 2003 in the Atlantic:
Image Image

Eventually, in 2003 lots of the subtropics warmth made it's way into the MDR by the peak, and this is the look we ended up with by August:

Image

The models showing trades weakening as we head into July means that the MDR might have a chance to warm up significantly soon and if it persists throughout the whole month, I wouldn't be shocked if we end up with a look more like 03 in August. Mind you, 2003 as whole ended up producing 176 ACE points, which does count as hyperactive. Not saying that will happen for this year, but it is interesting that we do look similar to a year like 03 where it did end up happening. That'll be very reliant on the peak season though, which in 03 we had storms like Fabian and Isabel which helped rack up the ACE as they were very long tracked storms. For that we'll have to rely on perfect MJO timing for the peak, which we certainly had a lack of last year.
6 likes   

User avatar
DorkyMcDorkface
Category 3
Category 3
Posts: 887
Age: 27
Joined: Mon Sep 30, 2019 1:32 pm
Location: Mid-Atlantic

Re: 2025 Indicators: SST's, MSLP, Shear, SAL, Steering, Instability (Day 16+ Climate Models)

#326 Postby DorkyMcDorkface » Fri Jun 20, 2025 9:12 pm

mixedDanilo.E wrote:I think Andy Hazelton might have mentioned it but this year we have a pretty similar look currently to 2003 in the Atlantic:
https://coralreefwatch.noaa.gov/data/5km/v3.1_op/image/daily/ssta/png/2003/06/ct5km_ssta_v3.1_global_20030619.png https://coralreefwatch.noaa.gov/data/5km/v3.1_op/image/daily/ssta/png/2025/06/ct5km_ssta_v3.1_global_20250619.png

Eventually, in 2003 lots of the subtropics warmth made it's way into the MDR by the peak, and this is the look we ended up with by August:

https://coralreefwatch.noaa.gov/data/5km/v3.1_op/image/daily/ssta/png/2003/08/ct5km_ssta_v3.1_global_20030819.png

The models showing trades weakening as we head into July means that the MDR might have a chance to warm up significantly soon and if it persists throughout the whole month, I wouldn't be shocked if we end up with a look more like 03 in August. Mind you, 2003 as whole ended up producing 176 ACE points, which does count as hyperactive. Not saying that will happen for this year, but it is interesting that we do look similar to a year like 03 where it did end up happening. That'll be very reliant on the peak season though, which in 03 we had storms like Fabian and Isabel which helped rack up the ACE as they were very long tracked storms. For that we'll have to rely on perfect MJO timing for the peak, which we certainly had a lack of last year.

Neutral ENSO and warm stripe in the subtropics with middling MDR definitely is reminiscent of 2003. I suppose it's one of the more upper echelon analogs given it was a hyperactive year as you mentioned, but that look isn't far off from what we have now yeah, and as you mentioned if the trades relax significantly as modeled there's a good chance a more classic +AMO pattern (EOF1 anyway) could resurface with that subtropical warmth migrating southward.
5 likes   
Please note the thougths expressed by this account are solely those of the user and are from a hobbyist perspective. For more comprehensive analysis, consult an actual professional meteorologist or meteorology agency.


Floyd 1999 | Isabel 2003 | Hanna 2008 | Irene 2011 | Sandy 2012 | Isaias 2020

User avatar
gatorcane
S2K Supporter
S2K Supporter
Posts: 23691
Age: 47
Joined: Sun Mar 13, 2005 3:54 pm
Location: Boca Raton, FL

Re: 2025 Indicators: SST's, MSLP, Shear, SAL, Steering, Instability (Day 16+ Climate Models)

#327 Postby gatorcane » Sat Jun 21, 2025 10:14 am

My thinking is that we will see an active, above normal season. While the SST configuration with above normal SSTs appear to be in the subtropical Atlantic this year, which could induce some subsidence and less favorable conditions across the MDR east of the Lesser Antilles, I expect tropical waves to develop potentially further west where there should be favorable conditions across the Caribbean and Gulf with above normal SSTs there. SSTs across the EPAC are below normal and looks very likely we could be in a La Nina configuration come peak Atlantic hurricane months which should favor activity across the Gulf and Caribbean. The other thing to point out here is that we are two years after El Nino end and we have seen where it is this second year where the Atlantic can be very active. Overall, indicators to me suggest an active season especially late Aug through October.
6 likes   

WeatherBoy2000
Category 1
Category 1
Posts: 344
Joined: Mon Apr 10, 2023 9:29 am

Re: 2025 Indicators: SST's, MSLP, Shear, SAL, Steering, Instability (Day 16+ Climate Models)

#328 Postby WeatherBoy2000 » Sat Jun 21, 2025 11:08 am

gatorcane wrote:My thinking is that we will see an active, above normal season. While the SST configuration with above normal SSTs appear to be in the subtropical Atlantic this year, which could induce some subsidence and less favorable conditions across the MDR east of the Lesser Antilles, I expect tropical waves to develop potentially further west where there should be favorable conditions across the Caribbean and Gulf with above normal SSTs there. SSTs across the EPAC are below normal and looks very likely we could be in a La Nina configuration come peak Atlantic hurricane months which should favor activity across the Gulf and Caribbean. The other thing to point out here is that we are two years after El Nino end and we have seen where it is this second year where the Atlantic can be very active. Overall, indicators to me suggest an active season especially late Aug through October.


Yeah despite the record-breaking activity in the epac now, climate modelling seems to be more in the Atlantic's court later down the road. They're leaning more in the -enso/la nina direction by the fall, and there are indications of a more favorable mdr warming pattern come July. As already mentioned, there's little correlation between early season activity (or a lack there of) and activity overall.
4 likes   

User avatar
Category5Kaiju
Category 5
Category 5
Posts: 4094
Joined: Thu Dec 24, 2020 12:45 pm
Location: Seattle

Re: 2025 Indicators: SST's, MSLP, Shear, SAL, Steering, Instability (Day 16+ Climate Models)

#329 Postby Category5Kaiju » Tue Jun 24, 2025 10:44 am

Merely several days ago, the idea of June going stormless in the Atlantic seemed very real. I mean, even I believed that. And then popped up the first named storm of the season.

A cautionary tale that things in the tropics can change abruptly and that sometimes models don’t see a potential for a named storm until close range. Especially if it’s a shorty.
5 likes   
Unless explicitly stated, all info in my posts is based on my own opinions and observations. Tropical storms and hurricanes can be extremely dangerous. Do not think you can beat Mother Nature. Refer to an accredited weather research agency or meteorologist if you need to make serious decisions regarding an approaching storm.

User avatar
chaser1
S2K Supporter
S2K Supporter
Posts: 5462
Age: 64
Joined: Sat Oct 15, 2005 5:59 pm
Location: Longwood, Fl

Re: 2025 Indicators: SST's, MSLP, Shear, SAL, Steering, Instability (Day 16+ Climate Models)

#330 Postby chaser1 » Tue Jun 24, 2025 12:09 pm

Category5Kaiju wrote:Merely several days ago, the idea of June going stormless in the Atlantic seemed very real. I mean, even I believed that. And then popped up the first named storm of the season.

A cautionary tale that things in the tropics can change abruptly and that sometimes models don’t see a potential for a named storm until close range. Especially if it’s a shorty.


All of the above is very true; Heck, we could end up with one or two more named storms before July 1st if classification standards have truly "de-volve" to include:
Nominally supportive ASCAT data, no supported ship report or recon data, 6 - 12 hours of system center co-located sustained convective bursting and banding continuity, incorporating model composite reflectivity interpretation for actual surface condition verification, and overall consensus that a warm core Tropical Storm is technically defined by forming over at least 22C SST and having sustained winds near the center to reach a minimum of "30 - 35 knots" (not 39 mph).

It really is about time that updated meteorology docs/books be published to more accurately define & represent definition benchmarks. At a minimum, the standards used to define a named tropical storm should be no different regardless of whether a tropical disturbance were in the GOM, far N. Atlantic, or the far Eastern MDR. There have been more instances than I could possibly remember where an equally or more impressive disturbance in the E. MDR with better supporting ASCAT data, remained unclassified due to "no immediate risk to land or shipping interests" and/or unanimous agreement on near term condition volatility (upper wind shear, dry air intrusion, or significant decrease in SST along the immediate path).
(This edit to clearly point out that my post above is meant in NO way as bashing NHC or any forecaster, but to soley point out the need for continuity in science, nomenclature, classification & definition).
4 likes   
Andy D

(For official information, please refer to the NHC and NWS products.)

TomballEd
Category 2
Category 2
Posts: 683
Age: 61
Joined: Wed Aug 16, 2023 4:52 pm
Location: Spring/Klein area, not Tomball

Re: 2025 Indicators: SST's, MSLP, Shear, SAL, Steering, Instability (Day 16+ Climate Models)

#331 Postby TomballEd » Tue Jun 24, 2025 7:38 pm

Just peeking at the Weathernerd 10 day ECENS for the EPac and the WPac, excluding short lived systems forming well N of the tropics that barely reach gale force, the Atlantic stays dead for a while. Waiting to see if weak trade winds/WWB will warm the MDR back up in time for ASO primetime. The Euro ensembles for the WPAC suggests that will provide a substitute for a slow Atlantic. A lot of majors in the general vicinity of Hong Kong.
0 likes   

User avatar
DorkyMcDorkface
Category 3
Category 3
Posts: 887
Age: 27
Joined: Mon Sep 30, 2019 1:32 pm
Location: Mid-Atlantic

Re: 2025 Indicators: SST's, MSLP, Shear, SAL, Steering, Instability (Day 16+ Climate Models)

#332 Postby DorkyMcDorkface » Wed Jun 25, 2025 8:27 pm

The CFS is actually looking like it's trending towards more of a favorable pattern for July in recent runs, with less widespread sinking in the Atlantic, a weaker MC standing wave and more -VP over Africa.

Image
2 likes   

Please note the thougths expressed by this account are solely those of the user and are from a hobbyist perspective. For more comprehensive analysis, consult an actual professional meteorologist or meteorology agency.


Floyd 1999 | Isabel 2003 | Hanna 2008 | Irene 2011 | Sandy 2012 | Isaias 2020

User avatar
chaser1
S2K Supporter
S2K Supporter
Posts: 5462
Age: 64
Joined: Sat Oct 15, 2005 5:59 pm
Location: Longwood, Fl

Re: 2025 Indicators: SST's, MSLP, Shear, SAL, Steering, Instability (Day 16+ Climate Models)

#333 Postby chaser1 » Thu Jun 26, 2025 1:57 am

Just my opinion but your perspective of "Less widespread sinking" throughout the Atlantic during July based on the latest CFS seems....... quite the generous relative comparison to the prior forecast.
0 likes   
Andy D

(For official information, please refer to the NHC and NWS products.)

User avatar
weeniepatrol
Category 5
Category 5
Posts: 1271
Joined: Sat Aug 22, 2020 5:30 pm
Location: WA State

Re: 2025 Indicators: SST's, MSLP, Shear, SAL, Steering, Instability (Day 16+ Climate Models)

#334 Postby weeniepatrol » Thu Jun 26, 2025 2:12 am

Disgusting. Say goodbye to SSMIS.

Image
0 likes   

User avatar
DorkyMcDorkface
Category 3
Category 3
Posts: 887
Age: 27
Joined: Mon Sep 30, 2019 1:32 pm
Location: Mid-Atlantic

Re: 2025 Indicators: SST's, MSLP, Shear, SAL, Steering, Instability (Day 16+ Climate Models)

#335 Postby DorkyMcDorkface » Thu Jun 26, 2025 2:46 am

chaser1 wrote:Just my opinion but your perspective of "Less widespread sinking" throughout the Atlantic during July based on the latest CFS seems....... quite the generous relative comparison to the prior forecast.

Perhaps I was being hyperbolic with my terminology but my main focus really was on Africa and the eastern Atlantic, because that is where a -VP standing wave is most optimal. Outside of CAG season (which we are on the verge of exiting) you don't want persistent anomalous rising in the western part of the basin if you are looking for Atlantic activity since that's more likely to favor the EPAC.
4 likes   

Please note the thougths expressed by this account are solely those of the user and are from a hobbyist perspective. For more comprehensive analysis, consult an actual professional meteorologist or meteorology agency.


Floyd 1999 | Isabel 2003 | Hanna 2008 | Irene 2011 | Sandy 2012 | Isaias 2020

User avatar
cycloneye
Admin
Admin
Posts: 145232
Age: 68
Joined: Thu Oct 10, 2002 10:54 am
Location: San Juan, Puerto Rico

Re: 2025 Indicators: SST's, MSLP, Shear, SAL, Steering, Instability (Day 16+ Climate Models)

#336 Postby cycloneye » Thu Jun 26, 2025 9:08 am

That is a very strong dry signal for the next few weeks.

 https://x.com/BenNollWeather/status/1938233285965979666

0 likes   
Visit the Caribbean-Central America Weather Thread where you can find at first post web cams,radars
and observations from Caribbean basin members Click Here

OURAGAN
Category 1
Category 1
Posts: 451
Joined: Sat Aug 07, 2004 12:18 pm
Location: GUADELOUPE

Re: 2025 Indicators: SST's, MSLP, Shear, SAL, Steering, Instability (Day 16+ Climate Models)

#337 Postby OURAGAN » Thu Jun 26, 2025 12:36 pm

Yes

Image
1 likes   

OURAGAN
Category 1
Category 1
Posts: 451
Joined: Sat Aug 07, 2004 12:18 pm
Location: GUADELOUPE

Re: 2025 Indicators: SST's, MSLP, Shear, SAL, Steering, Instability (Day 16+ Climate Models)

#338 Postby OURAGAN » Thu Jun 26, 2025 12:43 pm

Below average rainfall is predicted for caribbean and the Atlantic MDR the next two weeks
0 likes   

User avatar
chaser1
S2K Supporter
S2K Supporter
Posts: 5462
Age: 64
Joined: Sat Oct 15, 2005 5:59 pm
Location: Longwood, Fl

Re: 2025 Indicators: SST's, MSLP, Shear, SAL, Steering, Instability (Day 16+ Climate Models)

#339 Postby chaser1 » Thu Jun 26, 2025 2:28 pm

DorkyMcDorkface wrote:
chaser1 wrote:Just my opinion but your perspective of "Less widespread sinking" throughout the Atlantic during July based on the latest CFS seems....... quite the generous relative comparison to the prior forecast.

Perhaps I was being hyperbolic with my terminology but my main focus really was on Africa and the eastern Atlantic, because that is where a -VP standing wave is most optimal. Outside of CAG season (which we are on the verge of exiting) you don't want persistent anomalous rising in the western part of the basin if you are looking for Atlantic activity since that's more likely to favor the EPAC.


Valid point and to what extent we continue to see continued westward expansion of that wave further into the basin, should go a long way toward suggesting the Atlantic MDR may be soon waking up (which I do get was your point to begin with 8-) )
For now though I think this progression will be a slow one.
1 likes   
Andy D

(For official information, please refer to the NHC and NWS products.)

User avatar
cycloneye
Admin
Admin
Posts: 145232
Age: 68
Joined: Thu Oct 10, 2002 10:54 am
Location: San Juan, Puerto Rico

Re: 2025 Indicators: SST's, MSLP, Shear, SAL, Steering, Instability (Day 16+ Climate Models)

#340 Postby cycloneye » Fri Jun 27, 2025 8:19 am

Not good if you want to see tropical activity.

 https://x.com/wxjerdman/status/1938546547869765947

2 likes   
Visit the Caribbean-Central America Weather Thread where you can find at first post web cams,radars
and observations from Caribbean basin members Click Here


Return to “Talkin' Tropics”

Who is online

Users browsing this forum: chaser1, Google [Bot], Ulf and 9 guests