

SSTA verification for JUN 2004:
2004 6 21.60 -1.43 26.27 -0.11 29.17 0.54 27.76 0.27
POTENTIAL ENSO Analogs using JUN SSTA (in comparison w/ the JUN 2004 verification):
2001 6 21.74 -1.29 26.35 -0.03 28.83 0.19 27.68 0.19
1995 6 22.45 -0.50 26.20 -0.18 29.01 0.37 27.59 0.09
1986 6 21.98 -0.98 26.30 -0.07 28.84 0.20 27.69 0.19
1968 6 21.60 -1.42 26.15 -0.22 28.85 0.21 27.60 0.10
1966 6 21.84 -1.18 26.20 -0.17 28.97 0.33 28.03 0.53
I was looking particularly for years which had a well defined split in the SSTA from E to W over the ENSO regions (i.e...Warm west PAC, and cold east PAC). The 5 years listed above were the closest I could find since 1950 to matching up with the verifications.
Below is the number of Tropical cyclones which formed in each of those years:
2001: 15-9-4
1995: 19-11-5
1986: 6-4-0
1968: 8-5-0
1966: 11-7-3
Average: 10-7-2
As you can see the Atlantic seasons which had similar ENSO conditions, also featured near normal activity in the Atlantic basin, with 1995, and 2001 being especially active—1986 and 1968 were the less impressive seasons with below average activity and 1966 the mid-ground.
If we track the Evolution of the ENSO in the years above, we find that 1966 and 1995 eventually saw the onset of or slow transition toward La Nina conditions. 1968 and 2001 remained for the most part neutral (however after NOV 1968, El Nino conditions eventually did develop--2001 maintained neutrality until the following summer of 2002). El Nino conditions developed in 1986.
ENSO data for JUL-NOV 1966:
1966 7 20.81 -1.03 25.49 -0.09 28.99 0.42 27.45 0.37
1966 8 20.27 -0.55 24.65 -0.30 28.73 0.28 26.79 0.08
1966 9 19.62 -0.84 24.17 -0.66 28.80 0.32 26.51 -0.13
1966 10 20.64 -0.27 24.50 -0.39 28.71 0.31 26.51 -0.09
1966 11 21.07 -0.61 24.25 -0.71 28.61 0.25 26.29 -0.22
JUL-NOV 1968:
1968 7 21.13 -0.72 25.90 0.32 28.51 -0.06 27.47 0.40
1968 8 20.73 -0.09 25.27 0.31 28.71 0.26 27.14 0.44
1968 9 20.86 0.39 24.95 0.12 28.51 0.03 26.69 0.05
1968 10 21.16 0.25 25.11 0.23 28.83 0.42 26.92 0.32
1968 11 21.35 -0.33 25.32 0.37 29.18 0.82 27.36 0.85
JUL-NOV 1986:
1986 7 21.12 -0.68 25.70 0.12 28.90 0.33 27.37 0.29
1986 8 20.97 0.18 25.02 0.07 29.04 0.58 27.15 0.45
1986 9 20.44 0.00 25.25 0.42 29.18 0.70 27.33 0.69
1986 10 21.07 0.18 25.62 0.73 29.38 0.97 27.57 0.97
1986 11 22.03 0.38 25.92 0.96 29.40 1.04 27.73 1.22
JUL-NOV 1995:
1995 7 21.23 -0.57 25.42 -0.17 28.78 0.21 27.01 -0.07
1995 8 20.01 -0.77 24.33 -0.62 28.43 -0.02 26.33 -0.38
1995 9 20.17 -0.27 24.02 -0.81 28.25 -0.23 25.96 -0.68
1995 10 20.15 -0.74 24.01 -0.88 28.07 -0.34 25.67 -0.93
1995 11 21.20 -0.44 24.03 -0.93 27.97 -0.39 25.66 -0.86
JUL-NOV 2001:
2001 7 20.88 -0.94 25.43 -0.14 29.06 0.49 27.32 0.24
2001 8 19.90 -0.90 24.72 -0.24 28.96 0.51 26.87 0.17
2001 9 19.39 -1.10 24.27 -0.57 29.14 0.66 26.55 -0.09
2001 10 19.52 -1.39 24.45 -0.45 29.01 0.60 26.59 -0.00
2001 11 20.49 -1.16 24.35 -0.61 28.96 0.59 26.45 -0.07
When we cross this w/ the current QBO (which is west and MAY have peaked)--We can eliminate 2001, 1986, and 1968 sinc ethey were East QBO years:
2001 -24.45 -21.67 -14.29 -10.81 -3.88 1.48
1995 11.74 9.53 6.98 3.43 -0.77 -4.57
1986 -5.25 -9.60 -10.21 -9.60 -8.01 -10.51
1968 -21.00 -21.82 -17.45 -14.58 -13.11 -11.36
1966 7.47 7.63 9.23 11.00 11.74 13.26
Were now left with 1966 and 1995 as prospective analogs (using only the correlations between the QBO and ENSO). Both of which were active seasons.
The point to this is, most of the data would suggest at the VERY LEAST a normal season in the Atlantic basin. This research also compliments the outcome of the connection between a stormless JUN-JUL period and the following season’s activity.
I will update this using JUL's verifications once the data is available.
Comparing this June's ENSO and QBO with similar seasons
Moderator: S2k Moderators
Forum rules

The posts in this forum are NOT official forecasts and should not be used as such. They are just the opinion of the poster and may or may not be backed by sound meteorological data. They are NOT endorsed by any professional institution or STORM2K. For official information, please refer to products from the National Hurricane Center and National Weather Service.


Thanks bahamas.
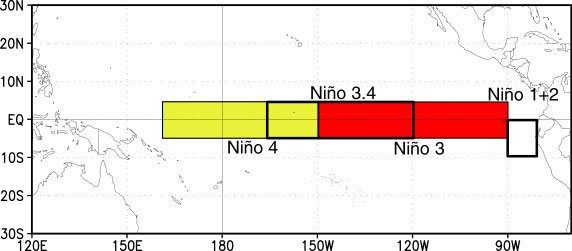
Also, here is what I'm talking about WRT the Split in the ENSO regions:
Notice the ENSO 3.4 and 4.0 regions are warming and were beginning to see evidence of the "classic" warm plume developing, however the EPAC regions 3.0 and 1+2 are still below normal. Below is a figure showing the ENSO regions:
Also, here is what I'm talking about WRT the Split in the ENSO regions:
Notice the ENSO 3.4 and 4.0 regions are warming and were beginning to see evidence of the "classic" warm plume developing, however the EPAC regions 3.0 and 1+2 are still below normal. Below is a figure showing the ENSO regions:
0 likes
-
rainstorm
rainstorm wrote:as far as the enso goes, i was reading on another message board that with 3.0 and 3.4 enso indices the troughs in augusts should be stronger and more persisitent. will that be the case?
First of all there are some things you must realize. I expect the cold SSTA in the EPAC and the warm WPAC to cancel each other out--lending to basically neutral conditions through at least SEP if not OCT. Secondly, Developing El Nino events in the QBO westerly phase normally take LONGER to intensify than those in the easterly (negative) phase.
Keep in mind you also need THREE MONTHS with SSTA of at least +0.5 DEG C in the NINO 3.4 region in order for statistical El Nino conditions to exist. Therefore meaning that the ABSOLUTE EARLIEST El Nino conditions would be declared is OCT 2004.
0 likes
Now compare the Current w/ AUG 1, 2002.
12z 7/28:
https://www.fnmoc.navy.mil/products/OTI ... nomaly.gif
8/1/02:
https://www.fnmoc.navy.mil/products/OTI ... nomaly.gif
They are so similar, it's practically disturbing. ESPECIALLY WRT to the ENSO, however the PAC SSTA configuration as a whole is VERY similar to what it was in 2002. The QBO was also west.
It should also be noted of course the 2002 was NOT a boring season. Take for example, Isidore, and Lili.
0 likes

Who is online
Users browsing this forum: No registered users and 51 guests