Maximum Hurricane Intensity Maps
Moderator: S2k Moderators
Forum rules

The posts in this forum are NOT official forecasts and should not be used as such. They are just the opinion of the poster and may or may not be backed by sound meteorological data. They are NOT endorsed by any professional institution or STORM2K. For official information, please refer to products from the National Hurricane Center and National Weather Service.
-
Huckster

- Category 1

- Posts: 394
- Age: 43
- Joined: Fri Aug 13, 2004 2:33 am
- Location: Baton Rouge, LA
- Contact:
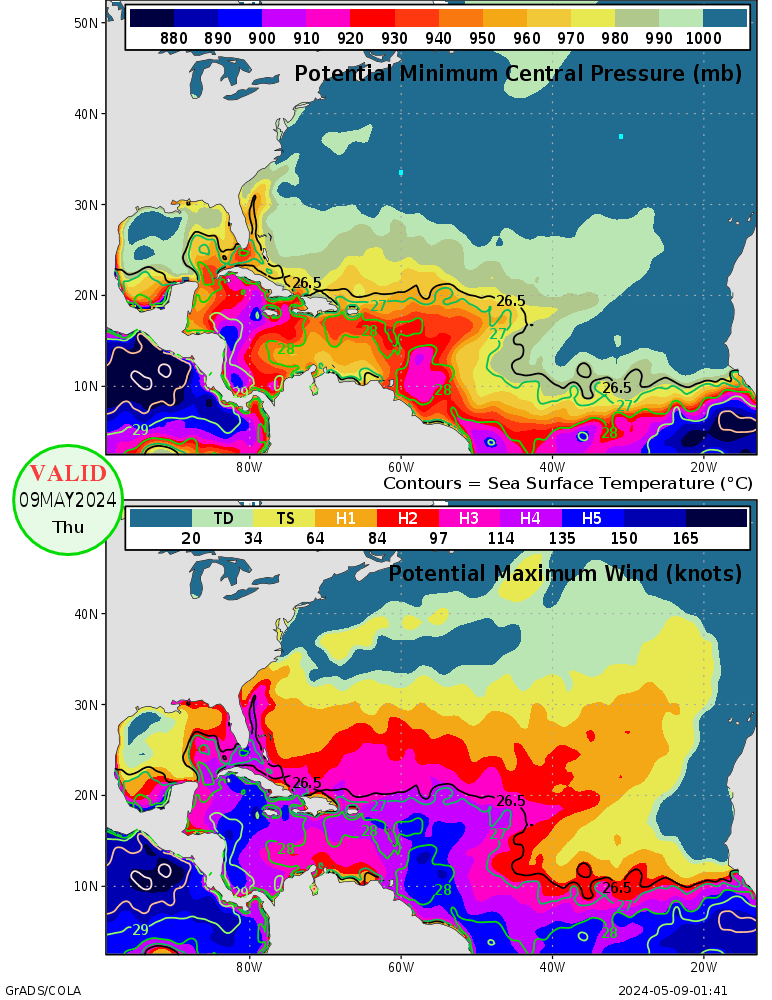
Maximum Hurricane Intensity Maps
I'm not smart enough to know exactly how these maps are calculated or work, but the best I can tell is that assuming all other conditions are favorable for intensification, this shows the maximum intensity that can be supported by the SST's. Hopefully someone else can shed some light on this.
0 likes


-
Hurricane Cheese

- Category 1
- Posts: 365
- Joined: Thu Aug 12, 2004 12:40 am
- Location: Green Bay, WI (UWGB Earth Science Alum)
That's one of the most interesting maps I've seen on Storm2k.
It certainly indicates that Dennis has the potential for Cat 4 strength.
Some potential shearing and land interaction seems to be the only thing holding down the intensity forecasts currently calling for a low-to-mid Cat 3 in the GOM.
Hopefully some professional mets can ellaborate on these maps and discuss their implications a bit further than I can (I'm still just a Bachelor of Science student )....
)....
Also, if someone can post the link where we can find updated versions of that map I'd greatly appreciate it!
It certainly indicates that Dennis has the potential for Cat 4 strength.
Some potential shearing and land interaction seems to be the only thing holding down the intensity forecasts currently calling for a low-to-mid Cat 3 in the GOM.
Hopefully some professional mets can ellaborate on these maps and discuss their implications a bit further than I can (I'm still just a Bachelor of Science student
Also, if someone can post the link where we can find updated versions of that map I'd greatly appreciate it!
0 likes
-
Hurricane Cheese
- Category 1
- Posts: 365
- Joined: Thu Aug 12, 2004 12:40 am
- Location: Green Bay, WI (UWGB Earth Science Alum)
Thanks for the link Huckster!
It certainly seems to indicate that SSTs should be sufficient for some big hurricanes in 2005, possibly starting with Dennis.
When he passes Jamaica things should get interesting, as he'll be passing into some very warm waters near the Isle of Youth south of Western Cuba....the same place Ivan and Charley experienced deepening phases.
0 likes
-
Hurricane Cheese
- Category 1
- Posts: 365
- Joined: Thu Aug 12, 2004 12:40 am
- Location: Green Bay, WI (UWGB Earth Science Alum)

These maps have been around for years. I use them occasionally but they are not updated as often or as exact as good sst maps.
The main issue i have with them is they don't show/take into account the depth of the warm water. This is the most important.
If it is 90 on the surface but only 5 feet deep, with much colder water below that, then the latent heat content is no-where near the same as 83 degree water 100 feet deep. Those numbers are shrunk obviously for easier understanding.
-Eric
0 likes
Who is online
Users browsing this forum: No registered users and 82 guests