A little over 40 pages.
I can't believe it is the sixth one out...putting everything else aside, and reading it right now.
[some time passes...]
Done.
Hardly any surprises. It is nice they put out something basic now, so everyone could read the important things that were able to be identified conclusively at this point; they can always add some detail later (hopefully more specifics on the surge, after the high water mark analysis is complete).
Highlights:
They put it at high Cat 3 at LA landfall, kept it Cat 3 at MS landfall (105kt);
there WAS a 2nd eyewall developing (I thought so!);
good discussion regarding the windfield / pressure at landfall;
they mention both the Poplarville EOC (117kt) and Pascagoula EOC (108kt) gusts as some of the highest measured gusts (and consider this...both were incomplete because the roof came off in both cases);
NOLA had winds of Cat 1 or 2 strength;
strongest winds were over water to the east;
they danced a bit around the surge, did not have a strong analysis, their final conclusion was a Cat 3 surge enhanced by Cat 4/5 waves that Kat had generated earlier; they mentioned the 55 foot wave height of buoy 42040, south of Dauphin Island (the same buoy that recorded the 50 ft wave height last year with Ivan);
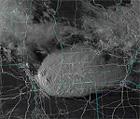
documented that surge went at least six miles inland in many locs, and 12 miles inland along bays and rivers, but flooding was actually much more significant than that along rivers...the Pascagoula River basin was flooded to at least twice that distance inland, right up into George County. There are a couple of websites out there with satellite images, here is one showing the significant flooding right up to the county line (at least 20 miles inland)...bottom two photos...notice how the cities of Pascagoula and Moss Point have essentially become a large island, between flooding of the Pascagoula and Escatawpa Rivers:
http://www.nasa.gov/vision/earth/lookin ... flood.html
here is the other set of images I was looking for...showing the flooding of rivers well inland in the MS floodplain, and a new inlet off the Pascagoula River; just below these images are ones showing how Katrina completed the destruction of the western end of Dauphin Island that Ivan started last year (and this is at low tide):
http://www.nasa.gov/vision/earth/lookin ... trina.html
They underemphasized the significance of the surge along the eastern MS coastline. There was Cat 4 surge from almost the western MS border to just east of the Pass, but solid Cat 3 surge all the way into Bayou La Batre AL, with significant surge in all parts of Jackson Cty but especially at the Pascagoula River basin. There was an area of Pascagoula proper that was flooded that was Cat 4 level from the SLOSH runs (at Hwy 90), and other small locations here and there that were Cat 4 level and received flooding, throughout the county.
can't believe they bothered to mention the roofing material that peeled off the Superdome (bfd!...it wasn't even structural damage);
the 90kt gust from Dauphin Island station was omitted, however the USS Alabama 90kt (unofficial) gust and Dauphin Island buoy gust (89kt) were not;
finally, this was the biggest deal for me, two Airborne Doppler radar-derived wind speed cross sections looking towards the east, documenting the difference in the wind gradient between the 28th and the 29th, clearly showed strong winds between 55 and 80 km, and past 90 km, to the east of the center, early morning just before MS landfall, which reaches just about to eastern Biloxi Bay where my brother at the sheriff's substation said they experienced fairly strong winds.