Possible January 23-31, 2007 Cold Period: Some Thoughts

Winter Weather Discussion

Moderator: S2k Moderators

Forum rules

The posts in this forum are NOT official forecast and should not be used as such. They are just the opinion of the poster and may or may not be backed by sound meteorological data. They are NOT endorsed by any professional institution or STORM2K.

Help Support Storm2K
Message
Author
donsutherland1
S2K Analyst
S2K Analyst
Posts: 2718
Joined: Mon Sep 15, 2003 8:49 pm
Location: New York

Possible January 23-31, 2007 Cold Period: Some Thoughts

#1 Postby donsutherland1 » Wed Jan 17, 2007 2:07 pm

With historic experience providing some useful insight into the peak warmth of recent blowtorch events during the January 5-7, 2007 and January 12-15, 2007 timeframes, perhaps such an examination might be somewhat useful with respect to the magnitude of cold that is possible during the January 23-31, 2007 timeframe.

Two points are in order:
- The Northern Hemisphere has continued to warm in recent years (cold anomalies tending to be less expansive and less severe, on average).
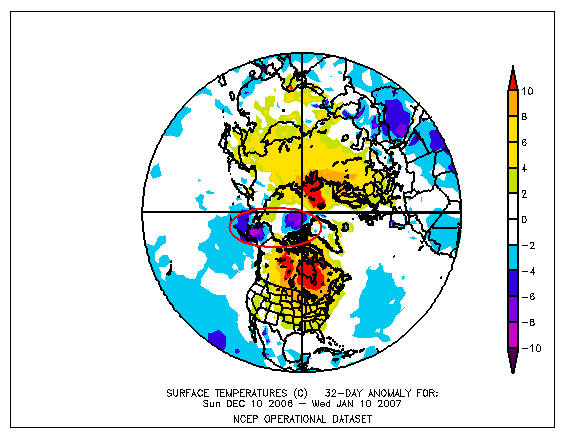
- December 2006 saw only a small portion of the Northern Hemisphere average below normal, which is in stark contrast to past seasons in which long-duration, much below normal readings covered a large part of the CONUS.

These two points will likely argue for some modification from historic figures. However, the area of cold anomalies has been improving and this development may enhance prospects for a colder than normal February if the pattern cooperates. Nevertheless, I still don't expect a large part of the CONUS to be severely cold for the month as a whole along the lines of February 1978.

Northern Hemisphere Anomalies (using 2° increments) for December 1-31, 2006:
Image

Northern Hemisphere Anomalies (using 2° increments) for December 10, 2006-January 10, 2007:
Image

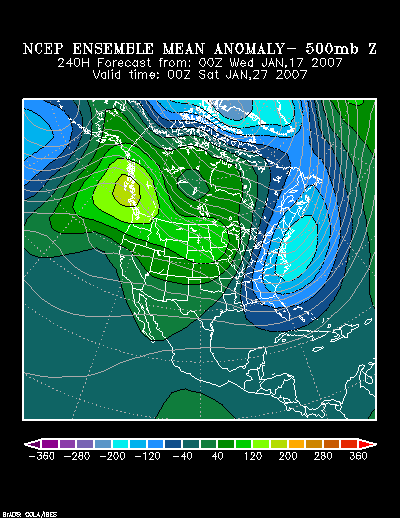
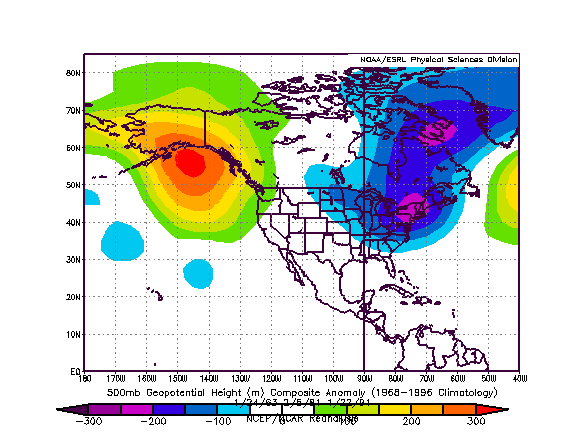
The NCEP Ensemble 500 mb anomalies forecast for 240 hours reasonably resemble those seen on January 24, 1963, February 5, 1981, and January 22, 1991, particularly with respect to North America.

NCEP 500 mb Anomalies (240 hours): North America:
Image

Composite Analog 500 mb Anomalies: North America:
Image

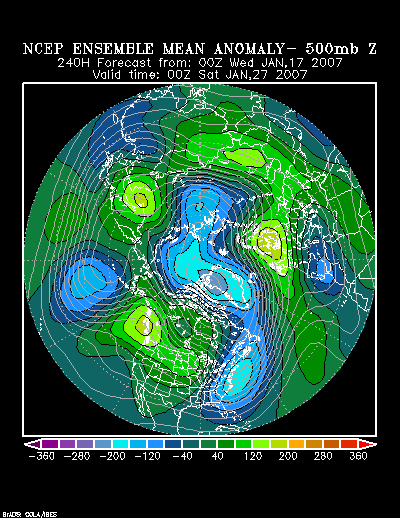
Reasonable similarity also exists across the Northern Hemisphere.

NCEP 500 mb Anomalies (240 hours): Northern Hemisphere:
Image

Composite Analog 500 mb Anomalies: Northern Hemisphere:
Image

The NCEP Ensemble forecast for 240 hours shows a sizable area of cold air:
Image

Lowest temperature during the past cold outbreaks referenced above for select cities:

January 21-29, 1963:
Atlanta: -3°
Boston: 4°
Burlington: -17°
Detroit: -13°
New York City: 4°
Philadelphia: -2°
Richmond: 9°
Washington, DC (DCA): 3°

February 3-6, 1981:
Atlanta: 15°
Boston: 13°
Burlington: 3°
Detroit: 1°
New York City: 8°
Philadelphia: 9°
Richmond: 12°
Washington, DC (DCA): 18°

January 21-26, 1991:
Atlanta: 20°
Boston: 4°
Burlington: -9°
Detroit: 2°
New York City: 10°
Philadelphia: 13°
Richmond: 16°
Washington, DC (DCA): 18°

Given the earlier caveats, I do not expect an air mass that rivals that of January 1963. The latter two are probably more representative of the peak magnitude of cold that one might see during the January 23-31 timeframe.

Therefore, based on a combination of the historic information adjusted to consider the two points made near the beginning of this post and consistent runs of the NCEP ensemble suite over the past few days, I believe the lowest readings of the January 23-31 timeframe will be as follows:

Subzero cold in Burlington; Single digits in Boston; Lows near or below 15° in Philadelphia and New York City; Teens in Washington, DC, Richmond, and Atlanta. A single-digit low in either New York City or Philadelphia could not be completely ruled out. Subzero cold in either of these cities is very unlikely.

Note: My cutting off the analysis of the cold period at 1/31 does not mean that I expect the pattern to break down at the end of the month. It was done to narrow the timeframe for which the information would be verified. The synoptic pattern could, by month's end, be evolving differently e.g., I expect a stormier pattern for a larger part of the East to begin to develop sometime in the closing days of January or opening days of February.
0 likes   

User avatar
HarlequinBoy
Category 5
Category 5
Posts: 1400
Age: 34
Joined: Wed Nov 29, 2006 1:57 am
Location: Memphis

#2 Postby HarlequinBoy » Wed Jan 17, 2007 2:45 pm

Another great and very informative post! Thanks so much!
0 likes   

cpdaman
Category 5
Category 5
Posts: 3131
Joined: Sat Jun 10, 2006 11:44 am
Location: SPB county (gulf stream)

#3 Postby cpdaman » Wed Jan 17, 2007 10:10 pm

thank you DON we are lucky to have you here

by they way do you know if the cold effected south fl in those 3 older arctic outbreaks i.e orlando, west palm beach
0 likes   

donsutherland1
S2K Analyst
S2K Analyst
Posts: 2718
Joined: Mon Sep 15, 2003 8:49 pm
Location: New York

#4 Postby donsutherland1 » Thu Jan 18, 2007 12:28 am

Thanks Cpdaman.

In each of these cold periods, the Orlando area experienced colder than normal conditions. The lowest temperature for each of these outbreaks was:

January 21-29, 1963: 34°
February 3-6, 1981: 31°
January 21-26, 1991: 39°
0 likes   

donsutherland1
S2K Analyst
S2K Analyst
Posts: 2718
Joined: Mon Sep 15, 2003 8:49 pm
Location: New York

#5 Postby donsutherland1 » Thu Jan 18, 2007 12:29 am

Thanks Micah_R.
0 likes   

ncwx
Tropical Low
Tropical Low
Posts: 27
Joined: Tue Sep 16, 2003 10:33 pm

Thanks DS

#6 Postby ncwx » Thu Jan 18, 2007 10:42 am

Thank you for your in depth analysis and research. Your accuracy and verifications are very useful. I have been impressed.
0 likes   

donsutherland1
S2K Analyst
S2K Analyst
Posts: 2718
Joined: Mon Sep 15, 2003 8:49 pm
Location: New York

#7 Postby donsutherland1 » Thu Jan 18, 2007 7:39 pm

Thanks NCWX.
0 likes   

donsutherland1
S2K Analyst
S2K Analyst
Posts: 2718
Joined: Mon Sep 15, 2003 8:49 pm
Location: New York

#8 Postby donsutherland1 » Fri Jan 19, 2007 12:19 pm

Several quick thoughts:

1) My thinking concerning the magnitude of cold during the 1/23-31 timeframe remains reasonably on track.

2) I received an e-mail inquiry concerning my thoughts about a possible big snowstorm for New Jersey (whether the question was intended to be another way of phrasing the "how much for Philly?" inquiry is up for question ;)) early next week e.g., whether I had changed my thinking. I still don't expect any such situation. The synoptic pattern is not similar to that which prevailed during KU-events that impacted New Jersey with significant accumulations of snow. Of course, I could be wrong or things could evolve differently. For now, I just don't believe such an outcome is likely.

If one examines, the 500 mb anomalies depicted by the NCEP ensemble 1/19 0z suite, one finds:

144 hours (1/25 0z): an elongated, positively-tilted trough in the East
168 hours (1/26 0z): an elongated, positively-tilted trough in the East
192 hours (1/27 0z): the trough has gone neutral centered well off the Mid-Atlantic
216 hours (1/28 0z): a negatively-tilted trough centered well off Maine

This implies to me an rapidly deepening system. It also suggests to me that the lower Mid-Atlantic/Southeast and then afterward eastern New England would stand the best chance of seeing meaningful precipitation from any systems prior to 1/28. Lighter amounts could occur in the much-watched Baltimore-NYC area, but any events during that timeframe probably won't be a big deal there.

3) The ensemble suite and the 1/19 12z run of the GFS offer support for the possibility of an appreciable (or perhaps greater) snowfall in parts of eastern New England (including the Boston area). I believe such an idea seems reasonable given the pattern.

4) Later, around 336 hours (2/2 0z), the large eastern trough goes negative and stays negative through at least 360 hours. With an active southern jet and ample cold, this might offer a signal of a much larger risk of appreciable or greater snowfall.

All said, I still think the best snows will be limited until at least 1/28, with eastern New England having a chance to "cash in" during that timeframe. The start of the 1/28-2/20 period, during which I expect a large part of the East to see a disproportionate share of its seasonal snowfall, looks interesting.

Note: a post concerning the Plains States and North Carolina will be coming later today.
0 likes   

donsutherland1
S2K Analyst
S2K Analyst
Posts: 2718
Joined: Mon Sep 15, 2003 8:49 pm
Location: New York

#9 Postby donsutherland1 » Fri Jan 19, 2007 1:37 pm

The coming weekend will likely see a moderate to significant snowfall affect a part of the Plains States. Per a combination of the ensemble guidance and 12z NAM and GFS, I believe southern Oklahoma/southern Missouri/northern Texas will be at the highest risk of seeing a significant amount of sleet and/or freezing rain. North of there, a solid 3"-6" of snow with locally higher amounts around 8" should occur.

A quick breakdown:

Kansas City: 3"-6" Mostly snow
Little Rock: A prolonged period of sleet at the onset is possible. The precipitation will likely transition to rain. At the height of the storm, some sleet pellets could be mixed with the rain.
Oklahoma City: 3"-6" snowfall with a lot of sleet early on and perhaps some sleet/freezing drizzle at the end
St. Louis: 3"-6" snowfall--could begin with some sleet
Tulsa: 3"-7" snowfall (some sleet)
0 likes   

donsutherland1
S2K Analyst
S2K Analyst
Posts: 2718
Joined: Mon Sep 15, 2003 8:49 pm
Location: New York

#10 Postby donsutherland1 » Fri Jan 19, 2007 1:47 pm

The 1/19 12z MOS (MEX) now shows Orlando (MCO) getting down to 37° during the cold that is subject to this thread. That's 11° lower than yesterday's figure.
0 likes   

Burn1
Tropical Storm
Tropical Storm
Posts: 211
Joined: Sat Aug 28, 2004 10:13 pm

#11 Postby Burn1 » Fri Jan 19, 2007 3:10 pm

donsutherland1 wrote:The 1/19 12z MOS (MEX) now shows Orlando (MCO) getting down to 37° during the cold that is subject to this thread. That's 11° lower than yesterday's figure.


When they start showing Orlando come in around 25 then we may be talking some cold stuff for Florida....37 isn't any big deal for Orlando....
However considering how warm it has been throughout the state...37 would be a monumental cold blast for this winter :lol:
0 likes   

JonathanBelles
Professional-Met
Professional-Met
Posts: 11430
Age: 35
Joined: Sat Dec 24, 2005 9:00 pm
Location: School: Florida State University (Tallahassee, FL) Home: St. Petersburg, Florida
Contact:

#12 Postby JonathanBelles » Fri Jan 19, 2007 3:38 pm

is there a link to this information so that i can look at it from my area.
0 likes   

donsutherland1
S2K Analyst
S2K Analyst
Posts: 2718
Joined: Mon Sep 15, 2003 8:49 pm
Location: New York

#13 Postby donsutherland1 » Fri Jan 19, 2007 5:08 pm

Fact789,

You can find the MOS (MEX) data here: http://www.nws.noaa.gov/mdl/synop/produ ... rm.mex.htm
0 likes   

aggiecutter
Category 5
Category 5
Posts: 1753
Joined: Thu Oct 14, 2004 9:22 pm
Location: Texarkana

#14 Postby aggiecutter » Fri Jan 19, 2007 7:50 pm

The intellectually homeless needs a little help here. I need someone to explain of few of the variables on the MOS.

KTXK GFSX MOS GUIDANCE 1/19/2007 1200 UTC
FHR 24 36| 48 60| 72 84| 96 108|120 132|144 156|168 180|192
SAT 20| SUN 21| MON 22| TUE 23| WED 24| THU 25| FRI 26|SAT CLIMO
N/X 35 38| 33 48| 35 46| 30 46| 33 50| 31 50| 28 50| 33 36 55
TMP 36 36| 35 45| 37 41| 32 41| 34 44| 33 44| 31 45| 35
DPT 29 31| 32 37| 31 32| 28 24| 29 28| 26 23| 24 26| 28
WND 4 9| 9 5| 5 7| 7 8| 8 13| 11 14| 6 8| 5
P12 66 100|100 13| 20 21| 34 20| 17 17| 14 9| 12 7| 12999999
P24 100| 100| 32| 37| 31| 18| 12| 999
Q12 1 4| 4 0| 0 0| 0 0| 0 0| 0 0| |
Q24 4| 4| 0| 0| 0| 0| |
T12 5 4| 6 2| 3 2| 6 1| 3 4| 2 0| 1 4| 5
T24 | 6 | 5 | 8 | 5 | 6 | 1 | 6
SNW 0| 0| 9| 9| 9| | |

What variable does n/x represent along with p12,p24,Q12,Q24,T12,T24 and the numbers that correspond with them. Are these numbers percentiles of probability or expected amounts of precipitation. For example, SNW, I know that means snow, but what about the nine in the columns to the right of it.
0 likes   

donsutherland1
S2K Analyst
S2K Analyst
Posts: 2718
Joined: Mon Sep 15, 2003 8:49 pm
Location: New York

#15 Postby donsutherland1 » Fri Jan 19, 2007 10:31 pm

Aggiecutter,

N=daily minimum temperature
X=daily maximum temperature
P12=12-hour probability of precipitation
P24=24-hour probability of precipitation
Q=qpf hence Q12 = 12-hour qpf forecast (one should use the categorical tables to understand what the numbers mean e.g., Q12 4 means that 0.50"-0.99" qpf is forecast for the 12-hour period
T refers to thunderstorms

A full explanation (including the categorical amounts) can be found at: http://www.nws.noaa.gov/mdl/synop/mexcard.htm
0 likes   

aggiecutter
Category 5
Category 5
Posts: 1753
Joined: Thu Oct 14, 2004 9:22 pm
Location: Texarkana

#16 Postby aggiecutter » Fri Jan 19, 2007 11:22 pm

Thanks Don, much appreciated.
0 likes   

User avatar
ohiostorm
Category 5
Category 5
Posts: 1582
Age: 40
Joined: Sat Oct 12, 2002 2:51 pm
Location: Orlando, FL
Contact:

#17 Postby ohiostorm » Sat Jan 20, 2007 10:59 am

I just read my forecast discussion and they hinted the possibility of a significant east coast storm setting up next week. Any thoughts on this?
0 likes   

User avatar
Stephanie
S2K Supporter
S2K Supporter
Posts: 23843
Age: 63
Joined: Thu Feb 06, 2003 9:53 am
Location: Glassboro, NJ

#18 Postby Stephanie » Sun Jan 21, 2007 11:41 am

ohiostorm wrote:I just read my forecast discussion and they hinted the possibility of a significant east coast storm setting up next week. Any thoughts on this?


My local news mets have been hinting at that possibility. TWC has FINALLY put "flurries and wind" up for Thursday.
0 likes   

User avatar
TampaFl
S2K Supporter
S2K Supporter
Posts: 1904
Age: 67
Joined: Thu Sep 04, 2003 11:23 am
Location: Tampa, FL

#19 Postby TampaFl » Sun Jan 21, 2007 12:16 pm

Goood afternoon Don. Great insite to this cold out break. What are your thoughts about Florida getting an artic outbreak with a major freeze? There have been rumors that Florida will have a major, possible devestating hard freeze for the citrus areas around the first week of Feb. It is getting awfully late in the season for Florida to be hit with a devestating freeze into the citrus areas. Climo & history has had Florida's coldest temperatures ever recorded in the month of Dec. & Jan. Plus I cannot recall a time when California & Florida citrus were devestated by freezes in the same year. Thoughts and comment greatly appreciated. Thanks.
0 likes   

donsutherland1
S2K Analyst
S2K Analyst
Posts: 2718
Joined: Mon Sep 15, 2003 8:49 pm
Location: New York

#20 Postby donsutherland1 » Wed Jan 24, 2007 1:24 pm

The January 25-27, 2007 Cold Shot: Some Quick Thoughts

An Arctic front will push through the region tomorrow, touching off snow showers and some locally-heavier snow squalls. Allentown, Boston, Harrisburg, Hartford, New York City, Newark, Philadelphia, Providence, and Worcester should all pick up a coating to perhaps an inch of snow.

A few of those places might pick up somewhat more than an inch of snow. The best prospect for that somewhat heavier accumulation exists in Allentown, Harrisburg, Newark, and Philadelphia.

The lowest readings on Friday should be as follows:

Allentown: 9°
Baltimore: 15°
Boston: 9°
Burlington: -5°
Harrisburg: 12°
Hartford: 6°
New York City: 12°
Newark: 12°
Philadelphia: 13°
Providence: 10°
Richmond: 18°
Washington, DC: DCA: 16°; IAD: 14°
Worcester: 4°
0 likes   


Return to “Winter Weather”

Who is online

Users browsing this forum: No registered users and 8 guests