RL3AO wrote:Charley?
YEP

snip
Tropical Cyclone Report
Hurricane Charley
9 - 14 August 2004
Richard J. Pasch, Daniel P. Brown, and Eric S. Blake
National Hurricane Center
18 October 2004
Revised: 5 January 2005
Hurricane Charley strengthened rapidly just before striking the southwestern coast of Florida as a Category 4 hurricane on the Saffir-Simpson Hurricane Scale. Charley was the strongest hurricane to hit the United States since Andrew in 1992 and, although small in size, it caused catastrophic wind damage in Charlotte County, Florida. Serious damage occurred well inland over the Florida peninsula.
a. Synoptic History
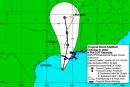
A tropical wave emerged from western Africa on 4 August. Radiosonde data from Dakar showed that this wave was accompanied by an easterly jet streak of around 55 kt near the 650 mb level. The wave also produced surface pressure falls on the order of 5 mb over 24 h near the west coast of Africa. On satellite images this system was not particularly impressive just after crossing the coast, since it had only a small area of associated deep convection. As the wave progressed rapidly westward across the tropical Atlantic, the cloud pattern gradually became better organized, with cyclonic turning becoming more evident in the low clouds. The first center position estimates were given by the Tropical Analysis and Forecast Branch (TAFB) and the Satellite Analysis Branch (SAB) in the vicinity of 9-10°N, 47°W at 2345 UTC 7 August, although at that time the system was still too weak to classify by the Dvorak technique. The first Dvorak T-numbers were assigned 24 h later, when the system was centered near 11°N, 55°W. Curved banding of the deep convection became better defined over the ensuing 12 h, and this, along with surface observations from the southern Windward Islands, indicated that a tropical depression had formed by 1200 UTC 9 August, centered about 100 n mi south-southeast of Barbados. Figure 1 depicts the "best track" of the tropical cyclone's path. The wind and pressure histories are shown in Figure 2 and Figure 3, respectively. Table 1 is a listing of the best track positions and intensities.


