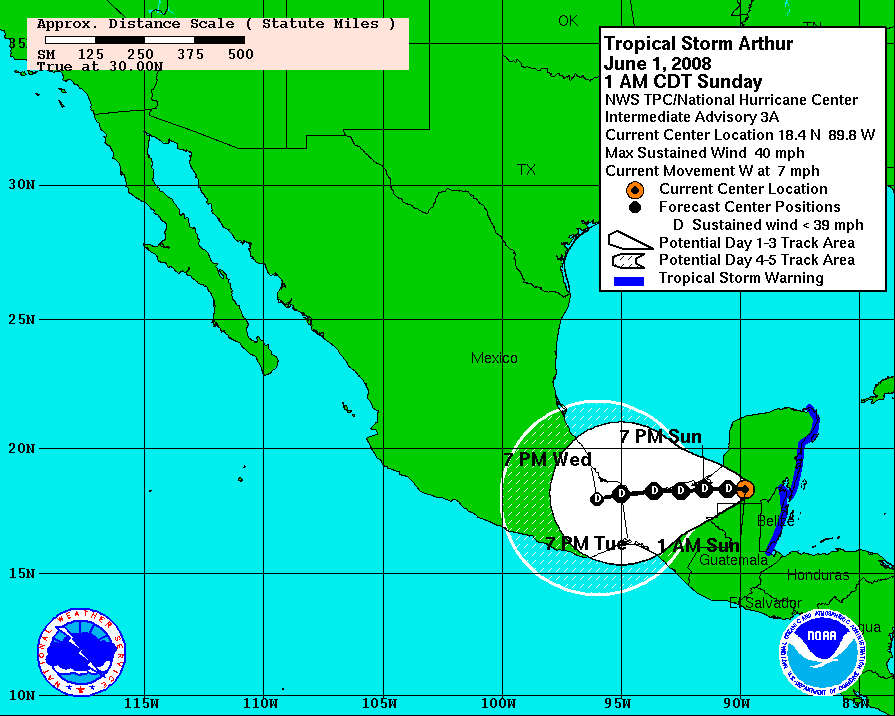
About two years ago I tried to create an NHC error cone. After a long time trying, I failed miserably at it. Problem is, what is the official cone? It is based on the error, but how should it look? I spent along time making good progress seemingly, other than when points were close together, but finally realized something, I didn't know how it should work because I didn't know how the official cone was constructed. The "cone of uncertainty" is different everywhere you look. (and not just on TWC where they create their own cone)
I realized that until there is something proper laid out, I couldn't do the one the NHC does. I thought about trying to inquire to the NHC about it, but I'm sure they have better things to do. Does anyone know of a scientific paper or something that lays out how it is done?
I think I have a work around for the problems however, though some sacrifices must be made. Take a look here:
http://www.tropicalatlantic.com/temp/errorcones.jpgThere still is the problem of whether lines should be straight or curved. I don't have anything scientific to base a curve on. Is there some formula that could generate a curve that would approximate an imaginary error circle at every point on the line? Way too confusing! So I would think the best way would be the straight line method.
You can see the examples. You are creating one shaded region at a time between circles. From the 0 to 12, 12, to 24, and so on. The sacrifices? The black line outlining the whole thing. In Google Earth and Google Maps, which is where I will eventually design mine, I see it as a positive. You can choose what to display. You can have all of the example I showed, except the third row of images, which has a line outlining all of them. The math would get all screwy with so many overlapping circles. I went nuts when I tried to figure it out.
Now you could probably create the cone that is exampled at the end in an image like you have. However, it has a fill. If you had a solid fill, all would be good. If you have a transparent fill, like you can do in Google Earth, then overlapping circles would, I think, but have yet to get around to trying it, overlap with a stronger color where the parts of the cone overlapped.
But, that is the only idea I have.
And this idea is still unofficial because I don't know the specifics of how the NHC uses those error circles. So if I create one, I don't know how to even describe it. But, since I would make error circles and tons of other data available as overlays in different combinations, perhaps people would understand the complexities.
If you ever find out anything about the error cone, let me know.


