El Nino may have reached the peak of the mountain and go down from here.However,I prefer to wait a little more to see trends in that direction as is the first time the Aussies are saying that.
http://www.bom.gov.au/climate/enso/
Summary: Pacific Ocean warming near its peak
Central Pacific Ocean temperatures remain well above El Niño thresholds. Trade wind strength returned to near normal over the past fortnight, slightly reducing the excessive warmth of the equatorial Pacific Ocean. However, significant areas remain more than 2°C above average at the surface, and over 4°C warmer than normal at depth.
Climate models suggest that tropical Pacific temperatures may have peaked for this event, though are likley to remain above El Niño thresholds until the southern autumn.
Despite a rise in recent days, the Southern Oscillation Index has generally remained at levels typical of an El Niño event over the past fortnight. Similarly, cloudiness and rainfall near the equator have remained enhanced, typical of a mature El Niño event. The influence of El Niño events on Australian rainfall typically declines by mid to late summer.
In Brief
The tropical Pacific Ocean sea surface remains significantly warmer than the long-term average in central and eastern areas.
The sub-surface water of the tropical Pacific remains warmer than the long-term average.
The latest approximate 30-day SOI value is −5; the monthly value for December was −7.
Trade winds have strengthened to near normal conditions across the Pacific.
Cloudiness near the date-line remains above average.
All of the above are consistent with a moderate strength El Niño event, which most leading international computer models surveyed by the Bureau predict will persist through the southern hemisphere summer, but decline thereafter.
Details
Sea surface temperatures (SSTs) across the tropical Pacific Ocean remained above normal for the month of December. The SST anomaly map for December is available here; the map shows warm anomalies in excess of +1°C covering most of the tropical Pacific east of the dateline, with anomalies exceeding +2°C in parts of the central and far eastern Pacific. The map also shows near-normal SSTs covering most of the western Pacific and northern waters around Australia. The monthly NINO indices for December were +1.5°C, +1.8°C and +1.3°C for NINO3, NINO3.4 and NINO4 respectively. NINO3 and NINO 3.4 warmed when compared with November values; NINO3 by approximately 0.2°C and NINO3.4 by 0.1°C. NINO4 cooled by approximately 0.2°C over the same time. For both NINO3 and NINO3.4, the December values were the warmest monthly values since the El Niño of 1997/98.
In terms of weekly data, the most recent NINO indices are +1.4°C, +1.7°C and +1.4°C for NINO3, NINO3.4 and NINO4 respectively for the week ending 3 January. When compared with two weeks ago all indices have fallen slightly; NINO4 by -0.1°C, NINO3 and NINO3.4 by -0.2°C. The 7-day SST anomaly map shows warm anomalies in excess of +1°C covering most of the tropical Pacific east of the dateline. In some areas, particularly between 170°W and 150°W, ocean temperatures are more than +2°C above normal, with a small regions having anomalies in excess of +3°C. When compared with anomalies observed two weeks ago, the central and eastern Pacific sea surface has cooled slightly. An animation of recent SST changes is available.
A four-month sequence of sub-surface Pacific Ocean equatorial temperature anomaly is available here. The sequence shows the rapid warming of the sub-surface through October and November, with anomalies greater than +4°C present in the eastern Pacific, between 110°W and 140°W. However, weak negative anomalies that propagated eastwards during December displaced some of the warm anomalies along the thermocline, particularly in the central Pacific. A recent map for the 5 days ending 3 January shows some cooling of the sub-surface in the western Pacific, with cool anomalies displacing the warm anomalies on and to the east of the dateline. When compared with two weeks ago, the far eastern Pacific sub-surface has cooled slightly although this region remains warmer than normal. An animation of recent sub-surface changes changes is available.
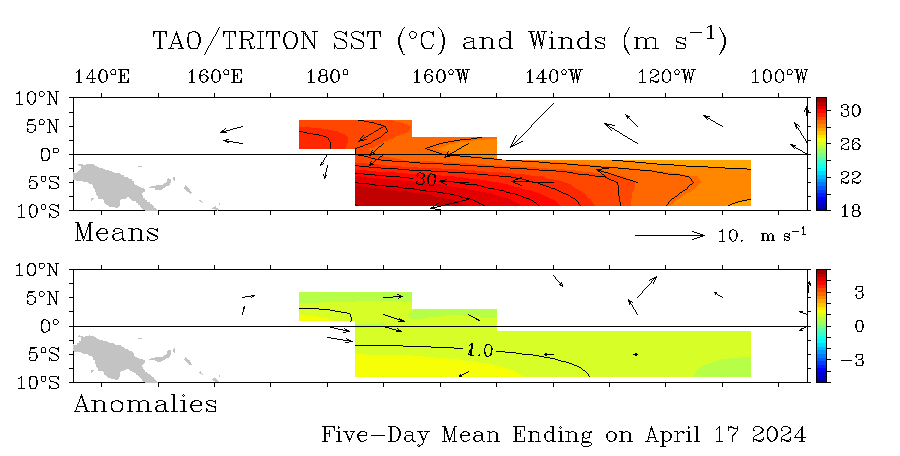
Trade winds have strengthened across the equatorial Pacific after having been weaker than normal throughout much of December, the result of a westerly wind burst entering the western Pacific. The latest weekly wind anomalies are shown in the TAO/TRITON map (small image above) for the five days ending 3 January. The map shows that on a weekly scale weak easterly anomalies are now evident in the central and eastern Pacific.
The SOI has risen over the past two weeks after being relatively stable for most of December; although the SOI is still at values typical of an El Niño event. The current 30-day SOI value (4 January) is −5. The monthly value for December was −7. The current SOI values are typical for this stage of an El Niño event SOI graph, SOI table).
Cloudiness near the date-line over the equatorial Pacific has been generally above normal (i.e. Outgoing Longwave Radiation below average) since July, in keeping with the development of the El Niño event. Cloudiness for the past two months has been well above average, apart from a short period of decreased cloudiness in mid-December.
In the latest survey of eight international computer models, all are predicting warm conditions to persist throughout the southern hemisphere summer. A majority of computer models are predicting that Pacific Ocean SSTs will start to cool by March next year, which is the typical timing for the decay of El Niño events. Recent forecasts from the POAMA model, run daily at the Bureau of Meteorology, show a continuation of warming with SSTs remaining above El Niño thresholds through the summer months.


