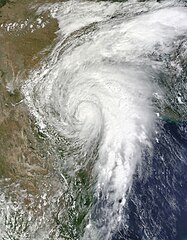
Wow, today is the 18th anniversary of the storm that started it all for me. It kind of amazes me that I can remember that day so vividly, yet I have no memory of 9/11(my mother must have done an insane job shielding my younger sister and I from it when it happened). I remember on that day my friend and her older sister were with my mom, baby sister, and I. It was a bit weird really, my friend’s sister felt off the whole day and was crying. When the storm actually happened(we were living in Arlington at the time) my family and my friends huddled into the bathroom. My parents bought our tv into the bathroom/closet(I can remember where it was at as I still remember the layout of the house, but I can’t remember if it was a bathroom or closet lol). My friend and I started dancing because we thought it was a party(I was only 3 and she was still 2). What I don’t remember is my parents told me they took me to see some of the damage later. I do remember asking if a house that was currently being built was broken lol.
Now, with the meteorology part of the day. There’s not near as much information on the day as some of our other outbreaks like the April 3rd 2012 outbreak, but there’s still some good info on the SPC archive page.
Now the SPC had a Moderate risk for extreme Southern Oklahoma and most of North Central Texas.

When analyzing a storm system/date, it seems like most meteorologist like to start with the upper air charts and read from top to bottom. I personally like to start with the skew-t in past events. It’s kind of like a broad map that gives you an idea of the atmosphere on that day.

Taking a quick glance at the 12z Skew-t it doesn’t instantly blow you out of the water, but if you look past the temperature inversion(which aren’t uncommon in the morning) The skew-t is very close to the Miller-I sounding aka “Loaded Gun”. Surface and midlevel winds are impressive speed wise, but there is some turning.

Looking at the 0z sounding, we don’t get a full skew-T, however I believe the balloon only needs to reach 400mb to be considered a successful launch. Nonetheless, the temperature inversion is gone, the 850 level still had a low dewpoint depression and a warm temperature, while the 700mb level was dry(which is what you want in a loaded gun sounding). Surface winds are still fairly weak(especially for a significant tornado) but, there is some fairly impressive turning occurring at the surface, which was a likely cause of getting strong tornadoes. Unfortunately, we aren’t able to see the 300mb level and must look towards the upper level maps to see whether or not there was a jet streak.
Looking at the 0z 250 and 350mb chart there does appear to be a jet streak over Texas.


Adding in the 500mb chart looking at the 12z and 0z and boy does that ridge put a move on.


It goes from the Texas Panhandle to just east of the DFW metroplex. The upper level charts show that there’s likely upper level divergence just west and around the metroplex. 700 and 850mb charts show a similar story to the 0z skew-t, however the 850 chart seems a bit weird to me. It show a temp of 16 degrees C and what I assume the dewpoint is at 12 degrees C(which would agree with the skew-t and also happens to be somewhat of a magic number for severe weather) but, from what I learned, 850 charts and any other non-surface charts use dewpoint depressions, but is seems like this map used a mixture.
To sum things up, this was an important weather date in DFW, though not a bunch of tornadoes, the ones that did occur were powerful. The parameters didn’t scream at you like some of the big tornadoes in Oklahoma or large scale outbreaks, but there was enough to come together at the right(or wrong time) likely including the LLJ that allowed for this event to happen. This event should be an example to take every severe weather threat seriously because there doesn’t need to be a bunch of tornadoes to make an event bad. It only takes one tornado to be in the wrong place and cause a loss of life and property.
An alumnus of The Ohio State University.
Your local National Weather Service office is your best source for weather information.


 When analyzing a storm system/date, it seems like most meteorologist like to start with the upper air charts and read from top to bottom. I personally like to start with the skew-t in past events. It’s kind of like a broad map that gives you an idea of the atmosphere on that day.
  Taking a quick glance at the 12z Skew-t it doesn’t instantly blow you out of the water, but if you look past the temperature inversion(which aren’t uncommon in the morning) The skew-t is very close to the Miller-I sounding aka “Loaded Gun”. Surface and midlevel winds are impressive speed wise, but there is some turning.
  Looking at the 0z sounding, we don’t get a full skew-T, however I believe the balloon only needs to reach 400mb to be considered a successful launch. Nonetheless, the temperature inversion is gone, the 850 level still had a low dewpoint depression and a warm temperature, while the 700mb level was dry(which is what you want in a loaded gun sounding). Surface winds are still fairly weak(especially for a significant tornado) but, there is some fairly impressive turning occurring at the surface, which was a likely cause of getting strong tornadoes. Unfortunately, we aren’t able to see the 300mb level and must look towards the upper level maps to see whether or not there was a jet streak.


 It goes from the Texas Panhandle to just east of the DFW metroplex. The upper level charts show that there’s likely upper level divergence just west and around the metroplex. 700 and 850mb charts show a similar story to the 0z skew-t, however the 850 chart seems a bit weird to me. It show a temp of 16 degrees C and what I assume the dewpoint is at 12 degrees C(which would agree with the skew-t and also happens to be somewhat of a magic number for severe weather) but, from what I learned, 850 charts and any other non-surface charts use dewpoint depressions, but is seems like this map used a mixture.


