2020 Indicators: SST's / SAL / MSLP / Steering / Shear / Instability / Sat Images
Moderator: S2k Moderators
Forum rules

The posts in this forum are NOT official forecasts and should not be used as such. They are just the opinion of the poster and may or may not be backed by sound meteorological data. They are NOT endorsed by any professional institution or STORM2K. For official information, please refer to products from the National Hurricane Center and National Weather Service.
-
NotSparta

- Professional-Met

- Posts: 1677
- Age: 24
- Joined: Fri Aug 18, 2017 8:24 am
- Location: Naples, FL
- Contact:
Re: 2020 Indicators: SST's / SAL / MSLP / Steering / Shear / Instability / Sat Images
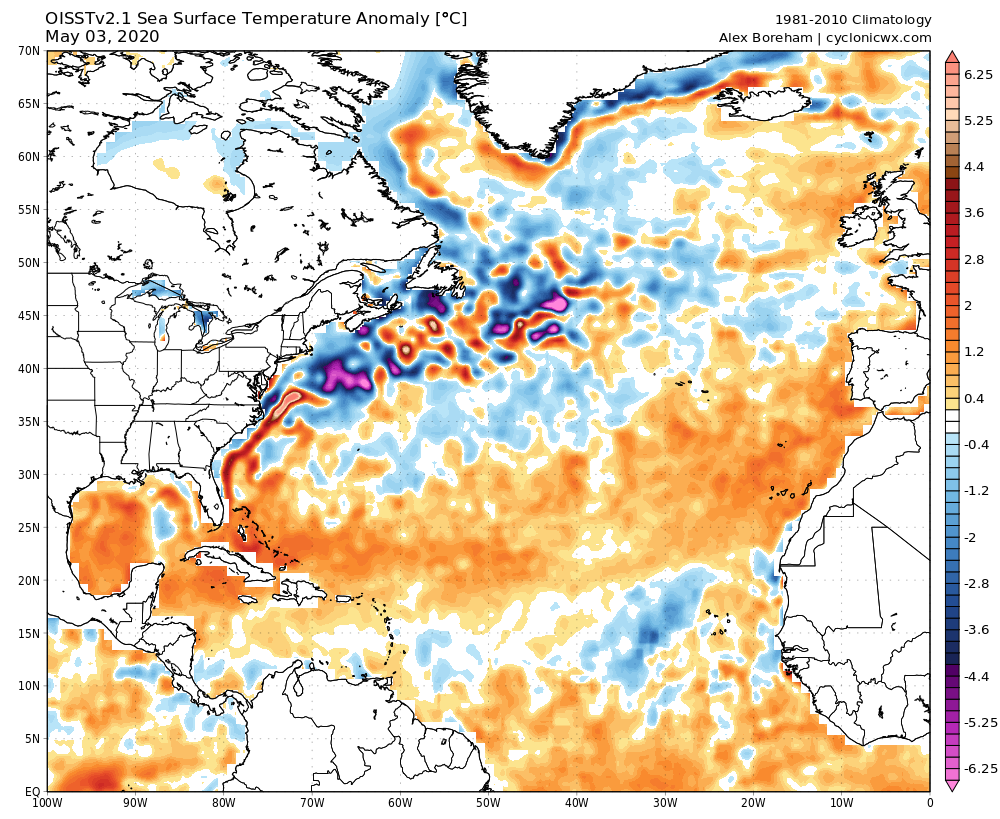
OISST also has less cool MDR compared to CDAS
1 likes
This post was probably an opinion of mine, and in no way is official. Please refer to http://www.hurricanes.gov for official tropical analysis and advisories.
My website, with lots of tropical wx graphics, including satellite and recon: http://cyclonicwx.com
My website, with lots of tropical wx graphics, including satellite and recon: http://cyclonicwx.com
-
USTropics
- Professional-Met
- Posts: 2738
- Joined: Sun Aug 12, 2007 3:45 am
- Location: Florida State University
Re: 2020 Indicators: SST's / SAL / MSLP / Steering / Shear / Instability / Sat Images
To give you an idea of how complex these data sets are, here is how the OISST calculates SSTs:
OVERVIEW
"NOAA’s Optimum Interpolation Sea Surface temperature (OISST, also known as Reynolds’ SST) is a series of global analysis products, including the weekly OISST on a 1° grid to the more recent daily on a ¼° grid. An SST analysis is a spatially gridded product created by interpolating and extrapolating data, resulting in a smoothed complete field. OISST provides global fields that are based on a combination of ocean temperature observations from satellite and in situ platforms (i.e., ships and buoys). The input data are irregularly distributed in space and must be first placed on a regular grid. Then, statistical methods (optimum interpolation, OI) are applied to fill in where there are missing values. The methodology includes a bias adjustment step of the satellite data to in situ data prior to interpolation. SST analyses are used in a range of applications including weather forecasting, climate studies, modeling, fisheries ecology, oceanography, and as a reference field for other satellite algorithms." (quoted from the Guidance discussion).
INPUT PARAMETERS
ships, bouys, large-scale adjustment of satellite biases, AVHRR, AMSRE
KEY LIMITATIONS:
- Satellite bias corrections require adequate in-situ observations which are very sparse in some regions, especially the high latitudes
- AVHRR-only version may not represent actual conditions in persistently cloudy regions, while AMSR-E observations can be affected by rain contamination
- Diurnal variability is not captured
CDAS behaves the same way (although it really is just an NCEP/NCAR reanalysis).
I believe the NOAA still uses the Geo-Polar Blended Global Sea Surface Temperature Analysis (which only accounts for night-time SSTs). This is being move from a 50km to a 5km spatial resolution this year as well.
At the bottom of this page you can find overviews, strengths, and weaknesses for the various data sets:
https://climatedataguide.ucar.edu/climate-data/sst-data-sets-overview-comparison-table
NOAA data set:
https://coastwatch.noaa.gov/cw/satellite-data-products/sea-surface-temperature/sea-surface-temperature-near-real-time-geopolar-blended.html
2 likes
-
SFLcane

- S2K Supporter

- Posts: 10281
- Age: 48
- Joined: Sat Jun 05, 2010 1:44 pm
- Location: Lake Worth Florida
Re: 2020 Indicators: SST's / SAL / MSLP / Steering / Shear / Instability / Sat Images
USTropics wrote:To give you an idea of how complex these data sets are, here is how the OISST calculates SSTs:
OVERVIEW
"NOAA’s Optimum Interpolation Sea Surface temperature (OISST, also known as Reynolds’ SST) is a series of global analysis products, including the weekly OISST on a 1° grid to the more recent daily on a ¼° grid. An SST analysis is a spatially gridded product created by interpolating and extrapolating data, resulting in a smoothed complete field. OISST provides global fields that are based on a combination of ocean temperature observations from satellite and in situ platforms (i.e., ships and buoys). The input data are irregularly distributed in space and must be first placed on a regular grid. Then, statistical methods (optimum interpolation, OI) are applied to fill in where there are missing values. The methodology includes a bias adjustment step of the satellite data to in situ data prior to interpolation. SST analyses are used in a range of applications including weather forecasting, climate studies, modeling, fisheries ecology, oceanography, and as a reference field for other satellite algorithms." (quoted from the Guidance discussion).
INPUT PARAMETERS
ships, bouys, large-scale adjustment of satellite biases, AVHRR, AMSRE
KEY LIMITATIONS:
- Satellite bias corrections require adequate in-situ observations which are very sparse in some regions, especially the high latitudes
- AVHRR-only version may not represent actual conditions in persistently cloudy regions, while AMSR-E observations can be affected by rain contamination
- Diurnal variability is not captured
CDAS behaves the same way (although it really is just an NCEP/NCAR reanalysis).
I believe the NOAA still uses the Geo-Polar Blended Global Sea Surface Temperature Analysis (which only accounts for night-time SSTs). This is being move from a 50km to a 5km spatial resolution this year as well.
At the bottom of this page you can find overviews, strengths, and weaknesses for the various data sets:
https://climatedataguide.ucar.edu/climate-data/sst-data-sets-overview-comparison-table
NOAA data set:
https://coastwatch.noaa.gov/cw/satellite-data-products/sea-surface-temperature/sea-surface-temperature-near-real-time-geopolar-blended.html
Thanks for this.. I guess the question everyone has is which map holds the most weight.
1 likes
-
cycloneye

- Admin

- Posts: 149422
- Age: 69
- Joined: Thu Oct 10, 2002 10:54 am
- Location: San Juan, Puerto Rico
Re: 2020 Indicators: SST's / SAL / MSLP / Steering / Shear / Instability / Sat Images
SFLcane wrote:USTropics wrote:To give you an idea of how complex these data sets are, here is how the OISST calculates SSTs:
OVERVIEW
"NOAA’s Optimum Interpolation Sea Surface temperature (OISST, also known as Reynolds’ SST) is a series of global analysis products, including the weekly OISST on a 1° grid to the more recent daily on a ¼° grid. An SST analysis is a spatially gridded product created by interpolating and extrapolating data, resulting in a smoothed complete field. OISST provides global fields that are based on a combination of ocean temperature observations from satellite and in situ platforms (i.e., ships and buoys). The input data are irregularly distributed in space and must be first placed on a regular grid. Then, statistical methods (optimum interpolation, OI) are applied to fill in where there are missing values. The methodology includes a bias adjustment step of the satellite data to in situ data prior to interpolation. SST analyses are used in a range of applications including weather forecasting, climate studies, modeling, fisheries ecology, oceanography, and as a reference field for other satellite algorithms." (quoted from the Guidance discussion).
INPUT PARAMETERS
ships, bouys, large-scale adjustment of satellite biases, AVHRR, AMSRE
KEY LIMITATIONS:
- Satellite bias corrections require adequate in-situ observations which are very sparse in some regions, especially the high latitudes
- AVHRR-only version may not represent actual conditions in persistently cloudy regions, while AMSR-E observations can be affected by rain contamination
- Diurnal variability is not captured
CDAS behaves the same way (although it really is just an NCEP/NCAR reanalysis).
I believe the NOAA still uses the Geo-Polar Blended Global Sea Surface Temperature Analysis (which only accounts for night-time SSTs). This is being move from a 50km to a 5km spatial resolution this year as well.
At the bottom of this page you can find overviews, strengths, and weaknesses for the various data sets:
https://climatedataguide.ucar.edu/climate-data/sst-data-sets-overview-comparison-table
NOAA data set:
https://coastwatch.noaa.gov/cw/satellite-data-products/sea-surface-temperature/sea-surface-temperature-near-real-time-geopolar-blended.html
Thanks for this.. I guess the question everyone has is which map holds the most weight.
Bingo.
0 likes
Visit the Caribbean-Central America Weather Thread where you can find at first post web cams,radars
and observations from Caribbean basin members Click Here
and observations from Caribbean basin members Click Here
-
WeatherEmperor
- S2K Supporter
- Posts: 4806
- Age: 42
- Joined: Thu Sep 04, 2003 2:54 pm
- Location: South Florida
Re: 2020 Indicators: SST's / SAL / MSLP / Steering / Shear / Instability / Sat Images
SFLcane wrote:USTropics wrote:To give you an idea of how complex these data sets are, here is how the OISST calculates SSTs:
OVERVIEW
"NOAA’s Optimum Interpolation Sea Surface temperature (OISST, also known as Reynolds’ SST) is a series of global analysis products, including the weekly OISST on a 1° grid to the more recent daily on a ¼° grid. An SST analysis is a spatially gridded product created by interpolating and extrapolating data, resulting in a smoothed complete field. OISST provides global fields that are based on a combination of ocean temperature observations from satellite and in situ platforms (i.e., ships and buoys). The input data are irregularly distributed in space and must be first placed on a regular grid. Then, statistical methods (optimum interpolation, OI) are applied to fill in where there are missing values. The methodology includes a bias adjustment step of the satellite data to in situ data prior to interpolation. SST analyses are used in a range of applications including weather forecasting, climate studies, modeling, fisheries ecology, oceanography, and as a reference field for other satellite algorithms." (quoted from the Guidance discussion).
INPUT PARAMETERS
ships, bouys, large-scale adjustment of satellite biases, AVHRR, AMSRE
KEY LIMITATIONS:
- Satellite bias corrections require adequate in-situ observations which are very sparse in some regions, especially the high latitudes
- AVHRR-only version may not represent actual conditions in persistently cloudy regions, while AMSR-E observations can be affected by rain contamination
- Diurnal variability is not captured
CDAS behaves the same way (although it really is just an NCEP/NCAR reanalysis).
I believe the NOAA still uses the Geo-Polar Blended Global Sea Surface Temperature Analysis (which only accounts for night-time SSTs). This is being move from a 50km to a 5km spatial resolution this year as well.
At the bottom of this page you can find overviews, strengths, and weaknesses for the various data sets:
https://climatedataguide.ucar.edu/climate-data/sst-data-sets-overview-comparison-table
NOAA data set:
https://coastwatch.noaa.gov/cw/satellite-data-products/sea-surface-temperature/sea-surface-temperature-near-real-time-geopolar-blended.html
Thanks for this.. I guess the question everyone has is which map holds the most weight.
This is my question as well. Which one holds more weight? Luis, can you shed some light on this?
Sent from my iPhone using Tapatalk
1 likes
-
cycloneye
- Admin
- Posts: 149422
- Age: 69
- Joined: Thu Oct 10, 2002 10:54 am
- Location: San Juan, Puerto Rico
Re: 2020 Indicators: SST's / SAL / MSLP / Steering / Shear / Instability / Sat Images
WeatherEmperor wrote:SFLcane wrote:USTropics wrote:To give you an idea of how complex these data sets are, here is how the OISST calculates SSTs:
OVERVIEW
"NOAA’s Optimum Interpolation Sea Surface temperature (OISST, also known as Reynolds’ SST) is a series of global analysis products, including the weekly OISST on a 1° grid to the more recent daily on a ¼° grid. An SST analysis is a spatially gridded product created by interpolating and extrapolating data, resulting in a smoothed complete field. OISST provides global fields that are based on a combination of ocean temperature observations from satellite and in situ platforms (i.e., ships and buoys). The input data are irregularly distributed in space and must be first placed on a regular grid. Then, statistical methods (optimum interpolation, OI) are applied to fill in where there are missing values. The methodology includes a bias adjustment step of the satellite data to in situ data prior to interpolation. SST analyses are used in a range of applications including weather forecasting, climate studies, modeling, fisheries ecology, oceanography, and as a reference field for other satellite algorithms." (quoted from the Guidance discussion).
INPUT PARAMETERS
ships, bouys, large-scale adjustment of satellite biases, AVHRR, AMSRE
KEY LIMITATIONS:
- Satellite bias corrections require adequate in-situ observations which are very sparse in some regions, especially the high latitudes
- AVHRR-only version may not represent actual conditions in persistently cloudy regions, while AMSR-E observations can be affected by rain contamination
- Diurnal variability is not captured
CDAS behaves the same way (although it really is just an NCEP/NCAR reanalysis).
I believe the NOAA still uses the Geo-Polar Blended Global Sea Surface Temperature Analysis (which only accounts for night-time SSTs). This is being move from a 50km to a 5km spatial resolution this year as well.
At the bottom of this page you can find overviews, strengths, and weaknesses for the various data sets:
https://climatedataguide.ucar.edu/climate-data/sst-data-sets-overview-comparison-table
NOAA data set:
https://coastwatch.noaa.gov/cw/satellite-data-products/sea-surface-temperature/sea-surface-temperature-near-real-time-geopolar-blended.html
Thanks for this.. I guess the question everyone has is which map holds the most weight.
This is my question as well. Which one holds more weight? Luis, can you shed some light on this?
Sent from my iPhone using Tapatalk
I am asking the same question.
0 likes
Visit the Caribbean-Central America Weather Thread where you can find at first post web cams,radars
and observations from Caribbean basin members Click Here
and observations from Caribbean basin members Click Here
-
Shell Mound
- Category 5

- Posts: 2432
- Age: 33
- Joined: Thu Sep 07, 2017 3:39 pm
- Location: St. Petersburg, FL → Scandinavia
Re: 2020 Indicators: SST's / SAL / MSLP / Steering / Shear / Instability / Sat Images
Most of the cooling in SSTs over the MDR and Caribbean has occurred since 20 April, per Tropical Tidbits’ data. I used ESRL’s plotting and analysis page to compare the change in MSLP, SST, and precipitation-rate (mm/h) anomalies during the period 20 April–1 May vs. the first nineteen days of April. I examined the region between 45°S–45°N and 120°W–40°E. Based on ESRL’s output, I found no significant change in any of these variables over the MDR and Caribbean, so USTropics’ explanation as to the cooling does not seem to hold, at least based on ESRL’s data. Therefore, the significant cooling is likely related to the AMO rather than convection, stronger high pressure, or other factors.
0 likes
CVW / MiamiensisWx / Shell Mound
The posts in this forum are NOT official forecasts and should not be used as such. They are just the opinion of the poster and may or may not be backed by sound meteorological data. They are NOT endorsed by any professional institution or STORM2K. For official information, please refer to products from the NHC and NWS.
-
CyclonicFury

- Category 5
- Posts: 2033
- Age: 27
- Joined: Sun Jul 02, 2017 12:32 pm
- Location: NC
- Contact:
Re: 2020 Indicators: SST's / SAL / MSLP / Steering / Shear / Instability / Sat Images
Shell Mound wrote:Most of the cooling in SSTs over the MDR and Caribbean has occurred since 20 April, per Tropical Tidbits’ data. I used ESRL’s plotting and analysis page to compare the change in MSLP, SST, and precipitation-rate (mm/h) anomalies during the period 20 April–1 May vs. the first nineteen days of April. I examined the region between 45°S–45°N and 120°W–40°E. Based on ESRL’s output, I found no significant change in any of these variables over the MDR and Caribbean, so USTropics’ explanation as to the cooling does not seem to hold, at least based on ESRL’s data. Therefore, the significant cooling is likely related to the AMO rather than convection, stronger high pressure, or other factors.
The AMO is a multi-decadal oscillation. It is difficult to just say because the MDR has cooled recently we are in a -AMO. Enhanced trades over the northern half of the MDR are probably the primary reason.

9 likes
NCSU B.S. in Meteorology Class of 2021. Tropical weather blogger at http://www.cyclonicfury.com. My forecasts and thoughts are NOT official, for official forecasts please consult the National Hurricane Center.
-
NotSparta
- Professional-Met
- Posts: 1677
- Age: 24
- Joined: Fri Aug 18, 2017 8:24 am
- Location: Naples, FL
- Contact:
Re: 2020 Indicators: SST's / SAL / MSLP / Steering / Shear / Instability / Sat Images
Shell Mound wrote:Most of the cooling in SSTs over the MDR and Caribbean has occurred since 20 April, per Tropical Tidbits’ data. I used ESRL’s plotting and analysis page to compare the change in MSLP, SST, and precipitation-rate (mm/h) anomalies during the period 20 April–1 May vs. the first nineteen days of April. I examined the region between 45°S–45°N and 120°W–40°E. Based on ESRL’s output, I found no significant change in any of these variables over the MDR and Caribbean, so USTropics’ explanation as to the cooling does not seem to hold, at least based on ESRL’s data. Therefore, the significant cooling is likely related to the AMO rather than convection, stronger high pressure, or other factors.
That's not how it works, the AMO can't just magically cool down the MDR. It needs help from other sources like trade wind variability or insolation fluxes. Problem is, the data isn't perfect. The SST data will have problems, missing areas and biases. In addition, the ESRL data isn't perfect as well, so it could be missing some things too. More likely there was a trade wind outbreak or a fall in insolation (SAL would do it and also make SST datasets overdo the fall). AMO variations are much more gradual than this, there have been tons of short term crashes like this even in the peak of the +AMO period.
7 likes
This post was probably an opinion of mine, and in no way is official. Please refer to http://www.hurricanes.gov for official tropical analysis and advisories.
My website, with lots of tropical wx graphics, including satellite and recon: http://cyclonicwx.com
My website, with lots of tropical wx graphics, including satellite and recon: http://cyclonicwx.com
-
USTropics
- Professional-Met
- Posts: 2738
- Joined: Sun Aug 12, 2007 3:45 am
- Location: Florida State University
Re: 2020 Indicators: SST's / SAL / MSLP / Steering / Shear / Instability / Sat Images
Shell Mound wrote:Most of the cooling in SSTs over the MDR and Caribbean has occurred since 20 April, per Tropical Tidbits’ data. I used ESRL’s plotting and analysis page to compare the change in MSLP, SST, and precipitation-rate (mm/h) anomalies during the period 20 April–1 May vs. the first nineteen days of April. I examined the region between 45°S–45°N and 120°W–40°E. Based on ESRL’s output, I found no significant change in any of these variables over the MDR and Caribbean, so USTropics’ explanation as to the cooling does not seem to hold, at least based on ESRL’s data. Therefore, the significant cooling is likely related to the AMO rather than convection, stronger high pressure, or other factors.
I should clarify I was only looking at the region from 30W - coast of western Africa specifically, and I still stand by seasonal processes are the reason for the cooling (viewtopic.php?p=2799864#p2799864). I think these processes have been occurring on the scale of 1-2 months, not 2-3 weeks. For March-April, there has been anomalously stronger southeasterly winds at the surface that is creating more upwelling than normal, and this can been seen in the composite below:

You can see this has also caused an increase in convection for March-April:

I think the debate is the amount of cooling in this region, based on the three available datasets (NOAA, CDAS, or OISST) and which is a more accurate representation. So it's possible (and I'm not saying this is the case) but the two products that use more satellite data integration (CDAS and OISST) and adjustments to satellite biases may be slightly cooler, while the NOAA data set (which uses less satellite derived data and gives credence more to ship/buoy data) is more accurate. It's entirely possible the satellite derived data sets are more accurate, and the NOAA discrepency is just a lack of data. Either way, I don't think anyone can definitively state which is more accurate.
Overall I don't think the intermittent difference between +/- 1 degree cooling means much between data sets (this should rebound in June/July). The bigger takeaway should be this:
https://twitter.com/philklotzbach/status/1257340716637925382
7 likes
-
SFLcane
- S2K Supporter
- Posts: 10281
- Age: 48
- Joined: Sat Jun 05, 2010 1:44 pm
- Location: Lake Worth Florida
Re: 2020 Indicators: SST's / SAL / MSLP / Steering / Shear / Instability / Sat Images
So much for the cooling! 
1 likes
-
TheStormExpert
Re: 2020 Indicators: SST's / SAL / MSLP / Steering / Shear / Instability / Sat Images
SFLcane wrote:So much for the cooling!
Something must be wrong with Tropical Tidbits if Philip Klotzbach is still very bullish on SST’s in that region.
0 likes
-
HurricaneEnzo

- Category 2

- Posts: 743
- Joined: Wed Mar 14, 2018 12:18 pm
- Location: Newport, NC (Hurricane Alley)
Re: 2020 Indicators: SST's / SAL / MSLP / Steering / Shear / Instability / Sat Images
The temps in the MDR can go up and down quickly in response to whatever conditions are there at the time. As was mentioned a trade burst probably caused the recent cooling it is likely to warm back up again just as quick. Just because it has the appearance of -AMO for a week doesn't mean we are heading for a -AMO. Need to see something far more sustained to make that call.
5 likes
Bertha 96' - Fran 96' - Bonnie 98' - Dennis 99' - Floyd 99' - Isabel 03' - Alex 04' - Ophelia 05' - Irene 11' - Arthur 14' - Matthew 16' - Florence 18' - Dorian 19' - Isaias 20' (countless other tropical storms and Hurricane swipes)
I am not a Professional Met just an enthusiast. Get your weather forecasts from the Pros!
I am not a Professional Met just an enthusiast. Get your weather forecasts from the Pros!
-
toad strangler

- S2K Supporter
- Posts: 4546
- Joined: Sun Jul 28, 2013 3:09 pm
- Location: Earth
- Contact:
Re: 2020 Indicators: SST's / SAL / MSLP / Steering / Shear / Instability / Sat Images
From Mark Sudduth discussion today on future ENSO conditions ..... there is unanimous modeling agreement of at least ENSO Neutral Cool conditions come peak season in September. What stands out the most is that the MEAN is nearly a La Nina in September. You want to watch this video at least from 3:10 to 5:04 which discusses this with graphics
http://twitter.com/hurricanetrack/status/1257432998192046083
http://twitter.com/hurricanetrack/status/1257432998192046083
3 likes
My Weather Station
https://www.wunderground.com/dashboard/pws/KFLPORTS603
https://www.wunderground.com/dashboard/pws/KFLPORTS603
-
cycloneye
- Admin
- Posts: 149422
- Age: 69
- Joined: Thu Oct 10, 2002 10:54 am
- Location: San Juan, Puerto Rico
Re: 2020 Indicators: SST's / SAL / MSLP / Steering / Shear / Instability / Sat Images
0 likes
Visit the Caribbean-Central America Weather Thread where you can find at first post web cams,radars
and observations from Caribbean basin members Click Here
and observations from Caribbean basin members Click Here
-
toad strangler
- S2K Supporter
- Posts: 4546
- Joined: Sun Jul 28, 2013 3:09 pm
- Location: Earth
- Contact:
Re: 2020 Indicators: SST's / SAL / MSLP / Steering / Shear / Instability / Sat Images
Interesting read IRT insurance angle during COVID-19 and the prospects for an above normal Atlantic Basin. This piece points to the Central Gulf Coast and the Outer Banks as analog landfall hotspots.
http://twitter.com/AndrewSiffert/status/1257634674983215106
http://twitter.com/AndrewSiffert/status/1257634674983215106
0 likes
My Weather Station
https://www.wunderground.com/dashboard/pws/KFLPORTS603
https://www.wunderground.com/dashboard/pws/KFLPORTS603
-
cycloneye
- Admin
- Posts: 149422
- Age: 69
- Joined: Thu Oct 10, 2002 10:54 am
- Location: San Juan, Puerto Rico
Re: 2020 Indicators: SST's / SAL / MSLP / Steering / Shear / Instability / Sat Images
0 likes
Visit the Caribbean-Central America Weather Thread where you can find at first post web cams,radars
and observations from Caribbean basin members Click Here
and observations from Caribbean basin members Click Here
-
cycloneye
- Admin
- Posts: 149422
- Age: 69
- Joined: Thu Oct 10, 2002 10:54 am
- Location: San Juan, Puerto Rico
Re: 2020 Indicators: SST's / SAL / MSLP / Steering / Shear / Instability / Sat Images
https://twitter.com/TropicalTidbits/status/1257720814989914113
https://twitter.com/TropicalTidbits/status/1257720816256647172
https://twitter.com/TropicalTidbits/status/1257720816256647172
0 likes
Visit the Caribbean-Central America Weather Thread where you can find at first post web cams,radars
and observations from Caribbean basin members Click Here
and observations from Caribbean basin members Click Here
-
tolakram
- Admin
- Posts: 20185
- Age: 62
- Joined: Sun Aug 27, 2006 8:23 pm
- Location: Florence, KY (name is Mark)
Re: 2020 Indicators: SST's / SAL / MSLP / Steering / Shear / Instability / Sat Images
The hype for this season seems a little over the top. Even if it's busy, and last I checked season predictions are not all that good, we don't know how many, if any, will impact land. Hope for the best, prepare for the worst!
3 likes
M a r k
- - - - -
Join us in chat: Storm2K Chatroom Invite. Android and IOS apps also available.
The posts in this forum are NOT official forecasts and should not be used as such. Posts are NOT endorsed by any professional institution or STORM2K.org. For official information and forecasts, please refer to NHC and NWS products.
-
TheStormExpert
Re: 2020 Indicators: SST's / SAL / MSLP / Steering / Shear / Instability / Sat Images
tolakram wrote:The hype for this season seems a little over the top. Even if it's busy, and last I checked season predictions are not all that good, we don't know how many, if any, will impact land. Hope for the best, prepare for the worst!
How is it over the top when there’s a historic worldwide pandemic ongoing? I mean yes it may or may not be as active as predicted but preparing for the worst and hoping for the best is very critical this year especially if a major hurricane comes knocking on your doorstep considering that evacuating to area shelters would only worsen the ongoing pandemic.
4 likes
Who is online
Users browsing this forum: Landy and 38 guests