2020 Indicators: SST's / SAL / MSLP / Steering / Shear / Instability / Sat Images
Moderator: S2k Moderators
Forum rules

The posts in this forum are NOT official forecasts and should not be used as such. They are just the opinion of the poster and may or may not be backed by sound meteorological data. They are NOT endorsed by any professional institution or STORM2K. For official information, please refer to products from the National Hurricane Center and National Weather Service.

Re: 2020 Indicators: SST's / SAL / MSLP / Steering / Shear / Instability / Sat Images
When does SAL usually start to calm down? And when does shear in the Caribbean start to relax?
0 likes
-
cainjamin

- Tropical Storm

- Posts: 173
- Age: 34
- Joined: Mon Apr 17, 2017 1:38 pm
- Location: Nova Scotia, Canada
Re: 2020 Indicators: SST's / SAL / MSLP / Steering / Shear / Instability / Sat Images
Cpv17 wrote:When does SAL usually start to calm down? And when does shear in the Caribbean start to relax?
SAL usually starts to abate by early August and reaches a minimum in the Fall. Shear in the Caribbean is usually around the minimum in August and September.
6 likes
Noel '07, Kyle '08, Earl '10, Arthur '14, Dorian '19, Teddy '20, Lee '23
-
MarioProtVI
- Category 5

- Posts: 1034
- Age: 24
- Joined: Sun Sep 29, 2019 7:33 pm
- Location: New Jersey
Re: 2020 Indicators: SST's / SAL / MSLP / Steering / Shear / Instability / Sat Images
I think we can all agree CFS is a garbage model to hold onto for season predictions especially considering the Atlantic cranked out two systems in a SUPPRESSED phase of the MJO, one of which was almost a Cat 2 and the other a fairly strong MDR TS in July which you don’t see very often and usually indicates a good possibility of a hyperactive season. Let’s revisit this CFS thing on November 30 and see where we stand since 2020 clearly does not want to abide by the rules of climatology 
8 likes
-
hurricaneCW
- Category 5
- Posts: 1799
- Joined: Wed Mar 03, 2010 6:20 am
- Location: Toms River, NJ
Re: 2020 Indicators: SST's / SAL / MSLP / Steering / Shear / Instability / Sat Images
CFS is garbage, expect a hyperactive season minus a possible lull sometime in August.
1 likes

Re: 2020 Indicators: SST's / SAL / MSLP / Steering / Shear / Instability / Sat Images
MarioProtVI wrote:I think we can all agree CFS is a garbage model to hold onto for season predictions especially considering the Atlantic cranked out two systems in a SUPPRESSED phase of the MJO, one of which was almost a Cat 2 and the other a fairly strong MDR TS in July which you don’t see very often and usually indicates a good possibility of a hyperactive season. Let’s revisit this CFS thing on November 30 and see where we stand since 2020 clearly does not want to abide by the rules of climatology
It's been accurate with trends but I'll agree that 2020 certainly isn't following the rules at all.
BYG Jacob wrote:Hugging the CFS is a weird hill to die on.
Once again, I post it here every few days during July/August as part of the discussion on the indicators. It's the same model that's used to predict precipitation and such on monthly basis.
3 likes
The above post is not official and should not be used as such. It is the opinion of the poster and may or may not be backed by sound meteorological data. It is not endorsed by any professional institution or storm2k.org. For official information, please refer to the NHC and NWS products.
-
TheStormExpert
Re: 2020 Indicators: SST's / SAL / MSLP / Steering / Shear / Instability / Sat Images
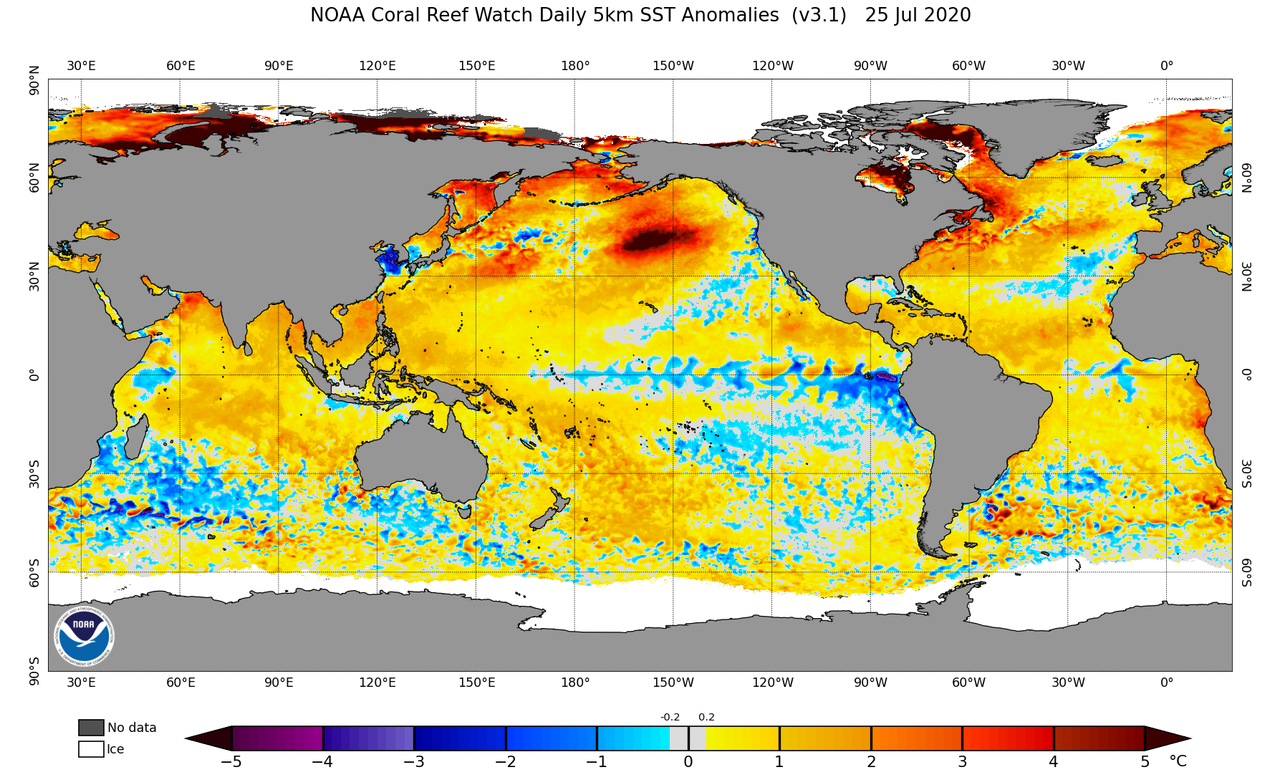
gatorcane wrote:Anybody have any thoughts how/if the much warmer than normal pocket of water in the northern Pacific might impact potentially any steering in the Atlantic? One thought I have is maybe it causes a more progressive pattern as lows that track over the area might get stronger than normal which might cause perturbations in the jet stream across North America and Atlantic especially in the fall as mid-latitude lows traverse the Pacific. This progressive pattern might in turn impact the strength and and location of the Bermuda high causing it to be a bit weaker and more transient than normal?
https://i.postimg.cc/9FC3BQYd/ssta-daily-current.png
I’ve noticed the pattern has become more progressive in recent weeks. Likely has to do with that warm blob.
0 likes
-
USTropics
- Professional-Met

- Posts: 2738
- Joined: Sun Aug 12, 2007 3:45 am
- Location: Florida State University
Re: 2020 Indicators: SST's / SAL / MSLP / Steering / Shear / Instability / Sat Images
TheStormExpert wrote:gatorcane wrote:Anybody have any thoughts how/if the much warmer than normal pocket of water in the northern Pacific might impact potentially any steering in the Atlantic? One thought I have is maybe it causes a more progressive pattern as lows that track over the area might get stronger than normal which might cause perturbations in the jet stream across North America and Atlantic especially in the fall as mid-latitude lows traverse the Pacific. This progressive pattern might in turn impact the strength and and location of the Bermuda high causing it to be a bit weaker and more transient than normal?
https://i.postimg.cc/9FC3BQYd/ssta-daily-current.png
I’ve noticed the pattern has become more progressive in recent weeks. Likely has to do with that warm blob.
There's still quite a bit of research into the warm "Blob" (or marine heatwave) that's situated off the coast of Alaska/Canada. It's more of a reflection of localized weather patterns, meaning the marine heatwave is a result of other atmospheric processes (i.e. a persistent ridge of high pressure relaxes winds and ocean surface mixing in that localized area, affecting the upper layers of the ocean). Looking further, a persistent band of high pressure extending to the Bering Sea/Alaska (as observed in 2014/2015) is a leading cause for the ridging and this persistent marine heatwave. Prolonged blocking events (which actually occur more frequently when the atmosphere is favoring La Nina in the North Pacific) and pattern shifts in the MJO are contributing factors as well.
TL;DR the prolonged marine heatwave likely has no effect (or research support) on steering patterns over North America/Atlantic basin, but is more of a reflection of larger atmospheric processes at play. Effects are contained locally (mainly marine life).
If you want to read more, check out this article - https://www.climate.gov/news-features/blogs/enso/seeing-red-across-north-pacific-ocean
8 likes
-
BYG Jacob
Re: 2020 Indicators: SST's / SAL / MSLP / Steering / Shear / Instability / Sat Images
Hammy wrote:MarioProtVI wrote:I think we can all agree CFS is a garbage model to hold onto for season predictions especially considering the Atlantic cranked out two systems in a SUPPRESSED phase of the MJO, one of which was almost a Cat 2 and the other a fairly strong MDR TS in July which you don’t see very often and usually indicates a good possibility of a hyperactive season. Let’s revisit this CFS thing on November 30 and see where we stand since 2020 clearly does not want to abide by the rules of climatology
It's been accurate with trends but I'll agree that 2020 certainly isn't following the rules at all.BYG Jacob wrote:Hugging the CFS is a weird hill to die on.
Once again, I post it here every few days during July/August as part of the discussion on the indicators. It's the same model that's used to predict precipitation and such on monthly basis.
Predicting hurricane intensity and track is basically impossible 3 days out right now and you expect me to care about a models forecast for ASO?
0 likes
-
tolakram
- Admin

- Posts: 20185
- Age: 62
- Joined: Sun Aug 27, 2006 8:23 pm
- Location: Florence, KY (name is Mark)
Re: 2020 Indicators: SST's / SAL / MSLP / Steering / Shear / Instability / Sat Images
To all who are criticizing the CFS post.
This IS the place to discuss what the longer range models are showing. You don't have to like it, but the proper response would be to discuss how the CFS has done in the past and not criticize a poster for discussing it. Telling us not to believe the long range models in a thread about discussing long range trends and models is a bit awkward, to say the least.
This IS the place to discuss what the longer range models are showing. You don't have to like it, but the proper response would be to discuss how the CFS has done in the past and not criticize a poster for discussing it. Telling us not to believe the long range models in a thread about discussing long range trends and models is a bit awkward, to say the least.
13 likes
M a r k
- - - - -
Join us in chat: Storm2K Chatroom Invite. Android and IOS apps also available.
The posts in this forum are NOT official forecasts and should not be used as such. Posts are NOT endorsed by any professional institution or STORM2K.org. For official information and forecasts, please refer to NHC and NWS products.

Re: 2020 Indicators: SST's / SAL / MSLP / Steering / Shear / Instability / Sat Images
tolakram wrote:To all who are criticizing the CFS post.
This IS the place to discuss what the longer range models are showing. You don't have to like it, but the proper response would be to discuss how the CFS has done in the past and not criticize a poster for discussing it. Telling us not to believe the long range models in a thread about discussing long range trends and models is a bit awkward, to say the least.
I agree, if we are going to disagree with a forecast and or model lets show our evidence.
2 likes
-
SconnieCane
- Category 5
- Posts: 1013
- Joined: Thu Aug 02, 2018 5:29 pm
- Location: Madison, WI
Re: 2020 Indicators: SST's / SAL / MSLP / Steering / Shear / Instability / Sat Images
Amazing the things you learn on this forum. Before I started frequenting this forum I didn't even realize SAL was a thing. I basically took water temps and (lack of) shear as the main ingredients for TC development/intensification, moisture content of air didn't really come into it except for landfalling Gulf Coast hurricanes pulling in dry continental air and desiccating themselves (Ivan, Dennis, Katrina, Rita NOT Harvey and Michael). I guess I just assumed that air over the middle of the ocean had to be moist, I certainly didn't realize air and dust from Africa could blow all the way across the Atlantic.
4 likes
-
supercane4867
- Category 5
- Posts: 4966
- Joined: Wed Nov 14, 2012 10:43 am
Re: 2020 Indicators: SST's / SAL / MSLP / Steering / Shear / Instability / Sat Images
Looks like CFS is forecasting 3-4 storms developing in August with mostly recurve tracks. The path in week 1 should be 92L.

Storm Count Forecast
RAW NUMBERS
PERIOD START END ATL ENP WNP NI SI AUS SP
-----------------------------------------------------------
Week 1 20200726 20200801 1.1 0.2 0.1 0.3 0.0 0.0 0.2
Week 2 20200802 20200808 0.3 0.9 0.9 0.3 0.2 0.0 0.1
Week 3 20200809 20200815 0.7 2.4 1.6 0.7 0.5 0.0 0.1
Week 4 20200816 20200822 1.8 3.1 2.5 0.8 0.4 0.0 0.1
Week 5 20200823 20200829 1.3 1.7 1.4 0.7 0.2 0.0 0.0
Week 6 20200830 20200905 0.0 0.0 0.0 0.0 0.0 0.0 0.0
30 Day 20200726 20200824 3.4 4.3 3.5 1.4 0.5 0.0 0.3
BIAS CORRECTED
PERIOD START END ATL ENP WNP NI SI AUS SP
-----------------------------------------------------------
Week 1 20200726 20200801 0.7 0.0 0.0 0.0 0.0 0.0 0.0
Week 2 20200802 20200808 0.0 0.3 0.7 0.0 0.0 0.0 0.0
Week 3 20200809 20200815 0.1 2.0 0.8 0.0 0.2 0.0 0.0
Week 4 20200816 20200822 1.2 2.3 2.0 0.0 0.0 0.0 0.0
Week 5 20200823 20200829 0.9 1.5 1.0 0.0 0.0 0.0 0.0
Week 6 20200830 20200905 0.5 0.0 0.0 0.0 0.0 0.0 0.0
30 Day 20200726 20200824 3.0 3.6 2.8 0.0 0.0 0.0 0.0
0 likes

Re: 2020 Indicators: SST's / SAL / MSLP / Steering / Shear / Instability / Sat Images
supercane4867 wrote:Looks like CFS is forecasting 3-4 storms developing in August with mostly recurve tracks. The path in week 1 should be 92L.Storm Count Forecast
RAW NUMBERS
PERIOD START END ATL ENP WNP NI SI AUS SP
-----------------------------------------------------------
Week 1 20200726 20200801 1.1 0.2 0.1 0.3 0.0 0.0 0.2
Week 2 20200802 20200808 0.3 0.9 0.9 0.3 0.2 0.0 0.1
Week 3 20200809 20200815 0.7 2.4 1.6 0.7 0.5 0.0 0.1
Week 4 20200816 20200822 1.8 3.1 2.5 0.8 0.4 0.0 0.1
Week 5 20200823 20200829 1.3 1.7 1.4 0.7 0.2 0.0 0.0
Week 6 20200830 20200905 0.0 0.0 0.0 0.0 0.0 0.0 0.0
30 Day 20200726 20200824 3.4 4.3 3.5 1.4 0.5 0.0 0.3
BIAS CORRECTED
PERIOD START END ATL ENP WNP NI SI AUS SP
-----------------------------------------------------------
Week 1 20200726 20200801 0.7 0.0 0.0 0.0 0.0 0.0 0.0
Week 2 20200802 20200808 0.0 0.3 0.7 0.0 0.0 0.0 0.0
Week 3 20200809 20200815 0.1 2.0 0.8 0.0 0.2 0.0 0.0
Week 4 20200816 20200822 1.2 2.3 2.0 0.0 0.0 0.0 0.0
Week 5 20200823 20200829 0.9 1.5 1.0 0.0 0.0 0.0 0.0
Week 6 20200830 20200905 0.5 0.0 0.0 0.0 0.0 0.0 0.0
30 Day 20200726 20200824 3.0 3.6 2.8 0.0 0.0 0.0 0.0
https://i.imgur.com/Z0fxlo1.gif
So how many did it predict for July?
0 likes
-
supercane4867
- Category 5
- Posts: 4966
- Joined: Wed Nov 14, 2012 10:43 am
Re: 2020 Indicators: SST's / SAL / MSLP / Steering / Shear / Instability / Sat Images
St0rmTh0r wrote:So how many did it predict for July?
This is from a month ago on June 26. It predicted a mere 1 storm for the next 30 days.
Storm Count Forecast
RAW NUMBERS
PERIOD START END ATL ENP WNP NI SI AUS SP
-----------------------------------------------------------
Week 1 20200626 20200702 0.1 2.0 0.7 0.2 0.0 0.0 0.0
Week 2 20200703 20200709 0.4 2.3 0.9 0.9 0.0 0.1 0.0
Week 3 20200710 20200716 0.9 2.5 0.6 1.2 0.4 0.0 0.1
Week 4 20200717 20200723 0.9 2.1 0.6 0.9 0.8 0.0 0.1
Week 5 20200724 20200730 0.5 0.7 0.3 0.4 0.8 0.0 0.1
Week 6 20200731 20200806 0.0 0.0 0.0 0.0 0.0 0.0 0.0
30 Day 20200626 20200725 1.4 4.5 1.8 1.7 0.8 0.1 0.1
BIAS CORRECTED
PERIOD START END ATL ENP WNP NI SI AUS SP
-----------------------------------------------------------
Week 1 20200626 20200702 0.0 1.1 0.2 0.0 0.0 0.0 0.0
Week 2 20200703 20200709 0.0 0.7 0.3 0.3 0.0 0.0 0.0
Week 3 20200710 20200716 0.3 1.4 0.3 0.5 0.1 0.0 0.0
Week 4 20200717 20200723 0.4 1.3 0.2 0.2 0.3 0.0 0.0
Week 5 20200724 20200730 0.0 0.1 0.0 0.0 0.3 0.0 0.0
Week 6 20200731 20200806 0.0 0.0 0.0 0.0 0.0 0.0 0.0
30 Day 20200626 20200725 0.1 2.9 1.1 0.3 0.2 0.0 0.0
0 likes
-
supercane4867
- Category 5
- Posts: 4966
- Joined: Wed Nov 14, 2012 10:43 am
Re: 2020 Indicators: SST's / SAL / MSLP / Steering / Shear / Instability / Sat Images
Also you can notice a high bias for EPAC on those NCEP models(which includes the CFS). They have modeled many phantom storms over there that didn't pan out.
0 likes
-
StruThiO

- Category 3

- Posts: 821
- Age: 26
- Joined: Fri Sep 15, 2017 5:51 am
- Location: Currently Portland, OR. Raised in Jax, FL.
Re: 2020 Indicators: SST's / SAL / MSLP / Steering / Shear / Instability / Sat Images
Surface pressures have been extremely low in the MDR lately:


note the monsoon trof extending along 13N in July
note the monsoon trof extending along 13N in July
1 likes
-
gatorcane

- S2K Supporter

- Posts: 23708
- Age: 48
- Joined: Sun Mar 13, 2005 3:54 pm
- Location: Boca Raton, FL
Re: 2020 Indicators: SST's / SAL / MSLP / Steering / Shear / Instability / Sat Images
USTropics wrote:TheStormExpert wrote:gatorcane wrote:Anybody have any thoughts how/if the much warmer than normal pocket of water in the northern Pacific might impact potentially any steering in the Atlantic? One thought I have is maybe it causes a more progressive pattern as lows that track over the area might get stronger than normal which might cause perturbations in the jet stream across North America and Atlantic especially in the fall as mid-latitude lows traverse the Pacific. This progressive pattern might in turn impact the strength and and location of the Bermuda high causing it to be a bit weaker and more transient than normal?
https://i.postimg.cc/9FC3BQYd/ssta-daily-current.png
I’ve noticed the pattern has become more progressive in recent weeks. Likely has to do with that warm blob.
There's still quite a bit of research into the warm "Blob" (or marine heatwave) that's situated off the coast of Alaska/Canada. It's more of a reflection of localized weather patterns, meaning the marine heatwave is a result of other atmospheric processes (i.e. a persistent ridge of high pressure relaxes winds and ocean surface mixing in that localized area, affecting the upper layers of the ocean). Looking further, a persistent band of high pressure extending to the Bering Sea/Alaska (as observed in 2014/2015) is a leading cause for the ridging and this persistent marine heatwave. Prolonged blocking events (which actually occur more frequently when the atmosphere is favoring La Nina in the North Pacific) and pattern shifts in the MJO are contributing factors as well.
TL;DR the prolonged marine heatwave likely has no effect (or research support) on steering patterns over North America/Atlantic basin, but is more of a reflection of larger atmospheric processes at play. Effects are contained locally (mainly marine life).
If you want to read more, check out this article - https://www.climate.gov/news-features/blogs/enso/seeing-red-across-north-pacific-ocean
Thanks this looks like a good read!
2 likes
Re: 2020 Indicators: SST's / SAL / MSLP / Steering / Shear / Instability / Sat Images
St0rmTh0r wrote:supercane4867 wrote:Looks like CFS is forecasting 3-4 storms developing in August with mostly recurve tracks. The path in week 1 should be 92L.Storm Count Forecast
RAW NUMBERS
PERIOD START END ATL ENP WNP NI SI AUS SP
-----------------------------------------------------------
Week 1 20200726 20200801 1.1 0.2 0.1 0.3 0.0 0.0 0.2
Week 2 20200802 20200808 0.3 0.9 0.9 0.3 0.2 0.0 0.1
Week 3 20200809 20200815 0.7 2.4 1.6 0.7 0.5 0.0 0.1
Week 4 20200816 20200822 1.8 3.1 2.5 0.8 0.4 0.0 0.1
Week 5 20200823 20200829 1.3 1.7 1.4 0.7 0.2 0.0 0.0
Week 6 20200830 20200905 0.0 0.0 0.0 0.0 0.0 0.0 0.0
30 Day 20200726 20200824 3.4 4.3 3.5 1.4 0.5 0.0 0.3
BIAS CORRECTED
PERIOD START END ATL ENP WNP NI SI AUS SP
-----------------------------------------------------------
Week 1 20200726 20200801 0.7 0.0 0.0 0.0 0.0 0.0 0.0
Week 2 20200802 20200808 0.0 0.3 0.7 0.0 0.0 0.0 0.0
Week 3 20200809 20200815 0.1 2.0 0.8 0.0 0.2 0.0 0.0
Week 4 20200816 20200822 1.2 2.3 2.0 0.0 0.0 0.0 0.0
Week 5 20200823 20200829 0.9 1.5 1.0 0.0 0.0 0.0 0.0
Week 6 20200830 20200905 0.5 0.0 0.0 0.0 0.0 0.0 0.0
30 Day 20200726 20200824 3.0 3.6 2.8 0.0 0.0 0.0 0.0
https://i.imgur.com/Z0fxlo1.gif
So how many did it predict for July?
Epic fail is an understatement.
0 likes
Re: 2020 Indicators: SST's / SAL / MSLP / Steering / Shear / Instability / Sat Images
StruThiO wrote:Surface pressures have been extremely low in the MDR lately:
https://i.imgur.com/DE7ZsXV.png
https://i.imgur.com/zePCMR2.png
https://i.imgur.com/vVPdlxv.png
note the monsoon trof extending along 13N in July
Well no wonder there has been early CV activity. This is a very bad sign for the peak of hurricane season. I see another strong wave behind 92L so this is getting serious. I think August and September is gonna break records. I've never seen signs this strong for hyperactivity in a season. 5 storms in July I made a prediction of 10 storms forming in the August poll. I'm sticking to that. September could see even more activity
0 likes
Re: 2020 Indicators: SST's / SAL / MSLP / Steering / Shear / Instability / Sat Images
NDG wrote:tolakram wrote:To all who are criticizing the CFS post.
This IS the place to discuss what the longer range models are showing. You don't have to like it, but the proper response would be to discuss how the CFS has done in the past and not criticize a poster for discussing it. Telling us not to believe the long range models in a thread about discussing long range trends and models is a bit awkward, to say the least.
I agree, if we are going to disagree with a forecast and or model lets show our evidence.
Well the fact that 4 going on 5 storms have formed this month when the CFS predicted 1 is all the evidence we need.
0 likes
Who is online
Users browsing this forum: No registered users and 286 guests